 Are you creating YouTube videos?
Wondering how to analyze the impact of your video content?
In this article, you'll discover how to measure the performance of YouTube videos.
#1: Assess Video Watch Behavior
YouTube provides powerful analytics data that lets you evaluate how your videos are performing and how you might improve your video content in the future.
To access your analytics, open Creator Studio and select Analytics in the left navigation.
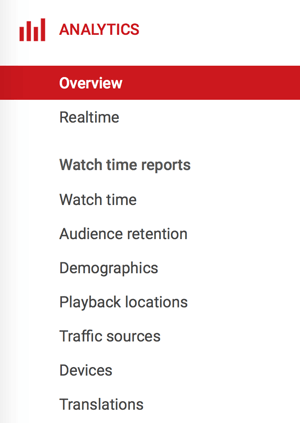
Under Watch Time Reports, you'll find data about video watch behavior and the audience viewing your videos.
Watch Time
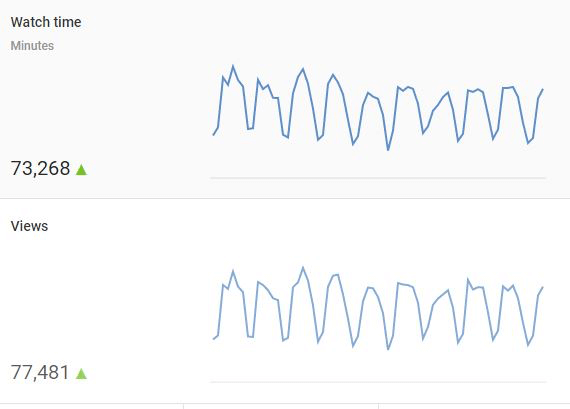
In the Watch Time report, you can see information about watch time and views. “Watch time” refers to the amount of time (in minutes) that viewers have watched a video.
“Views” is the number of times a video has been watched. This metric used to be the main way to assess a video's popularity, but don't be fooled by this number. While it's great to have lots of views, this metric only shows the number of times a video player loaded; it doesn't say much about viewer engagement or whether the viewer wanted to see the video or kept watching.
Audience Retention
Audience retention is an important metric because it indicates how well your video content keeps viewers' attention. You can determine on average how long people are watching your videos (in other words, when they're dropping off).
Above the graph, click Absolute Audience Retention to see the number of views for every part of your video. If the majority of viewers are leaving within the first few seconds of watching, they were likely interested enough to click on the video, but it didn't hook them.
If viewers drop out around the middle of the video, they were interested but something happened. Maybe it was a technical issue, like the sound dropping out, or maybe the video was just too long. In any case, you can use these insights to improve your future videos.
Which AI Moves Actually Matter?
That's what every marketer is wrestling with now. New AI strategies, new tools, new takes every week — but no clarity. Most marketers and business owners are trying to figure out AI alone.The AI Business Society is your trusted guide. Get expert-led training you can put to work immediately. Plus a community of marketers sharing what's actually working.
I'M READY FOR REAL AI RESULTS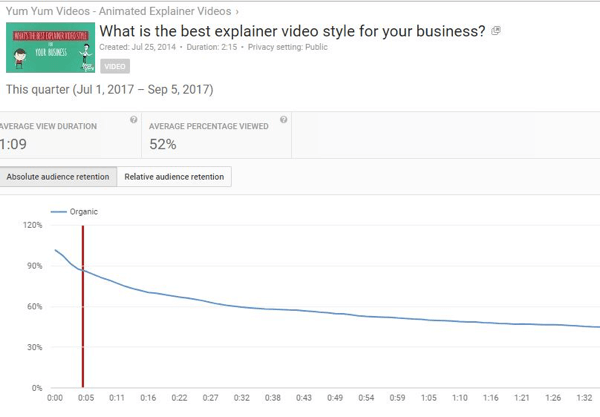
Click Relative Audience Retention to see how well your video is performing in relation to similar YouTube videos.
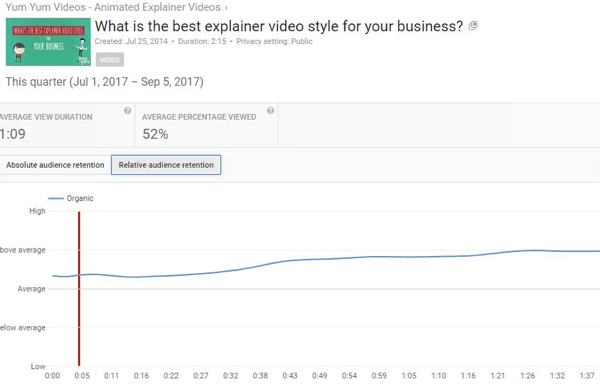
The average view duration metric indicates the average amount of time viewers watch before dropping off. YouTube lets you filter this data by geography, content, date, and other information.
You can also view the average percentage of the video that was viewed; that is, the average percentage of a video your audience watches per view.
Demographics
Knowing more about your viewing audience will help you determine if your video is reaching the right people. On the Demographics report, you can see an overview of the age, gender, and geographic location of your viewers.
When you open this report, you see a chart based on age ranges and gender.
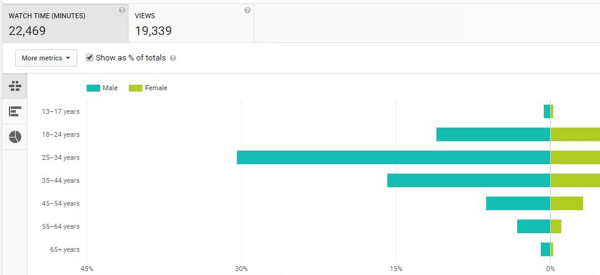
Scroll down below the chart to find options to sort the data by geography and device type. These useful insights can help you optimize your content, tags, and thumbnails.
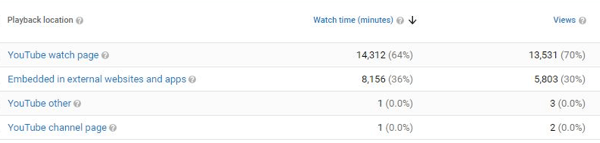
Playback Locations
On the Playback Locations report, find out where your videos are being streamed from, such as a YouTube watch page, the URL for your video, your YouTube channel page, or other websites or apps that have embedded the video.
Traffic Sources
Open this report to get insights into how and where your viewers found your video. This data helps you learn more about your viewing audience.
For instance, you can determine if viewers found your video through YouTube search, suggested videos, or external sources such as embedded links on other sites or social media links.
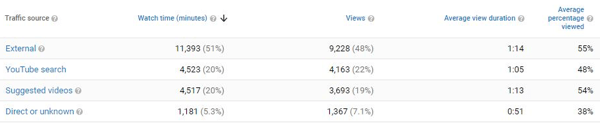
Is your video ranking high in Google search and YouTube search? If not, it may be a good indicator that you need to adjust your keywords and tags.
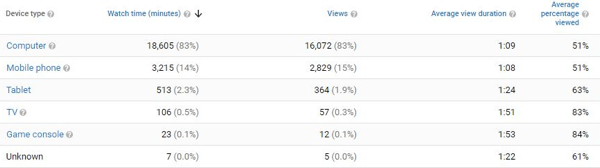
Devices
The Devices report shows the different devices and operating systems that your audience uses to play your videos.
3 Days of World-Class Training—Zero Travel!

Couldn't make it to Social Media Marketing World and AI Business World this year? Get all of the great content at a fraction of the price with a Virtual ticket.
That’s full access to recordings of every keynote, workshop, and session—the ones people travel thousands of miles to see. Don't wait. Get your Virtual ticket and enjoy actionable content that you can watch anytime, anywhere.
#2: Evaluate Audience Engagement
YouTube's Engagement reports give you an overview of the quality of your viewers. There's no point in having millions of views if people aren't interacting with your brand.
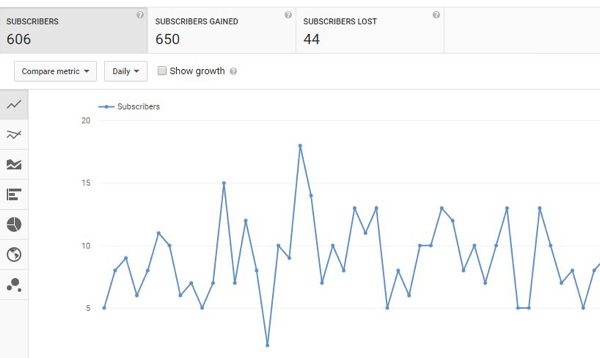
Subscribers
Of course you want to have a large number of channel subscribers. It means those viewers were so captivated by your videos that they didn't want to miss the next one.
In the Subscribers report, you can track the growth of your channel's subscribers over time. If you see a significant loss in total subscribers, it may be an indication there's something wrong with your content.
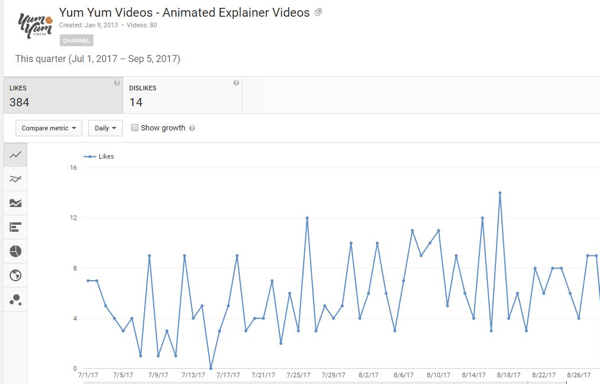
Likes and Dislikes
On the Likes and Dislikes report, you can find out how many people liked and disliked your videos over time. This data is a reflection of emotional reactions; however, because videos generally have no more than 1% of viewers register likes and dislikes, this data isn't very representative. Unless you notice a huge increase in dislikes, don't fret over this metric.
Comments
The number of comments for your videos is another good indicator of engagement. It demonstrates the viewer's intention to interact with you, which is important for any social network. You can view the overall Comments report for your channel or for each video. Remember to always read through the comments to analyze whether you received positive or negative feedback.
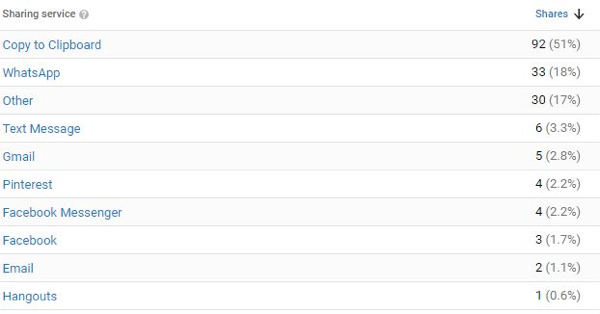
Sharing
Shares is an interesting metric because it shows how many times your content has been shared on social media using the Share button. This metric indicates that viewers not only watched your video but were also engaged enough to share it on Facebook, Twitter, or other sites.
#3: Calculate Referral Traffic
So far, we've talked about the main metrics you'll find in the YouTube analytics dashboard. This data helps you better understand your audience and how they're engaging with your content. If you want to find out how much traffic YouTube is driving to your website, you can connect your Google Analytics account with your YouTube channel.
Connect YouTube With Google Analytics
To connect your channel, sign into Google Analytics and click the Admin button. From the Property drop-down list, select Create New Property.
On the next page, enter your YouTube channel's URL and then click Get Tracking ID. Write down the tracking ID.
Now sign into YouTube and go to your Advanced Settings. Scroll to the bottom of the page and enter your Google Analytics tracking ID, and then click Save.
Now you can start tracking YouTube analytics metrics in Google Analytics and see the impact your channel has on your website.
View Referral Traffic From YouTube
Once your channel is connected to Google Analytics, you can find out how many of your website's visitors came from YouTube. To view this data, go to Acquisition > All Traffic > Referrals.
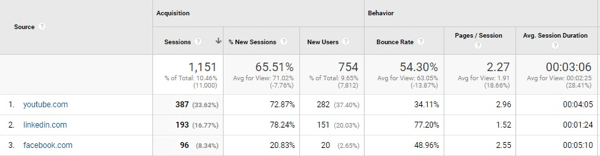
In the search bar, type “youtube.com” to see the total number of sessions driven from YouTube. You can also view the average session duration and bounce rate (the percentage of your visitors who exited your site after a single-page session). This data gives you a snapshot of the quality of visitors you got from YouTube.
If you want to look at the conversion rates of different social networks, go to Social > Conversions.
From the top menu, choose a conversion type, which is determined by specific goals such as purchases or newsletter subscriptions. You'll find the conversion rate and value from YouTube visits, along with other social media sites, integrated with your Google Analytics account.
Want more like this? Explore YouTube for Business!
.
Conclusion
Analyzing YouTube metrics might seem overwhelming at first, but it's crucial to assessing your channel's performance. Find out more about viewers, how they discovered your videos, whether they liked your content or got bored, and more to help you improve your future videos.
What do you think? Do you regularly review your YouTube analytics data? Which YouTube metrics matter to your business? Feel free to comment below!

Curious About How to Use AI?
Our newest show, AI Explored, might be just what you're looking for. It's for marketers, creators, and entrepreneurs who want to understand how to use AI in their business.
It's hosted by Michael Stelzner and explores this exciting new frontier in easy-to-understand terms.
Pull up your favorite podcast app and search for AI Explored. Or click the button below for more information.
