Do you really know which of your Facebook ads produce customers and revenue? Is Facebook telling you one thing and Google Analytics saying something different?
In this article, you'll discover how to use Facebook and Google Analytics together to reveal how your Facebook customers engage with your funnel on their path to purchase.
The Attribution Challenge
One of the most common issues that online store owners and marketers face is not knowing which ads, channels, and campaigns are actually responsible for conversions, new customers, and revenue. This makes it virtually impossible to know where to allocate budget to grow their business.
That's where understanding attribution comes in.
Today, an online purchase on the first website visit rarely happens. It takes multiple touchpoints before a customer is ready to pull out their credit card and make an online purchase. The last-touch attribution model—which credits everything to the last ad or traffic source the customer clicked or viewed before converting—is outdated.
Looking at a typical customer journey timeline will show you why:
- 8:50 AM—While on their way to work, someone browsing their social media feed on a mobile device sees a prospecting ad.
- 8:55 AM—They click on the ad to check out the product on the company's website.
- 8:59 AM—Before adding the item to a cart, they arrive at work and end the session.
- 5:00 PM—After the workday ends, they're at home browsing social media and are served a remarketing ad for the same product. They click on that ad and complete the purchase.
Because Facebook Ads Manager shows only last-click attribution, you'll see the conversion coming from the remarketing campaign and might decide to turn off the prospecting campaign because it isn't showing any conversions. In reality, the prospecting ad is the most important part of the funnel. Without that prospecting ad, the consumer wouldn't have seen the product they wanted to buy.
To avoid making mistakes like this, you need to track your traffic and the conversion metrics from the top of the funnel all the way down to the bottom.
Facebook Analytics and Facebook Attribution can help. But first, I want to quickly explain some basic tracking fundamentals.
How Attribution Credit Is Applied to Conversions
There are two types of attribution events:
- A view attribution assigns credit for a conversion when someone takes action after viewing your ad.
- A click attribution assigns credit for a conversion when someone takes action after clicking your ad.
The period of time you allow between a view or click event and a conversion, for the ad to receive credit for the conversion, is called the attribution window.
The standard attribution window for a click on an ad is usually 28 days for Facebook and 30 days for Google. A 28-day click attribution means that anyone who converts (e.g., purchases) within 28 days of clicking an ad will be marked as a conversion for that ad.
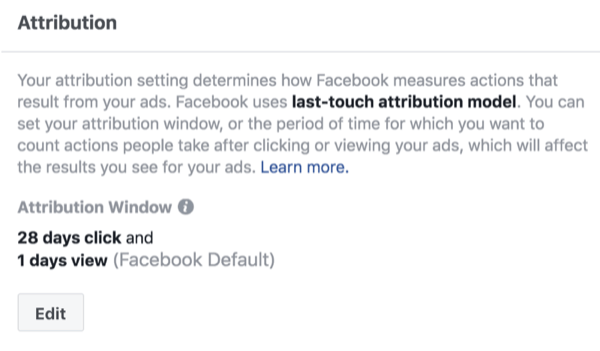
The standard attribution window for a view is 1 day. A 1-day view attribution is anyone who converted within the last day (24 hours) of seeing an ad. This conversion will be attributed to the ad they saw. If they convert after 2+ days since seeing the ad, that conversion won't be attributed to that ad.
Get World-Class Marketing Training — All Year Long!
Are you facing doubt, uncertainty, or overwhelm? The Social Media Marketing Society can help.
Each month, you’ll receive training from trusted marketing experts, covering everything from AI to organic social marketing. When you join, you’ll also get immediate access to:
- A library of 100+ marketing trainings
- A community of like-minded marketers
- Monthly online community meetups
- Relevant news and trends updates
If a person sees one ad and clicks on another ad within 1 day, the click has more weight/value than the view so the ad that drove the click will get attributed the conversion.
Facebook Ads Manager and Facebook Attribution track conversions differently:
- Ads Manager logs the conversion on the day the customer interacted with the ad.
- Facebook Attribution logs the conversion the day it actually occurred.
To visualize this, if someone clicked on an ad on the 12th of the month but didn't purchase until the 25th, Ads Manager would record the conversion on the 12th while Facebook Attribution would record the conversion on the 25th.
In addition, Facebook and Google have different ways of tracking traffic and customers so the data you find won't match up 100%. You'll likely see a 5%–10% discrepancy.
Facebook uses people-based tracking, which means they leverage a persistent Facebook login (browser pixel, widgets, or apps) to track people across publishers, channels, and devices both on and off of Facebook. Google uses cookie-based tracking, which means the tracking code creates users and sessions. Unique identifiers are created through a cookie to make this possible.
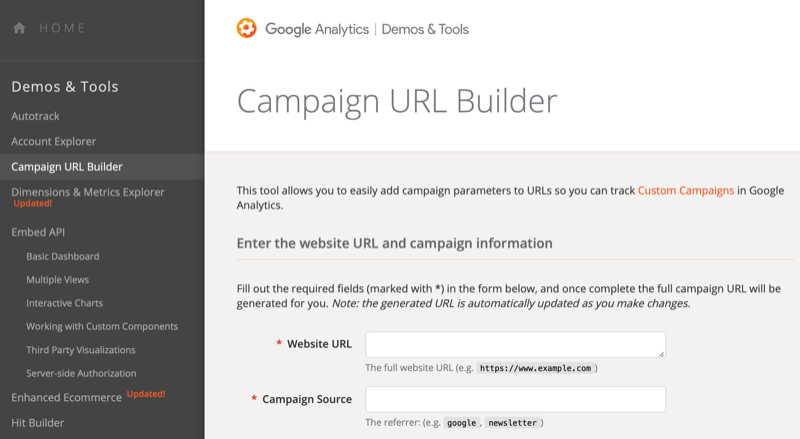
Remember: To analyze your data easier and more accurately in all three tools, make sure you're adding UTMs to all of your ads and links. A tool like Google's Campaign URL Builder can help.
Now let's move on to using Facebook Analytics, Facebook Attribution, and Google Analytics to track attribution and conversions.
Facebook Analytics Reports
Facebook Analytics really comes down to segmentation of customers, leveraging the Facebook pixel and social engagement data from your social media channels. This degree of customer segmentation gives you a lot of insight into who your customer is and what their conversion path looks like.
This tool was built to help you understand your traffic and the steps customers take on your website to get to the conversion goal such as a purchase, lead, download, and so on. Facebook Analytics allows you to segment traffic, look at conversion funnels, examine revenue drivers, and other information.
Here are the main reasons to use Facebook Analytics:
- Understand the customer journey through your website.
- See the cross-device behavior of conversions.
- See the time delay between conversion path steps or repeat purchases.
- Track social engagements to conversion.
- See delayed (past the attribution window) conversions from prospecting campaigns.
After you set up Facebook Analytics, make sure you have enough data. Too little and it won't be significant enough to give you valuable insight. Aim for 30+ days or 100+ conversions.
There will always be ups and downs in your data, good days and bad ones. Look at a minimum of 7 days but I suggest 30 days as a good benchmark.
#1: Understand the Time Customers Spend in Each Stage of Your Funnel
In Facebook Analytics, you can build funnels to better understand your customer and the checkout journey.
To create a funnel, go to the Funnels section under Activity in the left navigation. Then click Create Funnel on the right.
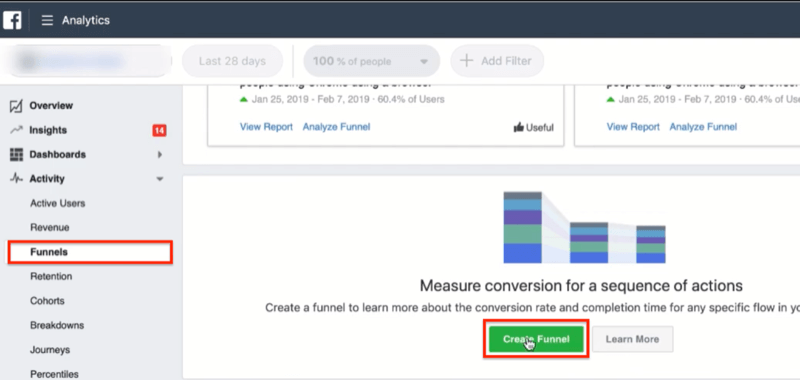
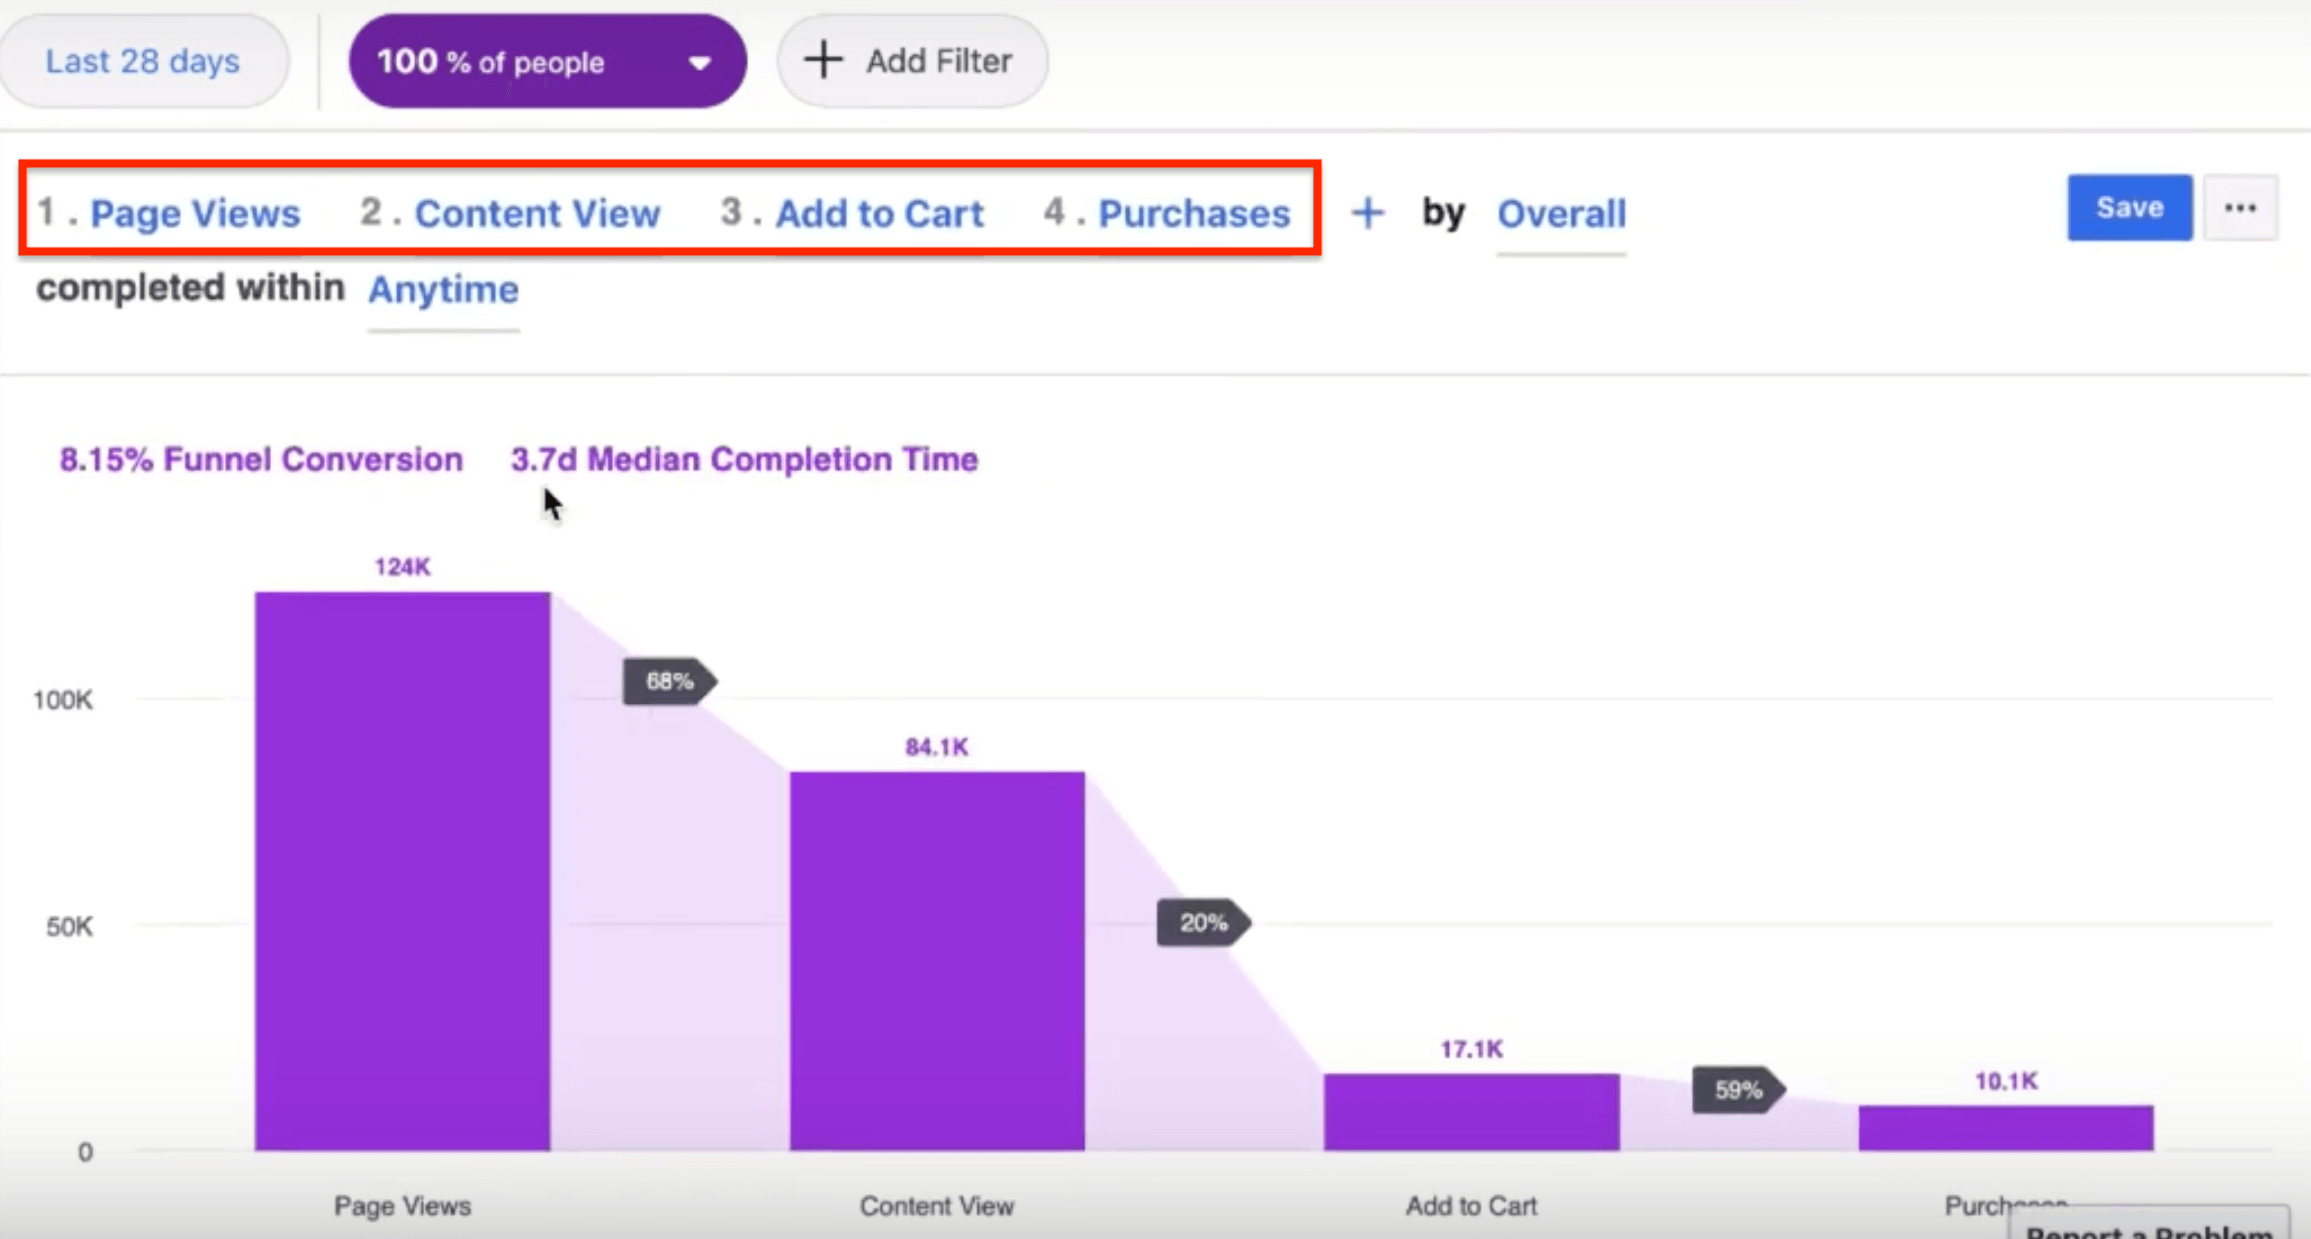
Now map your checkout flow from page view to purchase. A page view is usually how people enter the funnel. Then they view content (typically a product page if you're an eCommerce store), add something to their cart, and finally check out.
In this example, you can see that it takes 3.7 days on average for customers to complete the funnel, and the conversion rate of the funnel is 8.15%.
If you scroll to the bottom of the funnel results, you can view the average time spent at each stage. Here, it takes about a week before people move past the first view to the add to cart stage.
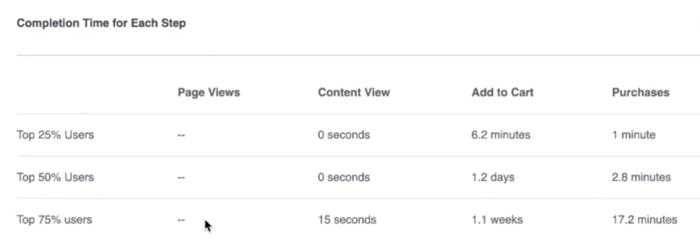
Use the analytics data for your funnel to set your bid optimization to either 1-day or 7-day click.
Also note the delay between purchases. Set the funnel to “purchase then purchase.”
Pro Tip: You can use the New User Activity option to see the conversion path length of only new users to purchase.
#2: Analyze Top-of-Funnel Lead Conversions by Campaign
In Facebook Analytics, you can track the end result of a top-of-funnel campaign like a lead magnet, giveaway, or quiz. This lets you see if the people who download the lead magnet, enter the giveaway, or complete the quiz turn into customers further down the line.
In Facebook Ads Manager, you can only see 28-day click and last touch as an attribution model, which means the last touchpoint gets credit for the conversion. It doesn't show whether someone came in on a giveaway, visited the website and left, and then saw a remarketing ad and converted from that. The remarketing ad will get credit for the conversion, not necessarily the top-of-funnel campaign that introduced your brand to that person.
To see whether the traffic from the lead magnet, giveaway, or quiz turned into revenue, go to the Revenue section in Facebook Analytics.
Next, you want to add filters to see how the revenue shown here was generated. At the top of the page, click Add Filter and select Create New Filter from the drop-down menu.
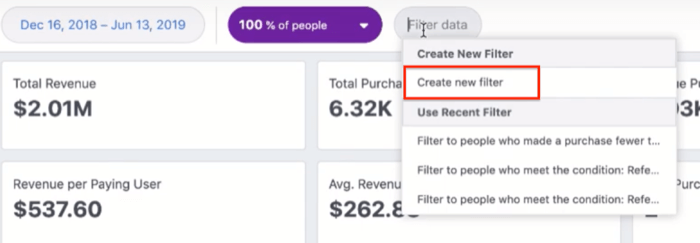
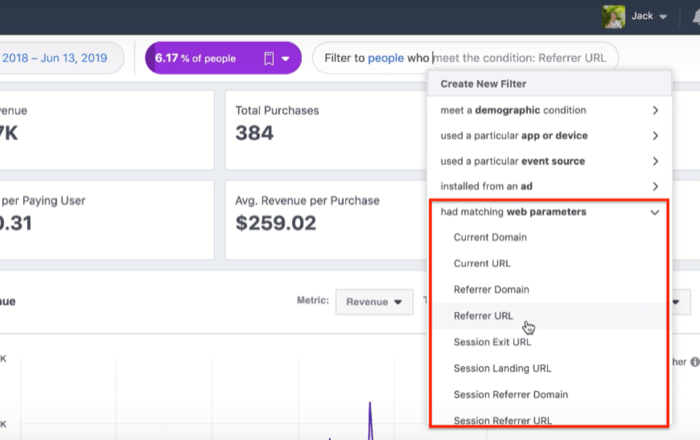
You'll then see a variety of filters to choose from. You want to filter the revenue by your top-of-funnel campaign so you can see who came through and ended up converting (even if it was a few months later, in the case of campaigns with longer sales funnels).
One way to do this is to select the Had Matching Web Parameters option and choose one of these options:
- Referrer Domain: See if any users who visited the campaign page ever converted.
- Session Referrer URL: Find out if any users who found your website through your campaign converted during that referral session. A session is the time the user spent on the website; one user can have multiple sessions.
- UTM Campaign Content: If you tagged your Facebook ad campaign with a UTM, you can see if anyone who clicked on that campaign ended up converting.
If you created a custom event (e.g., the Lead event triggers when someone signs up for your giveaway), you can choose Create New Filter > Performed an Event > Lead to see if those leads ever turned into customers.
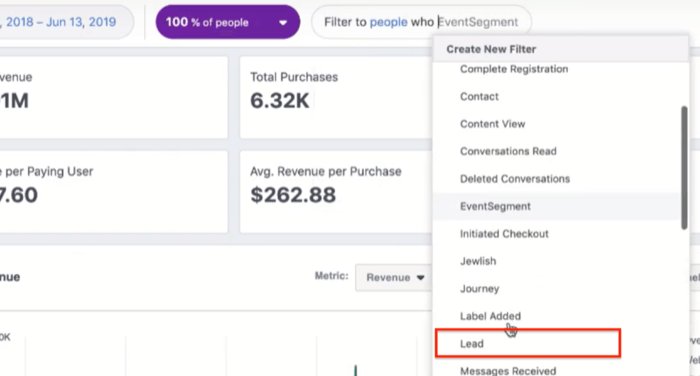
After you apply this filter, Facebook Analytics shows you how many people completed that lead event and how much revenue was generated. In the example below, people who completed that lead event (signed up for the giveaway) generated $91,700.

Check out this video to learn more about how to use Facebook Analytics to see how your traffic turns into revenue and customers:
#3: Identify Your Most Valuable Customers
Now we'll look at how to use Facebook Analytics to find your most valuable customers and then use that information in your Facebook ad buying strategies.
Start by opening the Percentiles tab in Facebook Analytics. This view will show the highest-value people in your entire audience.
Scroll down to the Purchases graph to find out what the top 25% of your customers are spending. In this example, the top 25% spend $540+ on average.
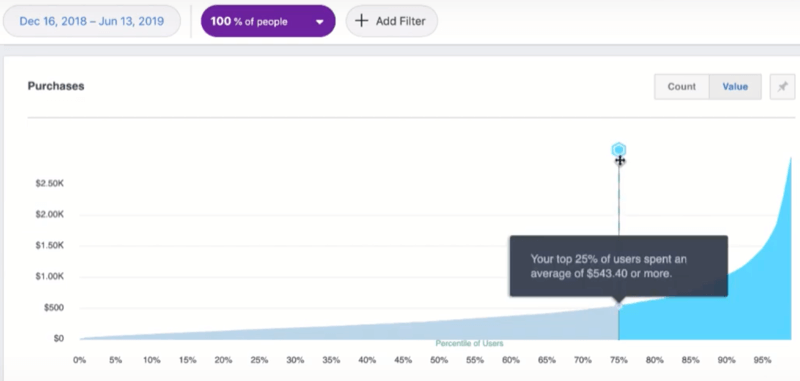
Once you have this information, go to your Audiences dashboard and create two custom audiences from website traffic:
- Top 25% LTV (lifetime value) or AOV (average order value) users
- Top 25% page view or view content users
When you create these custom audiences, select the purchase event and choose a time period (180 days by default).
Then click Refine By to refine this purchase event. From the three drop-down menus, choose Sum Of > Value > Is Greater Than (>) and enter the $ amount. In this case, you want to create an audience of people who spent more than $540 because you know this is your most valuable group of customers.
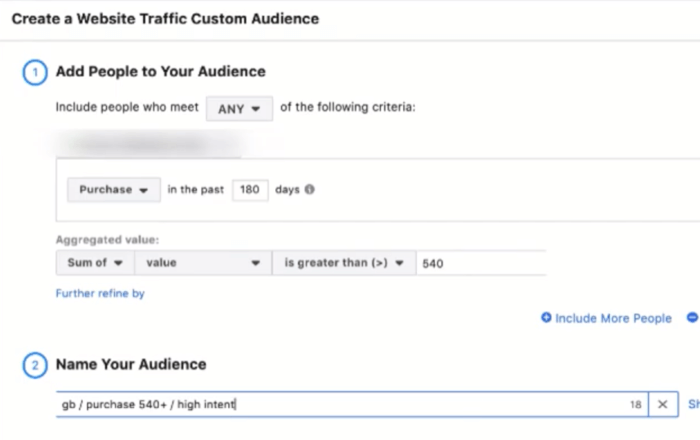
Once you've created custom audiences of your most valuable customers, you want to create lookalike audiences based on them.
Typically, I create six lookalike audiences: 1%, 2%, 3%, 4%, 5%, and 5%–10%. These lookalikes tend to work well because you're taking your best audiences and creating more audiences like them.
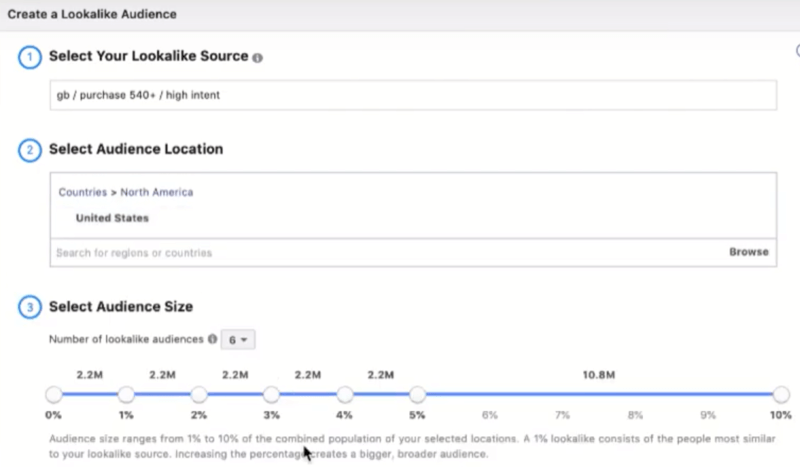
After you choose the country you're targeting, click Create Audience to create your lookalikes. Now start using them in your ad campaigns.
Pro Tip: Save the Facebook Analytics reports you look at most frequently. This will save you a lot of time.
Facebook Attribution Reports
The Facebook Attribution tool is designed to compare attribution model types and conversion attribution windows. It brings all of your traffic channels into one dashboard so you can look at spend interaction among all channels together. The Attribution tool helps you segment your traffic sources and look at the different types of attribution.
Here are the main reasons to use the Facebook Attribution tool:
- See the full customer journey tracking past the 28-day click.
- Do multi-attribution, -channel, and -source comparisons.
- Give equal value to the first and last touchpoint of your funnel (super-important).
- Look at the customer journey through your Facebook campaigns.
- Measure conversion performance and impact cross-channel (add other traffic sources).
There are seven types of attribution models available in Facebook Attribution:
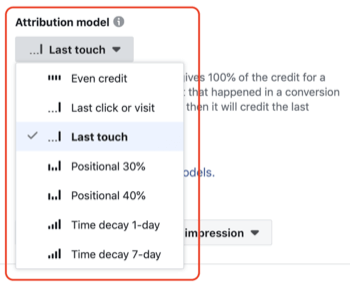 Even Credit: gives an equal percentage of the credit for a conversion to each touchpoint on a conversion path. You can start here if you don't know what your funnel looks like and just want a general idea of channels compared evenly.
Last Click or Visit: gives 100% credit to the last click or visit that happened in a conversion path. This is the model that Google Analytics uses by default.
Last Touch: gives 100% of the credit for a conversion to the last click or visit that happened in a conversion path. If there was no click or visit, it will credit the last impression. This is the most common model and what ad platforms usually use by default. It favors remarketing the most.
Positional 30%: gives a specific percentage of the credit for a conversion to the first and last touchpoints in a conversion path, with the remaining credit distributed evenly across all other touchpoints.
Positional 40%: gives a specific percentage of the credit for a conversion to the first and last touchpoints in a conversion path, with the remaining credit distributed evenly among all other touchpoints. This is the model I prefer to use because it gives the best value to the full funnel.
Time Decay 1-Day: gives an increasing percentage of the credit for a conversion to touchpoints as they get closer in time to the conversion.
Time Decay 7-Day: gives an increasing percentage of the credit for a conversion to touchpoints as they get closer in time to the conversion.
If you haven't already set up the Facebook Attribution tool, this article walks you through the process. After you set it up, wait 15–30 days to collect enough data.
#4: Track the Customer Journey Across Devices
The Facebook Attribution tool can reveal how customers are using desktop and mobile devices to purchase your product. To access this data, navigate to the Attribution tool.
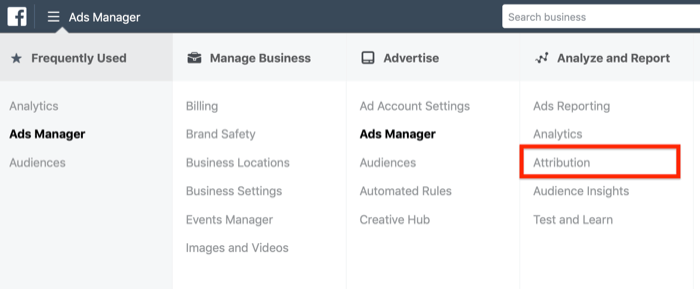
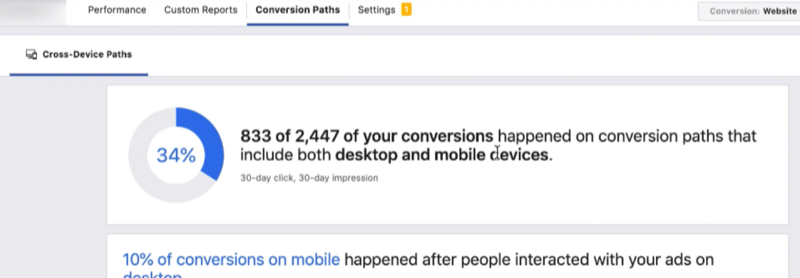
On the Attribution tool dashboard, click the Conversion Paths tab and select Cross-Device Paths.

Discover Proven Marketing Strategies and Tips
Want to go even deeper with your marketing? Check out the Social Media Marketing Podcast! Publishing weekly since 2012, the Social Media Marketing Podcast helps you navigate the constantly changing marketing jungle, with expert interviews from marketing pros.
But don’t let the name fool you. This show is about a lot more than just social media marketing. With over 600 episodes and millions of downloads each year, this show has been a trusted source for marketers for well over a decade.
Now let's look at what the information tells you.
First, it reveals how many people who purchase from you actually engage with both desktop and mobile.
In the example below, 34% of conversions happened on conversion paths that included both desktop and mobile devices. So 1 in 3 customers sees this company's ads on desktop and mobile before making a purchase.
If you scroll down to the next section, you can view details about the devices used by people who check out on mobile.
The image below reveals that a very small percentage of people see this company's ads on desktop and then check out on mobile. Most of the people are seeing the ads on mobile and are checking out on mobile.
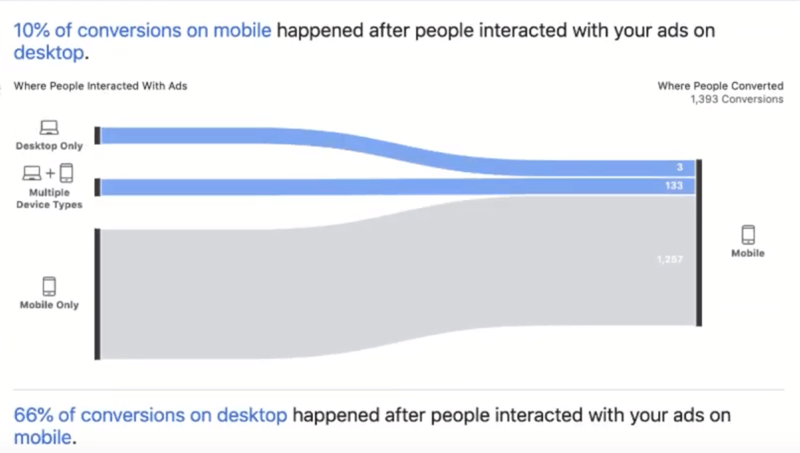
The next section shows details about the people who are checking out on desktop. The results below show that the majority of people are seeing ads on desktop and mobile before checking out on desktop. A smaller number of people are seeing ads on desktop and checking out on desktop.
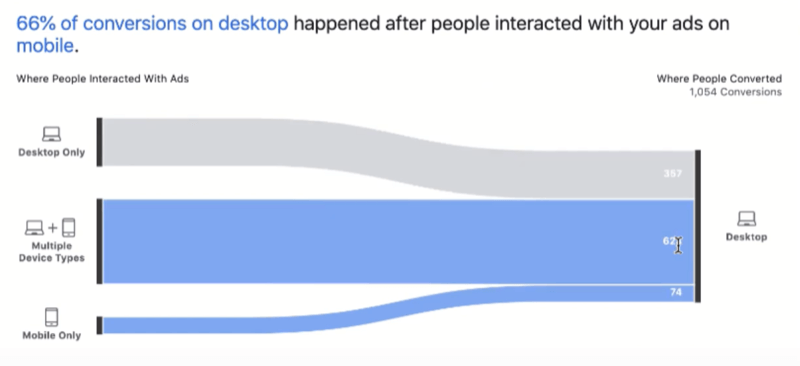
The takeaway from these results is that it's all about mobile. You'll want to double-check the stats for your business, but you're likely to see similar results. This means people are either finding out about your brand on mobile and checking out on mobile, or they're finding out about your brand on mobile and then checking out on desktop.
Either way, the first entry point to your website—and first impression—will probably be through mobile. So make sure you're optimizing your website, checkout flow, and any remarketing you do for mobile.
#5: Compare Multiple Attribution Models to Reveal Profitable Revenue Sources
The main reason to use the Facebook Attribution tool is to compare different attribution models. Here's how to do that.
In the top right of the Attribution tool dashboard, select the conversion you want to measure (such as Website Purchases for most stores) and the date range you want to see.
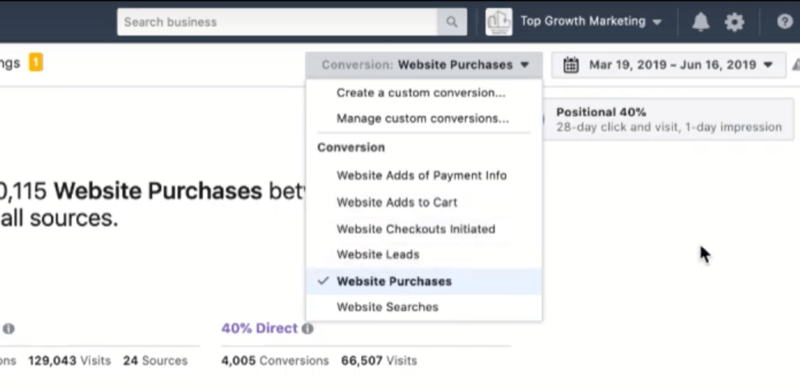
Below the date, click the currently selected attribution model. This opens a window where you can change models and attribution windows so you can compare them. As mentioned above, there are seven attribution models you can choose from.
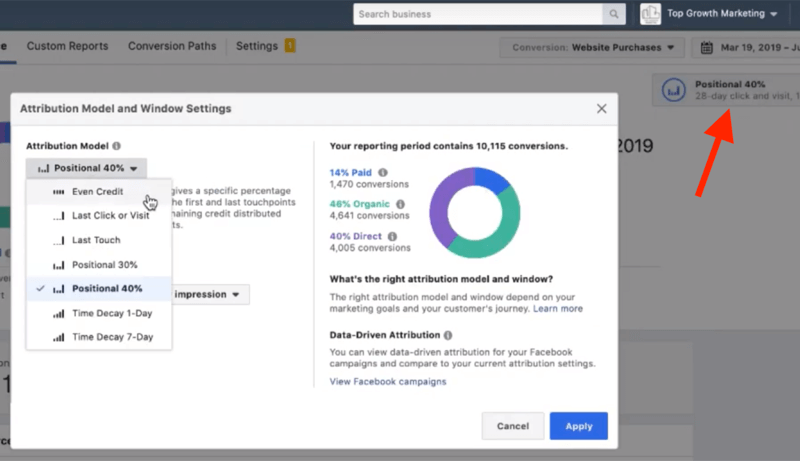
When comparing attribution models, I recommend focusing on the Last Touch (or Last Click or Visit) and Positional 40% models. You want to compare attribution models to see how users interact with your channels and campaigns. Choose the attribution window that best suits your business; the more expensive the product, the longer the window should be.
Start by selecting the Last Click or Visit model. On the right side of the window, you'll see total conversions and what percentage of those conversions are attributed to paid, organic, and direct.
In this example, 5% is paid, 51% is organic, and 44% is direct.
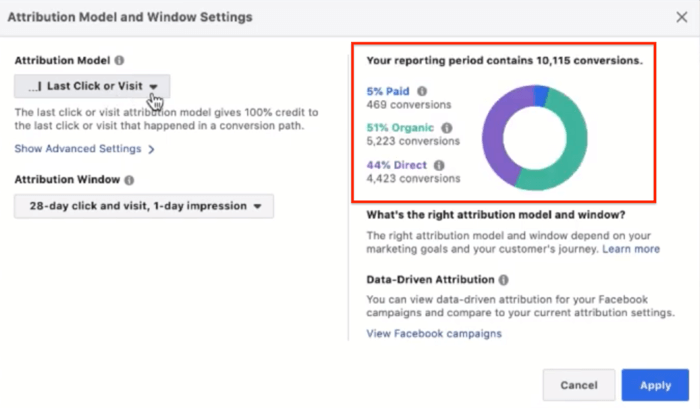
Once you've selected the attribution model and window, click Apply in the lower-right corner of the window.
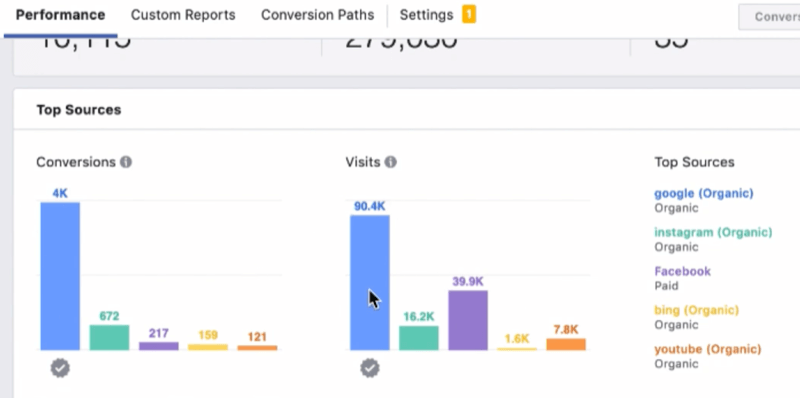
Now scroll down the page to the Top Sources section and note any large discrepancies between conversions and visits.
In the image below, the amount of Facebook paid traffic (39.9K) to conversions (217) is a red flag. It suggests you're spending a lot of money on Facebook ads but not getting a lot of conversions.
If you scroll down a little further on the page, you can see how this all breaks down.
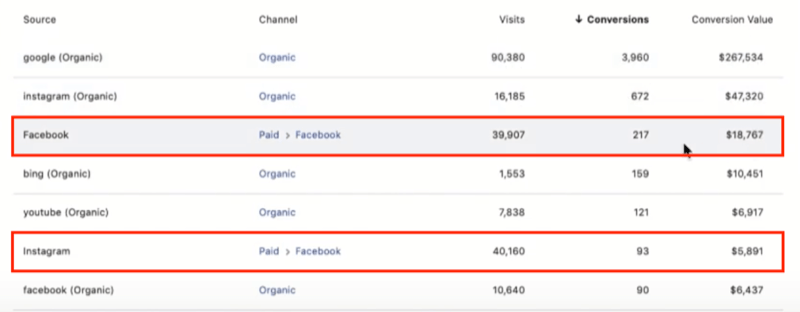
In the example below, focus on Facebook paid and Instagram paid. With the last-click model, it's only attributing $18,767 to everything you're spending on Facebook and $5,891 to everything you're spending on Instagram.
And out of the 10,115 total conversions, only 310 can be attributed to Facebook and Instagram ads.
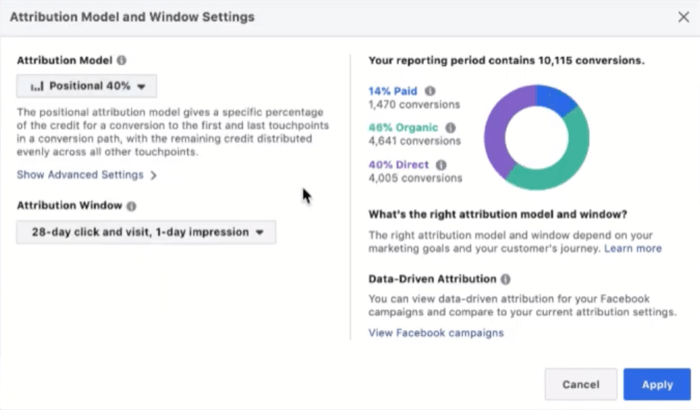
Now change over to the Positional 40% model (which gives credit to the first touch) and note the breakdown of paid, organic, and direct.
Here, the paid percentage jumps from 5% to 14%. This tells you that paid media are driving a lot of first clicks and bringing a lot of new people to your brand who are then converting.
Next, look at Top Sources for this attribution model.
Looking at the example, you can see that organic is still at the top but Facebook paid jumps up to second. Also, the difference in actual traffic to conversions isn't as dramatic as in the last-click model. Instagram paid jumps up, too.
The takeaway from this data is that Facebook paid and Instagram paid are driving a lot of new customers to your brand.
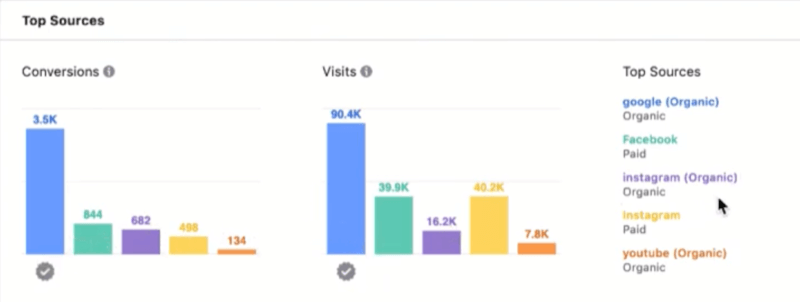
When you start giving the first touch credit, the conversions jump from to 217 to 844 for Facebook paid and 93 to 498 for Instagram paid. So instead of generating $25,000, Facebook and Instagram paid are generating $95,000 in revenue. This is important because if you thought the paid ads weren't profitable and turned them off, you'd potentially be passing up a significant amount of revenue.

It's important to look at both first- and last-touch attribution and give both of those credit to understand the real impact your paid advertising has on introducing new people to your brand, filling the top of the funnel.
If you only look at last-touch attribution, you're never going to be able to grow your brand because it will always be telling you to spend more on your remarketing or your organic just because they're the last touchpoint that people have.
Break down your traffic sources to see which ones are responsible for the top and bottom of the funnel. The Positional 40% attribution model will show your true ROI for top-of-funnel campaigns and traffic sources.
Watch this video to learn more about comparing models and revenue sources with the Facebook Attribution tool:
Google Analytics Reports
Google Analytics helps give you a general idea of how your brand is doing. It collects a lot of information about your website visitors, and if you set up Ecommerce Tracking, you'll get even more out of it.
Here are the main reasons to use Google Analytics:
- Get deeper website metrics (time on site, product data, more filtering options).
- Improve your website conversion rate (find things you need to fix).
- See eCommerce breakdowns and checkout flows.
- See referral traffic sources and their quality.
- Compare attribution models (great to cross-check your Facebook and Google stats).
After you set up Google Analytics and Ecommerce Tracking, give it some time (30 days) to collect enough data. Then start delving into the data to find valuable information about your customers.
#6: See Which Audience Segments Convert Best
Once you have Ecommerce Tracking set up, you can filter the data by different views to see your best-converting audience segments.
Start by going to Audiences > Demographics > Gender to see the conversion ratio of males to females.
The image below shows the results for an eCommerce site. You can see they're getting a much better conversion rate from females, but a lower number of females are visiting the site. So this company may want to focus on getting more traffic from women with their Facebook campaigns.

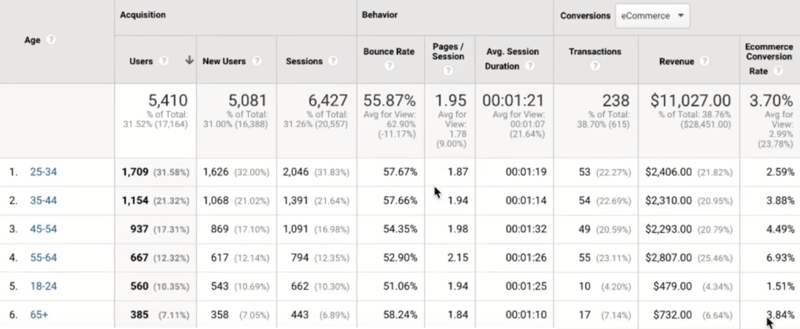
If you go to Audiences > Demographics > Age, you'll find data about the different age ranges of your traffic. This information can help you identify the age ranges you should focus on.
The data below reveals 18–24 and 25–34 are bad demographics for this eCommerce site so it may be better off focusing on the other age ranges.
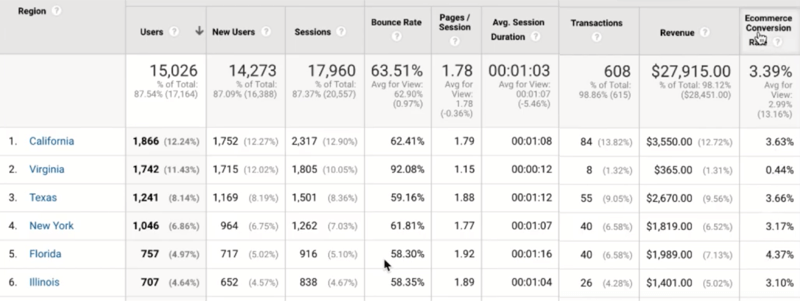
Next, go to Audiences > Geo > Location and click on United States to see which states have the highest conversion rates.
The data below shows this site is getting a lot of traffic from Virginia but Virginia converts poorly. So they might want to start excluding Virginia from their marketing campaigns.
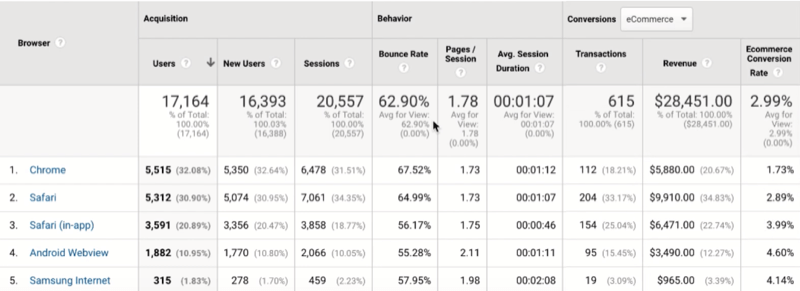
If you look under Audiences > Technology and Audiences > Mobile, you'll find data about which devices (mobile, desktop, and tablet) and browsers (Chrome, Safari, Firefox, etc.) your audience is using.
Here, you can see that Chrome gets most of the traffic but it has a lot lower conversion rate than the other browsers. So this company might want to see if there are any bugs with using the site on Chrome.
#7: Analyze Conversions by Traffic Source and Campaign
Now let's look at how to evaluate the quality of your traffic sources and campaigns so you can determine where you need to focus your efforts.
To see this data, go to Acquisition > All Traffic > Source/Medium. The traffic you see in this report is tracked with UTM tags. Anything that isn't tracked usually shows as direct/none.
Start by looking at bounce rates for different sources. Are there any pages or sources that have high bounce rates?
In the image below, facebook.com/referral (which is usually organic) has a really high bounce rate (91%), which suggests those people aren't ready to buy. Visitors are coming to the site and leaving the first page they visit.
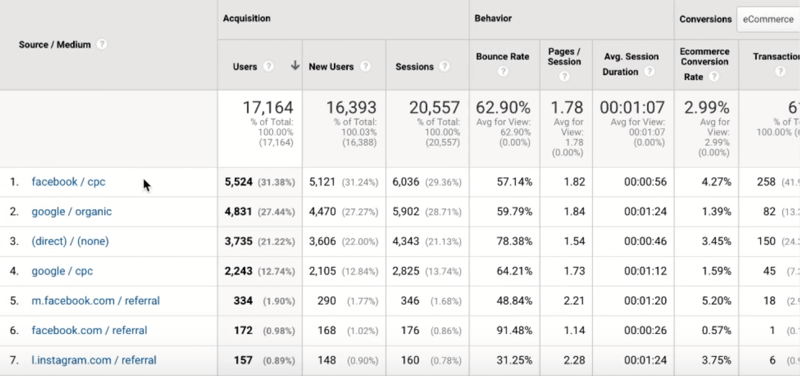
Something is causing them to leave right away. It might be a slow page load or maybe the page doesn't contain the information they were looking for. Fix the pages people bounce on to decrease the places where people are dropping out of your funnel.
Next, look at average session duration, which is the length of time people spend on your site. Typically, the quality of traffic is higher if people spend more time on the page and look at multiple pages.
In the example above, facebook/cpc has an average session duration of 56 seconds (which is below the 1:07 average for view) but a high conversion rate of 4.27% (which is higher than the 2.99% average for view). This means the traffic is either highly targeted or the audience it's targeting is high-quality.
After you go through all of your traffic sources to determine the best ones, change the Secondary Dimension to Campaign to break down the information even further.
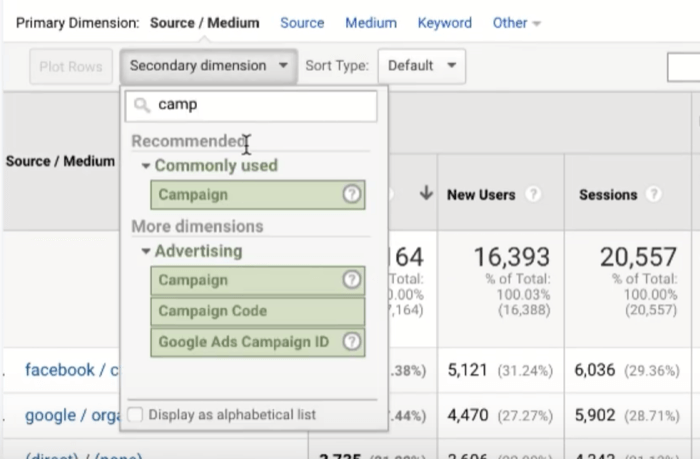
Now review each traffic source broken down by campaign. This can help you identify campaigns that are converting well (and campaigns that aren't converting well), so you know where you should be spending money.
Remember that Google Analytics goes by last-touch attribution so this data doesn't take into account first-touch attribution.
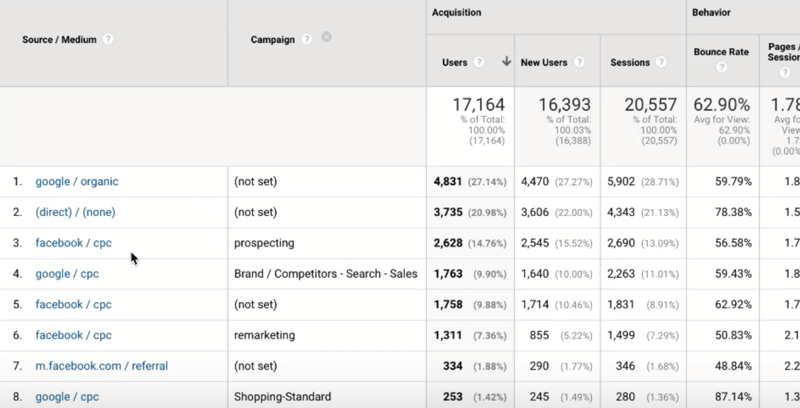
Check out this video to find out how to evaluate the quality of your traffic sources and campaigns with Google Analytics:
#8: Compare Conversion Attribution by First and Last Touch
The Google Analytics attribution comparison will help you determine which traffic channels are generating new customers.
It's important to understand attribution and how it affects the way your purchase value is assigned to different traffic sources. While contests can generate a lot of new traffic and awareness, are those new users turning into customers? You need to use a first-interaction attribution model, not last-touch interaction, to see this in Google Analytics.
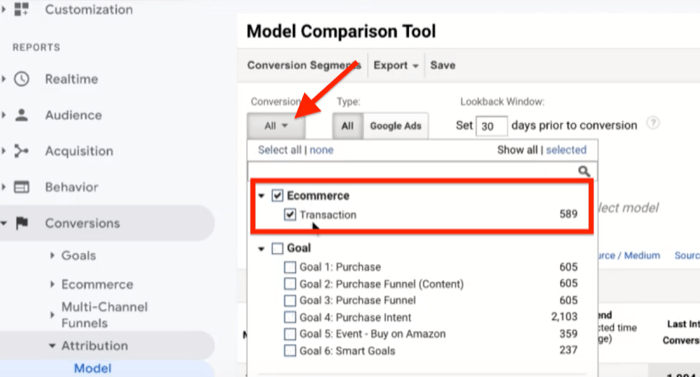
To view this data, go to Conversions > Attribution > Model Comparison Tool.
Start by making sure you're only tracking the transactions.
Google Analytics has similar attribution models to Facebook. I like to compare first interaction to last interaction. It's a good way to see what's bringing in the traffic and what's converting the traffic.
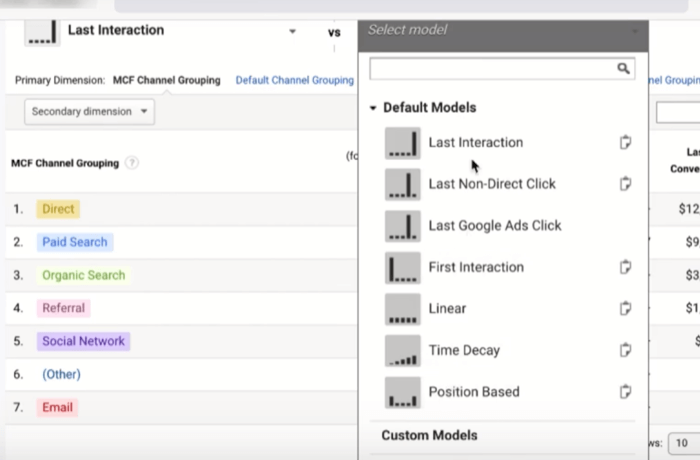
After you select your attribution models, click Source/Medium as the primary dimension.

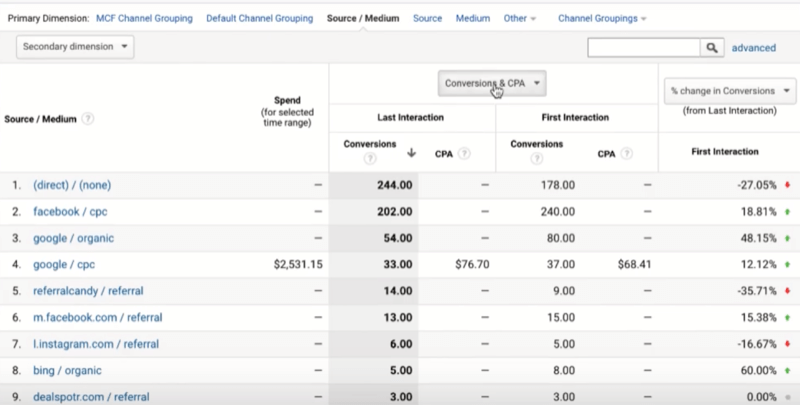
Now compare the two models for each traffic source.
In the example below, Facebook CPC is driving 202 conversions for last touch and 240 for first touch. This tells you that Facebook CPC is a source of new customers. It's driving new awareness that's converting into paying customers.
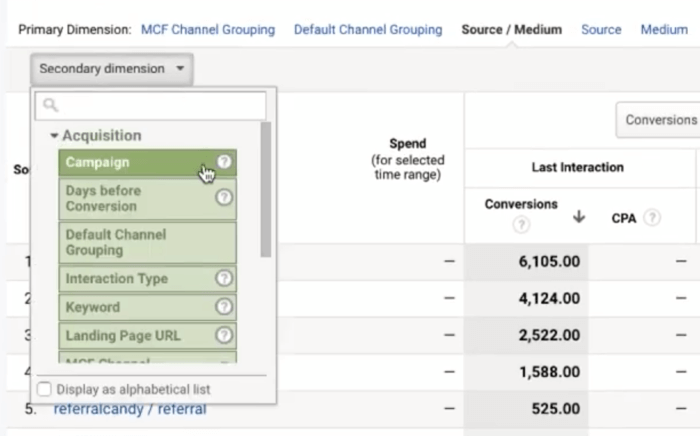
Adding Campaign as a secondary dimension can help you understand your prospecting campaigns.
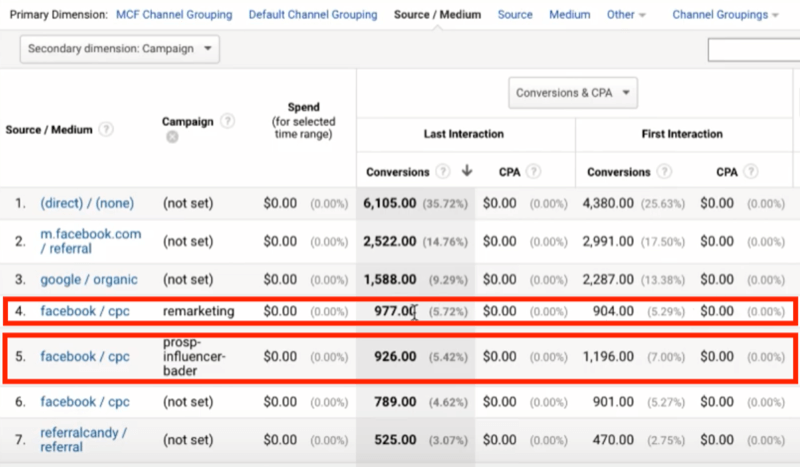
In the example below, you can see Facebook remarketing is taking a lot of the last touch, which is expected. And Facebook prospecting/influencers is generating a lot of first-touch referrals.
When you look at your data like this, you can see which channels are bringing in new customers and which channels are just converting other sources of traffic (doing the remarketing work). Last-interaction conversions didn't necessarily bring any new customers in, but they were able to convert the customers that all of your other prospecting campaigns brought in.
Conclusion
One of the most common issues businesses face is the lack of understanding or insight into their customer sales journey. Which ads, channels, and campaigns are actually responsible for the conversions, new customers, and revenue? Where should you allocate your budget to grow your business?
Most online stores are still looking only at the last-touch attribution model, which credits the last ad or traffic source the customer clicked or viewed before converting.
This article shows you how to use Facebook Analytics, Facebook Attribution, and Google Analytics to better understand your customer journey so you can run better, more profitable marketing campaigns while scaling your business.
You could spend years of your life clicking around these analytics tools but the data and reports above will help inform your marketing direction when it comes to conversions and revenue.
What do you think? Which of these Facebook and Google Analytics reports help you better understand your customer journey? Share your thoughts in the comments below.
More articles on Facebook advertising:
- Discover a five-step process to turn more Facebook leads into customers.
- Learn how to build a Facebook ad funnel that works for your business.
- Find seven ways to scale your Facebook ad campaigns.
Attention Agency Owners, Brand Marketers, and Consultants

Introducing the Marketing Agency Show–our newest podcast designed to explore the struggles of agency marketers.
Join show host and agency owner, Brooke Sellas, as she interviews agency marketers and digs deep into their biggest challenges. Explore topics like navigating rough economic times, leveraging AI, service diversification, client acquisition, and much more.
Just pull up your favorite podcast app, search for Marketing Agency Show and start listening. Or click the button below for more information.

