Want to better understand what is and isn't working with your Facebook marketing? Are you using the two most powerful analysis tools Facebook offers?
In this article, you'll learn how to set up Facebook Analytics and Facebook attribution.
How to Set Up Facebook Analytics
The Facebook Analytics platform is a free tool for tracking and analyzing how people interact with your pages, website, and apps. It's similar to Google Analytics in that it allows you to follow user behavior, create cohorts of users, and monitor funnels.
Here's how to get started using it to analyze your Facebook marketing efforts.
#1: Connect Data Sources to Facebook Analytics
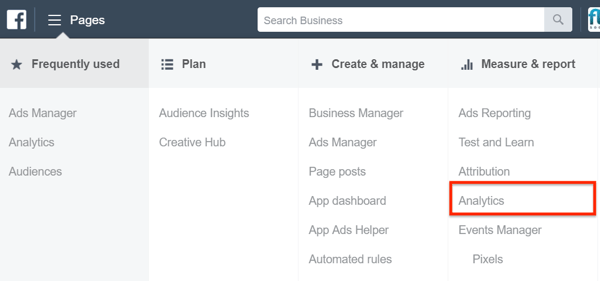
Inside the global menu in Facebook Business Manager, you'll find the Analytics platform in the Measure & Report section. Facebook also has a separate Facebook Analytics mobile app (iOS and Android) that you can download and use on the go.
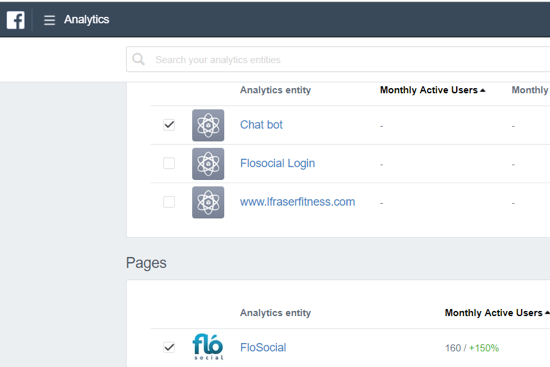
On your Analytics dashboard, you're prompted to select all of the event sources you want to analyze. An event source is an entity from which Facebook can draw data and includes apps, pages, and pixels.
Select the checkboxes for the event sources you want to track, which will create a group of sources and channels to monitor. When you're done, click Create Group on the right.
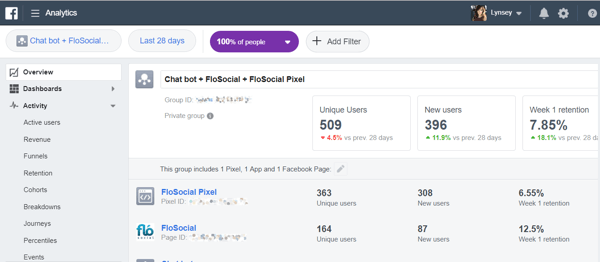
The data from these sources is now collated and displayed on the Overview tab.
#2: Create a Tracking Dashboard in Facebook Analytics
Creating a custom dashboard allows you to filter your data quickly so you can focus on the most important information to track.
Pro Tip: Before setting up a dashboard or funnel, it's helpful to map out the information and data that are useful to you. Facebook Analytics lets you filter, refine, and track the data it collects from its event sources and channels, but identifying what's most useful to your business will help you avoid data overload.
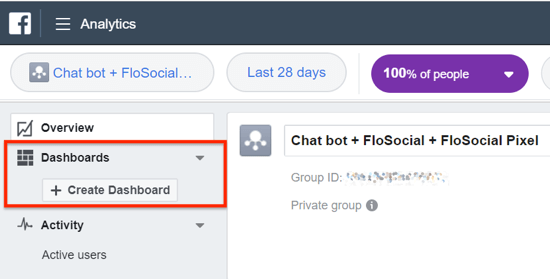
In the left navigation, click the Dashboards tab and then the Create Dashboard button.
3 Days of World-Class Training—Zero Travel!

Couldn't make it to Social Media Marketing World and AI Business World this year? Get all of the great content at a fraction of the price with a Virtual ticket.
That’s full access to recordings of every keynote, workshop, and session—the ones people travel thousands of miles to see. Don't wait. Get your Virtual ticket and enjoy actionable content that you can watch anytime, anywhere.
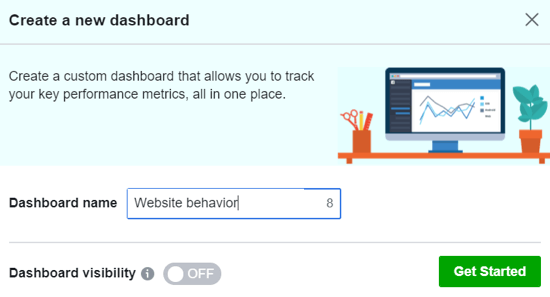
In the pop-up box, enter a name for your dashboard. If you want other people on your team to be able to view this dashboard, turn on Dashboard Visibility. Then click Get Started.
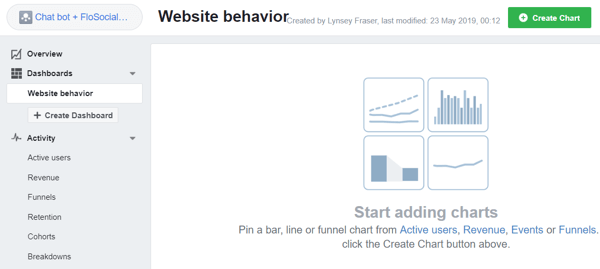
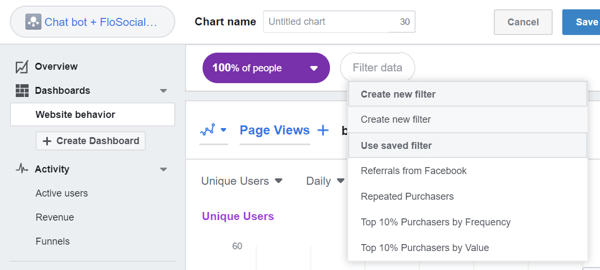
The next step is to add the information you want to track on your dashboard and create charts and add filters that are relevant for your business.
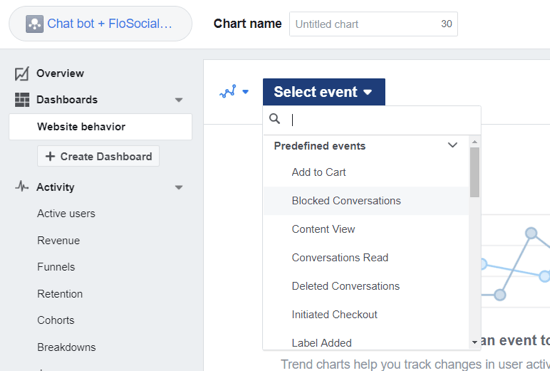
Click Events and select the type of event you want to track. It can be a standard website event such as leads or purchases, or how many interactions your customers have had with your app or chatbot.
Next, you can add filters to exclude or include certain conditions such as all website visitors referred from Facebook or people who have already purchased from you.
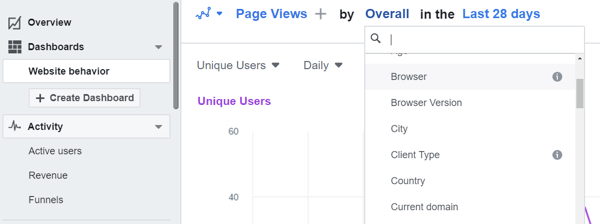
Then select any additional time or source filters. For example, if you ran an ad to drive people to your website in the last 28 days, you might add a filter to exclude the people who visited the site from their mobile browser.
When you're done selecting and refining the information you want to display, click Save and Add to Dashboard. Repeat this process until you've added and filtered all of the information you want to display on your own custom dashboard.
Note that you can create multiple dashboards to track different sources or time periods separately.
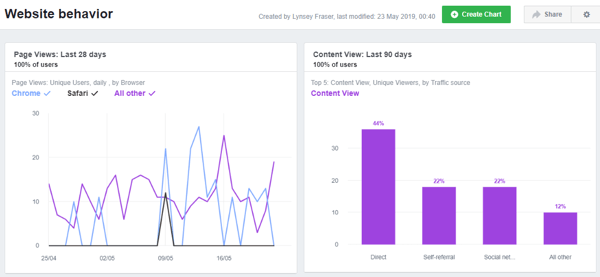
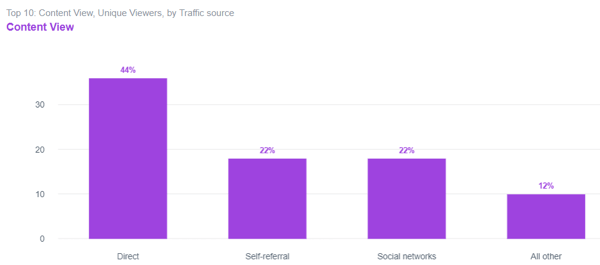
Data Visualization Charts in Facebook Analytics
Facebook Analytics lets you select from different types of charts to interpret your data. When creating a chart, choose a chart type from the drop-down menu.
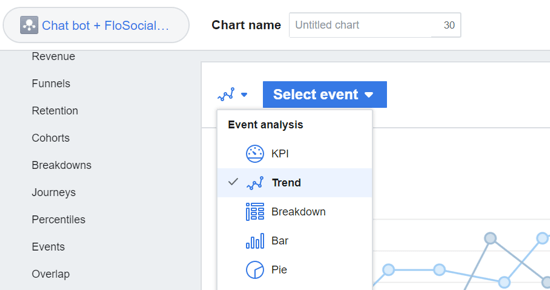
Here's an example of a Facebook bar chart:
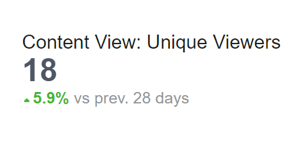
This is what a KPI chart looks like:
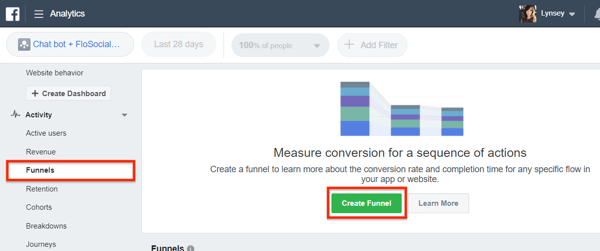
#3: Create a Funnel in Facebook Analytics to Track User Behavior
In Facebook Analytics, funnels help you define a series of chronological events to track behavior flow. To create a funnel, click Activity > Funnels in the left navigation. Then click Create Funnel on the right.
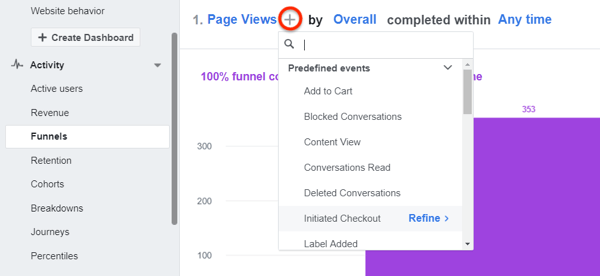
Now add the first step of the funnel you want to track by choosing it from the drop-down menu.
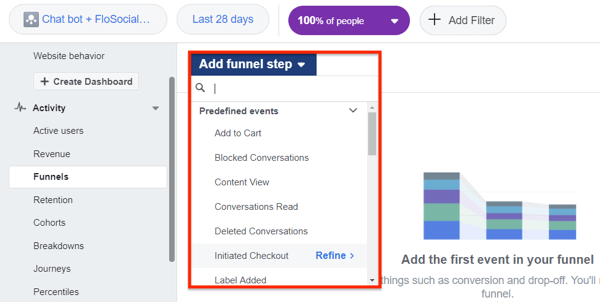
Then click the plus sign to the right of the first selected event and choose the next part of the funnel. Repeat this step as many times as necessary to track all of the events in your funnel.
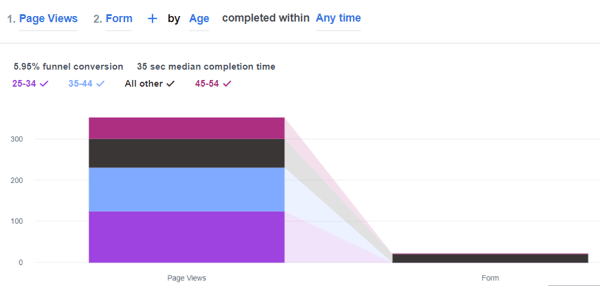
You can find more information about the people moving through your funnel by choosing a breakdown. To do this, click Overall and choose a parameter from the drop-down menu (such as Age, Browser, or Gender).
The funnel below was created to show how many people went from viewing the website pages to completing a form, and this information is broken down by user age.
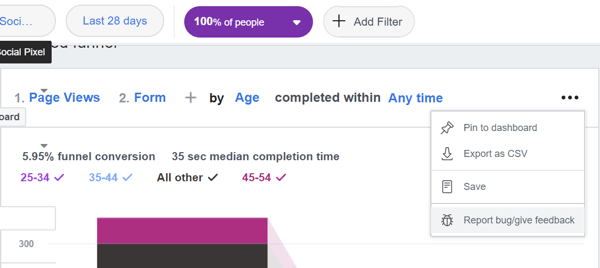
When you're happy with your funnel steps, click the three dots icon on the right and choose Save. Then name your funnel and click Save. At this stage, you can also add your funnel to your custom dashboard.
#4: Create a Cohort to Identify Trends in Customer Behavior
A cohort is a group of people who perform the same action. Cohorts allow you to see repeat purchases, how people interact or are retained by your site, and how often they revisit.
For example, the people who made a purchase from you could be one cohort and the people who visited your events page could be another cohort. By tracking the behavior of your cohorts, you can understand them better and use these insights to improve your ads and ad sequences.
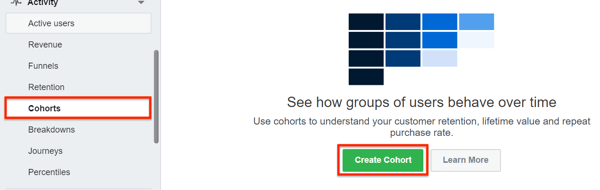
To set up a cohort, click Activity > Cohorts and then click Create Cohort.
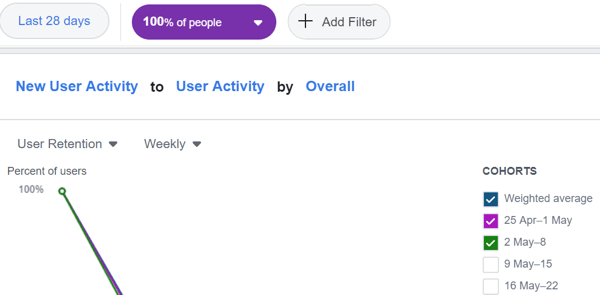
Now add your filters and refine the data you want to see. Your cohort data will show audience retention from week to week. For instance, you could see if your cohort of website visitors from one week returned to your website the following week, and how many of them returned the week after to make a purchase.
#5: Create a Journey to Map Customers' Journeys
To see where your customers start and finish, map their journey in Facebook Analytics. (This is similar to behavior flow in Google Analytics.) To set up journeys, navigate to Activity > Journeys. From the two drop-down menus on the right, select the conversion event and time period you want to track.
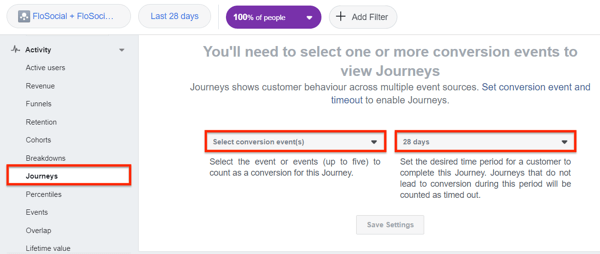
Once you've selected the conversion event and timeframe, you can start populating information about what happens during that customer journey—where they start and end, what percentage convert, and what percentage drop off or “time out” during that period.
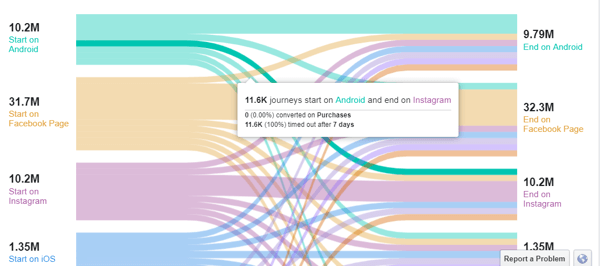
Journeys are useful for tracking activity that runs across multiple channels or finding your most successful conversion channel over a specific time period.
Want to Unlock AI Marketing Breakthroughs?
If you’re like most of us, you are trying to figure out how to use AI in your marketing. Here's the solution: The AI Business Society—from your friends at Social Media Examiner.The AI Business Society is the place to discover how to apply AI in your work. When you join, you'll boost your productivity, unlock your creativity, and make connections with other marketers on a similar journey.
I'M READY TO BECOME AN AI-POWERED MARKETER#6: Share Access to Your Facebook Analytics Assets
To share your analytics dashboard and funnels with your team, you need to assign access to the event source group in Business Manager. Navigate to Business Settings and open the Data Sources tab. Then use the Add People function to assign access to your team.
How to Set Up Facebook Attribution
Facebook's Attribution tool allows you to measure the effectiveness of your marketing campaigns directly against a conversion event like a purchase or add-to-cart event. You can see which campaigns and posts affected the customer's journey to purchase.
This tool examines all of the touchpoints that may have influenced your customer online and offline to help them get to their buying decision. If the last click before a purchase didn't come from your conversion ad, it doesn't mean your ads, posts, and marketing activities didn't influence that customer to purchase.
Tracking the last click or using cookies alone doesn't give an accurate understanding of attribution in the multi-device world we live in. With the Attribution tool, you'll get a better understanding of what's working in your Facebook marketing and what's not.
#1: Set Up a Line of Business
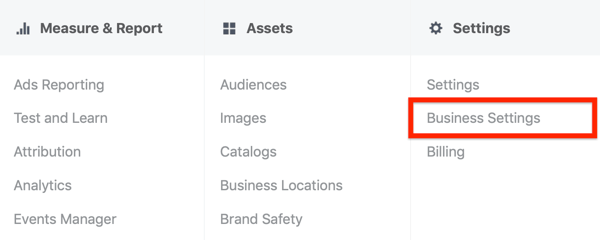
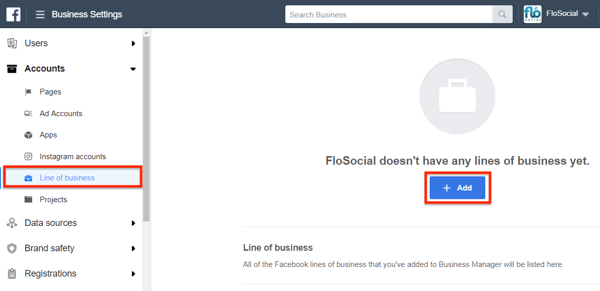
To start using the Attribution tool, you first need to set up a line of business in Business Manager. In Business Settings, select Line of Business under the Accounts tab and then click Add.
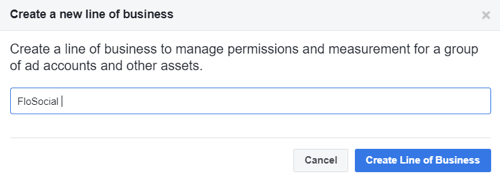
Next, enter a name for the line of business and click Create Line of Business.
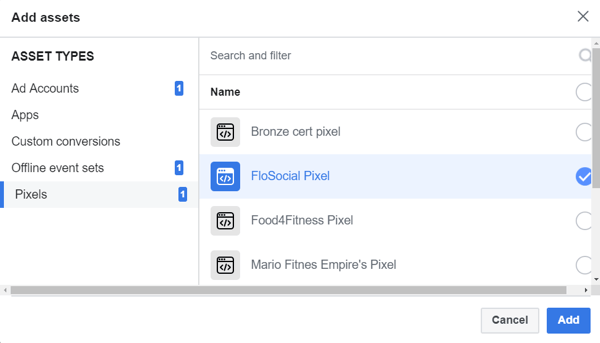
Once you've created a line of business, add the asset you want to track to it and assign permission to other team members to access the data.
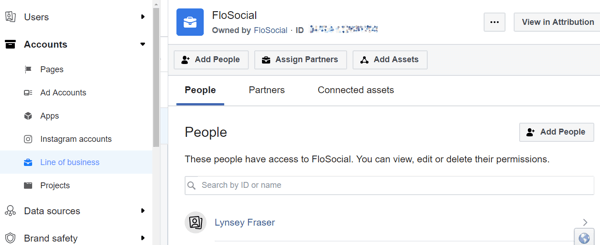
Next, add the pixels, ad account, apps, and offline events you want to track in your attribution model.
Once you've selected all of your assets, click the View in Attribution button at the top right or select the Attribution option in the Measure & Report section of the Business Manager menu.
When you first create your line of business, you're prompted to choose a time zone and a currency to report in. Once you make these selections, click Activate My Line of Business. It takes up to an hour to collect and display your data in the Attribution model.
#2: Choose a Facebook Attribution Model
You can filter the data collected in the Attribution tool under different types of attribution models. This assigns the results based on how you interpret the information about the customer's journey to purchase.
For example, suppose a customer sees an ad for a pair of shoes on Instagram, looks at the company's website but doesn't purchase that day, sees another ad for the shoes in their news feed, and finally visits the retailer's Facebook page where they purchase the shoes using the Facebook page Shop function. How you attribute the impact of each touchpoint will make a difference in how you view the success of the ad campaign.
If you just judged it as a conversion that came from the Facebook shop on the retailer's page, you'd be ignoring the fact that the consumer saw the ad first on Instagram and visited the website before making the purchase. You could argue at this point that the Instagram ad didn't work but was an important trigger in getting this customer to buy the shoes.
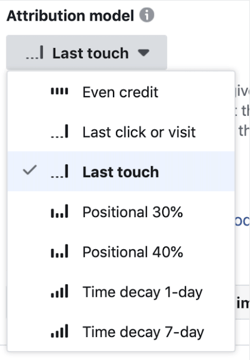
Here's how different Facebook attribution models would assign credit for the customer's shoe purchase:
- Last touch attribution: This attribution model credits the last place that the customer clicked as the reason they made their purchase—the Facebook shop, in this case.
- Even touch attribution: This attribution model credits each touchpoint equally, so the Instagram ad, website, Facebook ad, and Facebook page were all equally important in leading to the shoe purchase.
- Time-based attribution: This model allows some recognition of when a customer interacted with different ads, making the most recent touchpoints the most important and giving less importance to older touchpoints.
The Facebook attribution tool lets you decide how to rate the effectiveness of your total marketing efforts and understand more about the customer's journey to convert. You can select the attribution model that's right for you and use it to analyze your marketing.
Once your data has loaded in the Attribution tool, you'll see an overview on the Performance tab each time you log in.
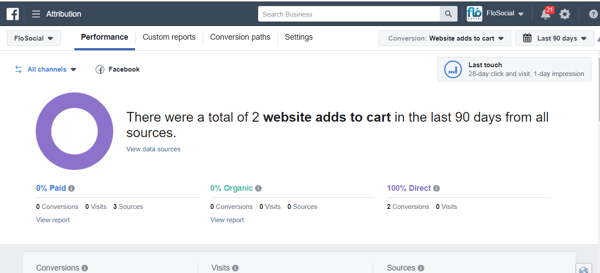
#3: View and Filter Facebook Attribution Performance Reports
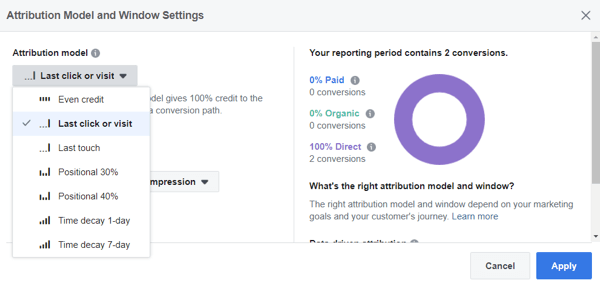
When looking at the overview on the Performance tab, you can choose which attribution model you want to use for the report. So you could weigh all of the customer touchpoints evenly or assign the credit for the conversion to the last touchpoint or last ad clicked.
At the top right, tap on the gray box labeled Last Touch to open the Attribution Model and Window Settings window.
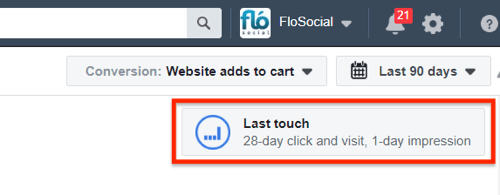
Here you can select which attribution model to use and decide how long the reporting window will be. For instance, you could specify that the customer has seen an ad or interacted with a post in the last 7 days and then converted, or track interactions for up to 28 days after clicking on your ad. When you're done, click Apply.
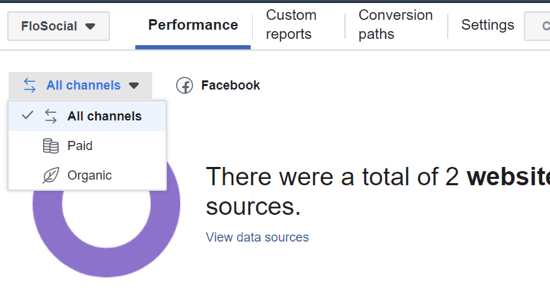
In the top-left corner of the Performance window, you can separate your paid and organic activities if you want.
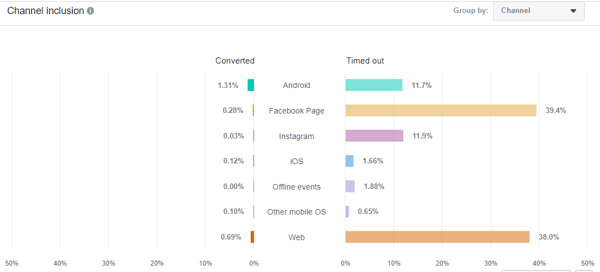
The Custom Reports tab lets you filter your data by channel to see exactly where your conversions are coming from.
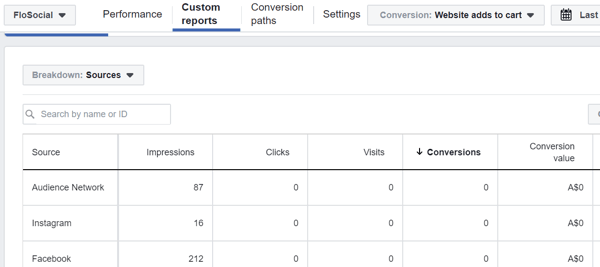
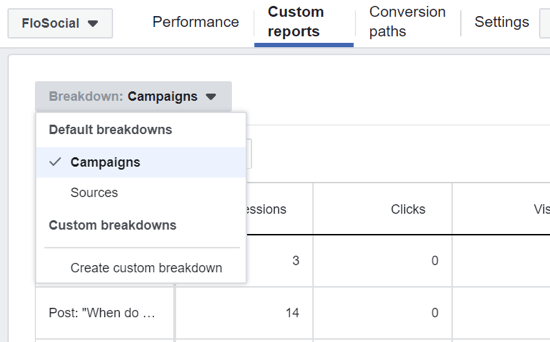
You can also choose whether to look at the source of the event data—where the conversions are being reported from—or your campaigns.
Under the Settings tab, Data Sources and Referring Domains show all of the places you're collecting information from and considering when assigning attribution.
If you want to add other ad platforms to the attribution report for even more accurate data about your conversion path, click Ad Platforms and then click the Add a Platform tab.
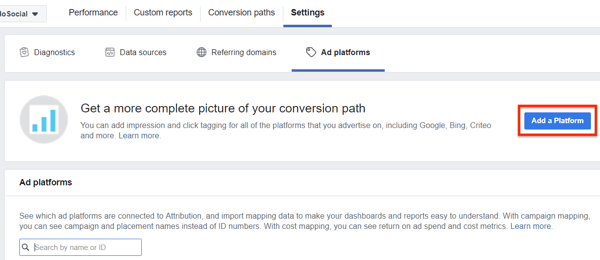
Facebook attribution works with a number of other platforms and data providers that you can add to your attribution report, including Google Ads.
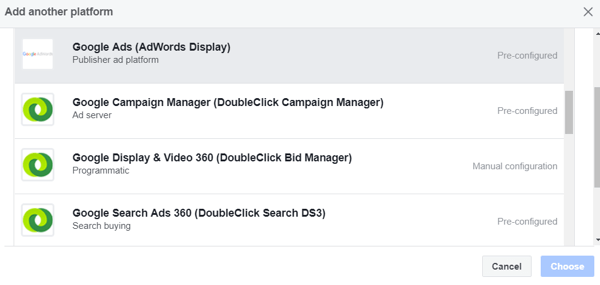
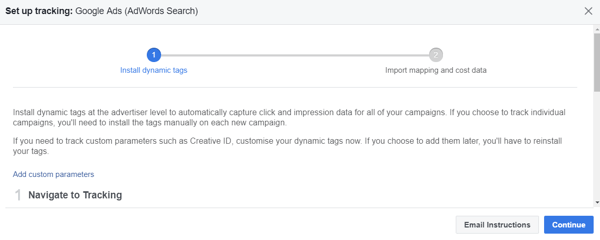
When adding a platform, you're prompted to install tracking tags and configure the platform so Facebook can add this data to its reporting. The instructions for setting up tracking are similar to setting up your Facebook pixel.
Conclusion
Facebook Analytics and the Facebook Attribution tool both offer valuable data for marketers, particularly for calculating the ROI of campaigns, ads, and channels.
Facebook Analytics is similar to Google Analytics, showing user behavior across your ads, website, and pages. The Attribution tool reveals the specific ads or steps taken by customers who convert, helping you gauge the effectiveness of your campaigns.
Make sure you plan what you need to track and set up your platforms accordingly. Don't drown in the data; use it to get a better understanding of your current campaigns and then let it guide you to make better data-driven decisions in the future.
What do you think? Will you set up a custom dashboard in Facebook Analytics? Have you used the Facebook Attribution tool? How have you used what you've learned to improve your campaigns? Share your thoughts in the comments below.
More articles on Facebook Analytics and attribution:
- Learn how to use Facebook Analytics to improve the performance of your funnels and ads.
- Find out how to set up event tracking and use event source groups in Facebook Analytics to analyze customer behaviors.
- Discover how to use the Facebook Attribution tool to better understand your customer's journey across devices and channels.

Curious About How to Use AI?
Our newest show, AI Explored, might be just what you're looking for. It's for marketers, creators, and entrepreneurs who want to understand how to use AI in their business.
It's hosted by Michael Stelzner and explores this exciting new frontier in easy-to-understand terms.
Pull up your favorite podcast app and search for AI Explored. Or click the button below for more information.
