 Want to improve your Facebook ad performance?
Wondering which metrics to look at?
Using key insights from Facebook to see how users respond to and engage with your ads can help you optimize your campaigns.
In this article, you'll discover six ways Facebook ad metrics can help you improve your Facebook ads.
Export Your Facebook Ads Data to Excel
To effectively analyze your Facebook ad campaigns, you need your data to be presented in a clear, detailed way. One of the best ways to do this is with charts.
Unfortunately, Facebook's reporting interface does not include good charts, but you can easily create charts by exporting the information to Excel. Here's how to get started:
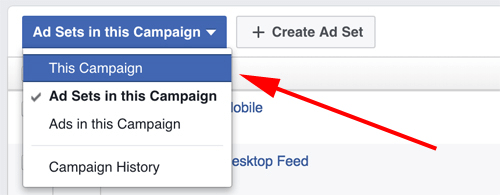
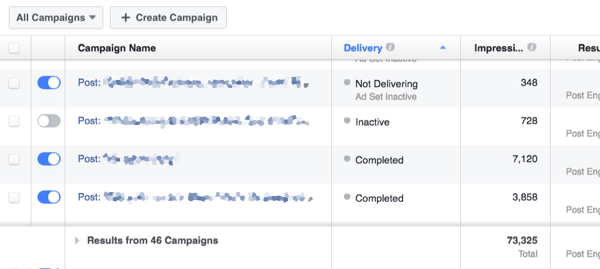
Go to your Ads Manager reports and click on the campaign you want to analyze. Above the list of ad sets on the left, click on the Ad Sets in This Campaign button and select This Campaign.
If your report doesn't include the required metrics, you can add them. Click on Performance and then Customize Columns.
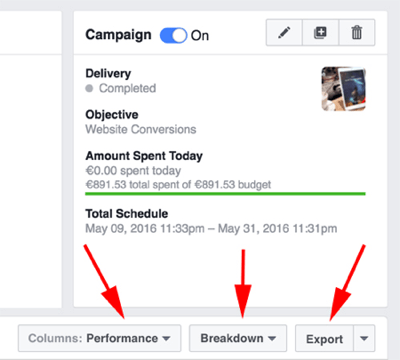
Next, click on Breakdown and select By Time and then Day so you can see the results for each day.
Finally, click the Export button on the right to export this report to Excel. Once you've dumped all of that information into Excel, you can easily create trend charts that will help you better understand your campaign performance and results.
Here's a list of the most important metrics to look at and how to use them to understand and audit your Facebook ad campaigns.
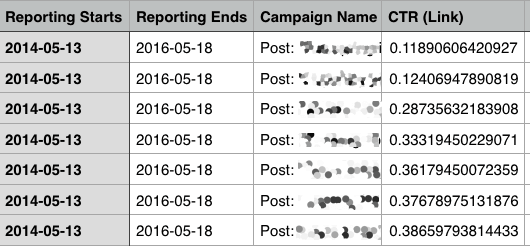
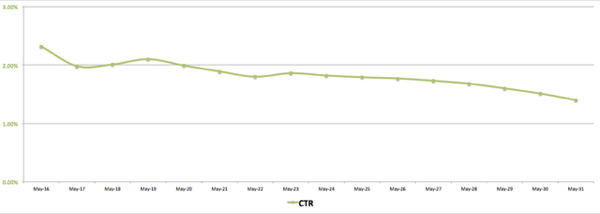
#1: Track CTR to Measure Ad Appeal
Click-through rate (CTR) is one of the most popular metrics used by online advertisers. It represents the ratio between the number of impressions and the number of clicks received.
Which AI Moves Actually Matter?
That's what every marketer is wrestling with now. New AI strategies, new tools, new takes every week — but no clarity. Most marketers and business owners are trying to figure out AI alone.The AI Business Society is your trusted guide. Get expert-led training you can put to work immediately. Plus a community of marketers sharing what's actually working.
I'M READY FOR REAL AI RESULTSBecause getting conversions typically requires users to click on an ad first, CTR has become a key metric for many advertisers. They get excited about a high CTR, get concerned when it's too low, and often seek information about what the standard CTR is for their industry or market.
In reality, CTR is just a sign of how interested users are in your ad. No more.
Yes, if your targeting is correct and your product is good, a high CTR will send more traffic, which in turn may produce more conversions. However, campaigns with a low CTR can still manage to get a good ROI, and campaigns with huge CTRs may produce no revenue at all.
There are typically two reasons for a low CTR:
- Bad ad: If the targeting is correct, but your ad is bad (for example, it has a bad image, the ad copy isn't engaging, there's no call to action, etc.), users will not pay attention to your ad.
- Bad targeting: You might have a good ad that's served to the wrong audience. In this case, the CTR will probably be low.
If your campaign has a low CTR, it's time to analyze these two elements.
Also, CTR can decrease over time as frequency increases. If users start to see your ad multiple times, they probably won't keep clicking on it if they did so already.
CTR is typically not a key performance metric unless your main goal is to drive traffic. However, it is a good metric for understanding how interested users are in your ad.
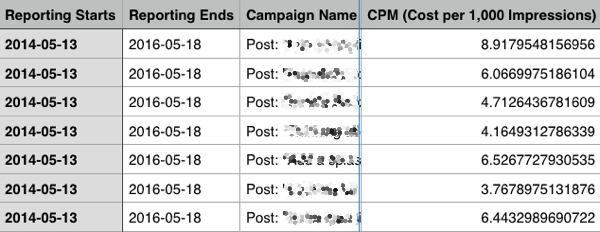
#2: Look at CPM to Understand Your Overall Costs
Do you ever feel frustrated or lost because your campaigns aren't performing as expected? Perhaps you're not getting many impressions or your conversions are more expensive than expected. When this happens, we tend to blame the ad or the targeting, and try new images, ad copy, and targeting options.
However, the problem could be external. If you're paying for impressions (which is the case in most campaigns), looking at your CPM (cost per 1,000 impressions) is the best way to find out.
When paying for impressions, CPM is defined by two main factors:
- How easy it is to reach a user in your target audience. Typically, the more specific the targeting, the higher the CPM.
- The number of competing campaigns trying to reach the same target audience as you.
Even if most advertisers know this in theory, they often forget to look at CPM when analyzing campaign results. When CPM increases, your overall results will become more expensive, regardless of how interesting your ad is or how many conversions you get.
But the effectiveness of your budget may also be affected by CPM. Assuming a constant budget over a period of time, an increase in CPM will mean fewer impressions, as you can see in the chart below. (Note how the charts for CPM and impressions are symmetrical.)
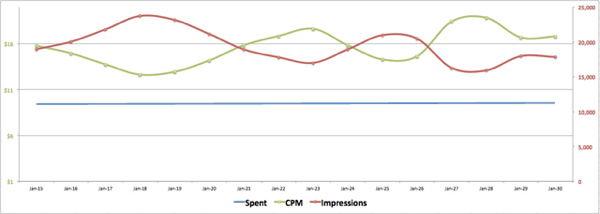
Fewer impressions mean fewer chances to convert. And the higher costs mean that each conversion will also be more expensive.
So when results are not as expected, look at your CPM before considering new ads or targeting options.
#3: Measure CPC to Gauge Ad Quality
Wouldn't it be great to have a metric that represents both the interest of users in an ad (CTR) and overall campaign costs (CPM)? Cost per click (CPC) serves this purpose.
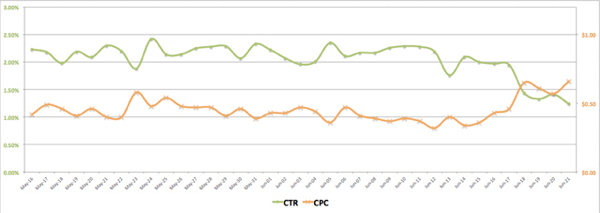
In fact, when paying for impressions (again, the case most of the time), CTR and CPC go hand in hand. You can see this relationship in the following chart. Note how the lines are almost symmetrical.
3 Days of World-Class Training—Zero Travel!

Couldn't make it to Social Media Marketing World and AI Business World this year? Get all of the great content at a fraction of the price with a Virtual ticket.
That’s full access to recordings of every keynote, workshop, and session—the ones people travel thousands of miles to see. Don't wait. Get your Virtual ticket and enjoy actionable content that you can watch anytime, anywhere.
For example, suppose you have a budget of $20 with a CPM of $10. This means you'll get 2,000 impressions. If you got 200 clicks on those, the CTR was 10% (2,000 x 10% = 200). This means your CPC was $0.10 ($20 / 200 = $0.10).
Now, if in the same scenario you got 400 clicks, your CTR was 20% (2,000 x 20% = 400). And in this case, $20 / 400 = $0.05.
As you can see, as CTR increases, CPC decreases, and vice versa.
However, as you saw before, when CPM increases, your overall costs increase too, including CPC. This means that even if CTR and CPC are still linked, their behavior may not be exactly symmetrical all of the time. You can see this in the following image. Note how CTR and CPC are still connected, but CPM can significantly affect the value of CPC.
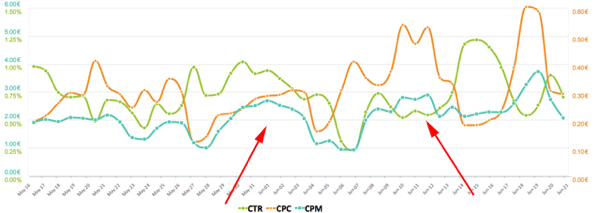
Suppose that in the second scenario above the CTR was still 20%, but the CPM increased from $10 to $20. In that case, you'd get 1,000 impressions only, and even if the CTR remained at 10%, that would provide 100 clicks. In this case, the CPC would be $20 / 100 = $0.20.
This is the beauty of CPC. Not only does it complement the information of CTR to make you understand the interest in your ad, but it also provides information about the overall costs.
#4: Monitor Impressions to Assess Data Reliability
Not many users consider impressions a main metric. After all, the number of impressions just represents how many times Facebook has displayed your ad, regardless of whether people paid attention to it.
In fact, this metric is generally used only in branding campaigns. People think that the more impressions their ads receive, the higher the chances of getting their brand out there and getting users interested in their ads. Remember: the only metric that represents user interest in your ad (not necessarily in your product, as you'll see in a moment) is CTR.
However, the number of impressions is a good metric to use when optimizing campaigns. Optimizing campaigns requires A/B testing, which means creating many versions of your ad, and even creating multiple ad sets. The goal is to improve your campaign results by pausing underperforming elements, and putting your budget into the elements that are performing best.
To do this, you need reliable information. If your results look very good (or very bad), but your ad has received only a few hundred impressions, how can you trust that information? In fact, results could change completely with future impressions.
As with any marketing research activity, you need a good sample size to trust the information received. This is where impressions become an important metric. Usually, you want to have at least 1,000 impressions to start trusting your data, although if you could get 5,000 to 10,000 impressions, that data would be much more reliable.
#5: Compare CTR With Conversion Rates to Evaluate Your Offer
Having a high CTR, but not getting enough conversions is a frustrating feeling. If users are interested in the ad, why aren't they converting?
The good news is, in the same way that CTR represents users' interest in your ad, the conversion rate represents users' interest in what you're offering after they've clicked on your ad. It's the ratio between the number of clicks on an ad and the number of conversions generated.
However, even if it depends on the number of clicks, it's not directly dependent on the CTR. In fact, when the CTR is high (that is, when users are interested in the ad), the conversion rate is a good way to understand what happens beyond the ad; that is, on your landing page or website.
A high CTR and low conversion rate are usually a sign that users don't like something they see on the destination page. Some of the most common reasons for this are:
- Bad landing page
- Expensive product
- Deceiving ad
- Missing information in the ad
- Bad buying conditions
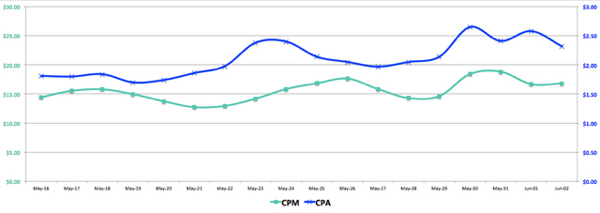
The conversion rate goes hand in hand with CPA. So when the conversion rate increases, CPA decreases, and vice versa. However, this relationship is always affected by CPM. You can see this behavior in the following chart.
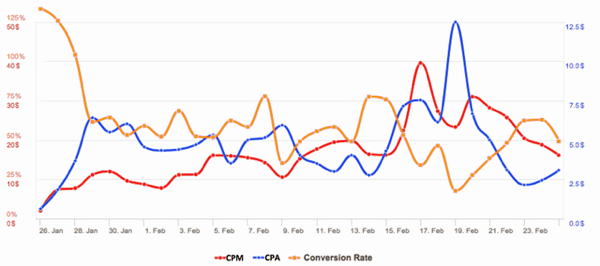
Note how the lines for CPA and conversion rate are almost symmetrical, but are still affected by fluctuations in CPM.
#6: Combine Conversions and CPA to Measure ROI
Typically conversions are used as a main metric to track campaign success. Is a high number of conversions always good news? Not necessarily. If you spend more money to get those conversions than the actual value they return, your campaign will not be profitable.
That's why you should always consider conversions along with cost per conversion (CPA, or cost per acquisition).
A low CPA is always good news, and one of the best ways to optimize a campaign is to focus on the ads and elements producing low CPAs. At the same time, a low CPA by itself is not enough, and requires a high number of conversions to make a campaign successful. In fact, a low CPA with low conversions is a sign of a very slow campaign delivery, where Facebook is using small budgets.
CPA and conversions are two metrics that always work in tandem. So don't get too excited if only one of them is showing good numbers.
Conclusion
Running Facebook ads is one of the best ways to promote your business online. The social network is not only number one in total users, which means you could potentially reach more people with your ad, but it's also versatile in terms of advertising tools and options.
However, having such a broad range of options can make your campaigns confusing to analyze if you don't know where to look or what each metric really means. Knowing the meaning of your metrics allows you to optimize your campaigns in more than one way. For example, you can reduce your CPA by improving your ad and landing page, but also by finding audiences with a lower CPM, and so on.
What do you think? Which metrics do you normally use to measure your campaign performance? What actions do you take when your campaign costs are too high? Which ad elements do you normally A/B test to optimize your campaigns? Please share your thoughts in the comments below.
Conversion graph photo from Shutterstock.

Curious About How to Use AI?
Our newest show, AI Explored, might be just what you're looking for. It's for marketers, creators, and entrepreneurs who want to understand how to use AI in their business.
It's hosted by Michael Stelzner and explores this exciting new frontier in easy-to-understand terms.
Pull up your favorite podcast app and search for AI Explored. Or click the button below for more information.
