Tired of struggling with Google Analytics to find the data you need? Wish there was an easy way to customize your reports?
In this article, you'll find a step-by-step tutorial to build and save valuable Google Analytics custom reports. You'll also learn how to find out where you're losing valuable traffic via 404 pages and get a tip for reclaiming that traffic.
To learn how to create custom reports in Google Analytics, read the article below for an easy-to-follow walkthrough or watch this video:
Note: This article assumes you know how to properly set up a goal in Google Analytics. Read this article for step-by-step instructions.
#1: Open the Source/Medium Report
When you're in Google Analytics, one of the top things people complain about is how frustrating and overwhelming it can be. But with a few simple tweaks, you can customize reports and get the answers you're looking for very quickly.
We're going to start with the source/medium report. To open it, go to Acquisitions > All Traffic > Source/Medium.
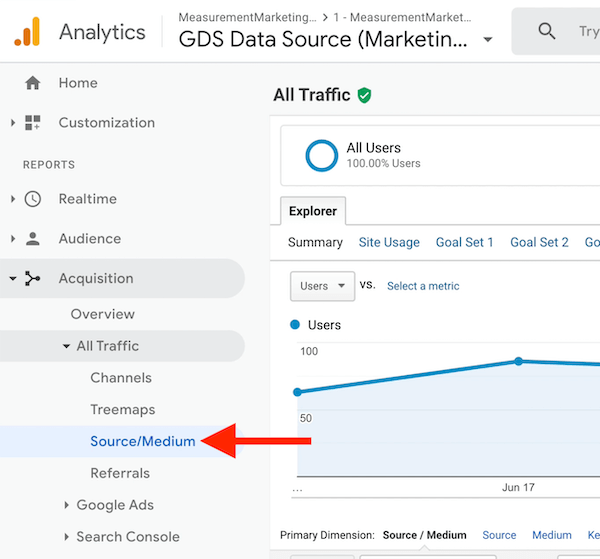
You may not see all of these traffic sources in your own Google Analytics because I use UTMs (urchin tracking modules) to make sure that information is there. If you need help using UTMs, read this article.
Once you have UTM parameters set up, the source/medium report will build itself. While this data is informative, it's also very general.
When you look at the source/medium report, you'll be able to see different traffic sources coming in and a lot of different results from those traffic sources, but what if you want to know which ones are actually creating leads? Here's how to customize the source/medium report to get the answers to your questions.
#2: Select a Goal to Identify Lead Generating Traffic Sources
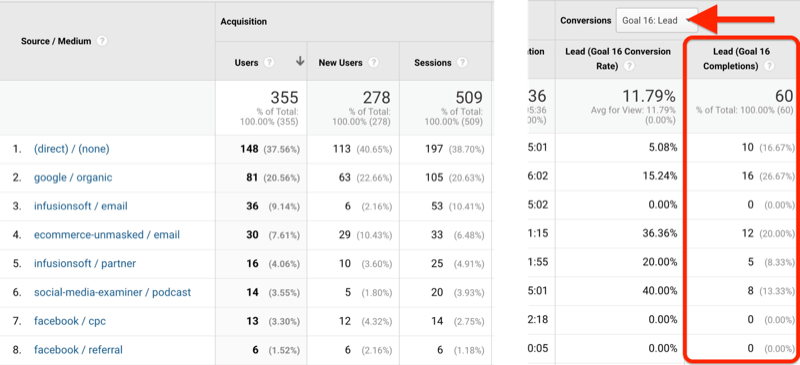
If you have a Google Analytics goal set up for leads, you can select that goal from the Conversions menu to see data about your leads.
Get World-Class Marketing Training — All Year Long!
Are you facing doubt, uncertainty, or overwhelm? The Social Media Marketing Society can help.
Each month, you’ll receive training from trusted marketing experts, covering everything from AI to organic social marketing. When you join, you’ll also get immediate access to:
- A library of 100+ marketing trainings
- A community of like-minded marketers
- Monthly online community meetups
- Relevant news and trends updates
For example, when I selected my Lead goal below, the report shows me which traffic sources are sending in leads and the number of leads I'm getting from those traffic sources.
If you haven't set up goals in Google Analytics, it's surprisingly simple to do. This video walks you through it step by step.
#3: Add a Secondary Dimension to Reveal Lead Generating Campaigns
What if you want to know the traffic sources for specific campaigns?
For example, I have a campaign called Win for my company's courses and we get traffic that starts with someone becoming a lead. To see the data for a particular campaign like this, you create a secondary dimension in Google Analytics.
To do this, click the Secondary Dimension button and search for “campaign” because you want to see your campaigns in addition to your sources and mediums.
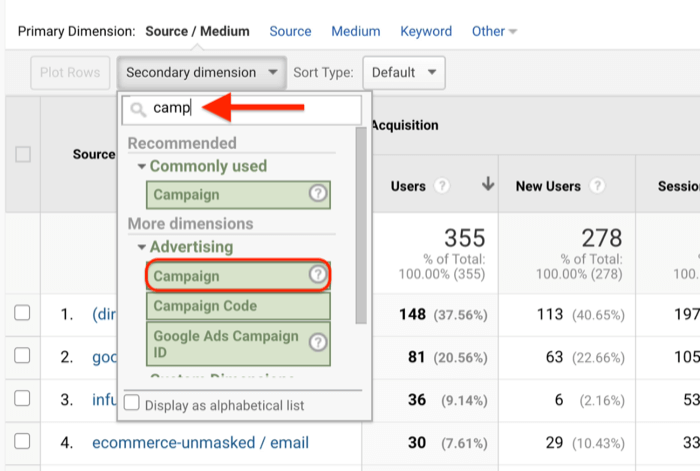
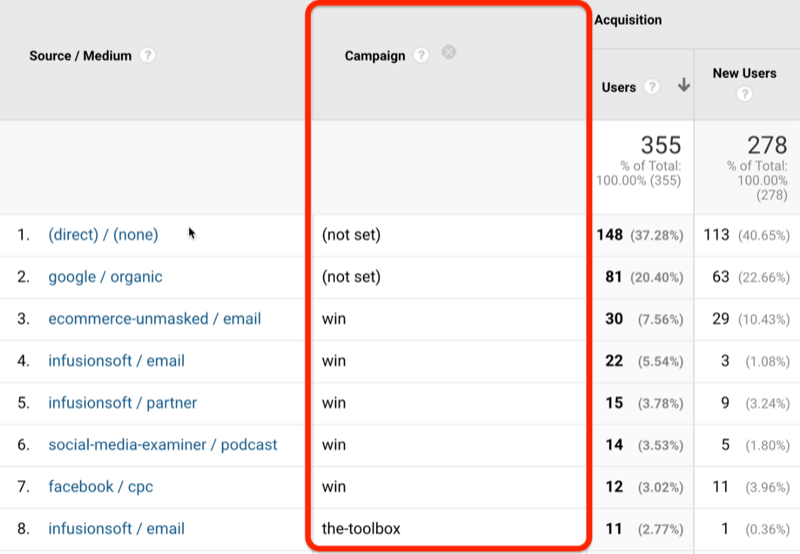
Once you select Campaign, you'll see a Campaign column along with the Source/Medium column in your report. Google Analytics calls these dimensions. Source/Medium is the primary dimension and Campaign is the secondary dimension.
If you look in the Campaign column below, you can now see the Win campaign along with some other campaigns.
#4: Add a Filter to View the Lead Generating Traffic From a Single Campaign
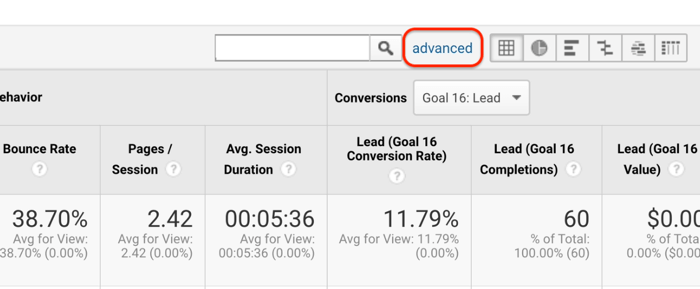
So how do you filter the data to show just the campaign you're interested in? Start by clicking on Advanced.
Next, you're going to have Google Analytics filter the data to show only your traffic for this specific campaign. From the first drop-down menu shown below, select Include, and in the second menu, select Campaign. In the text box to the right of the Containing menu, type in the campaign name. In this case, we'll enter “win,” because that's how the UTM traffic is coming in.
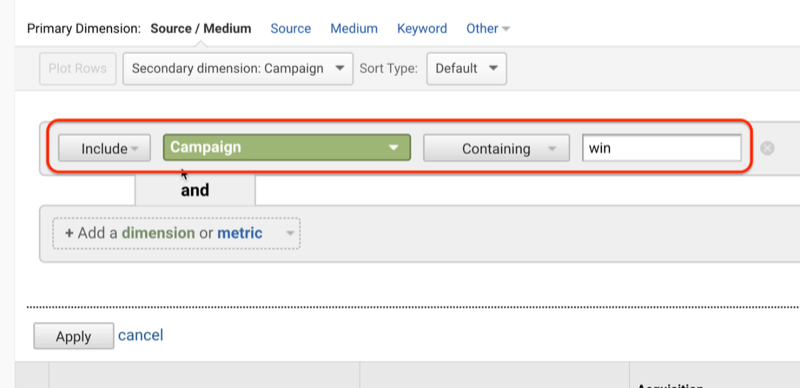
After you click on Apply, your report will show you all of the source/medium data for your campaign.
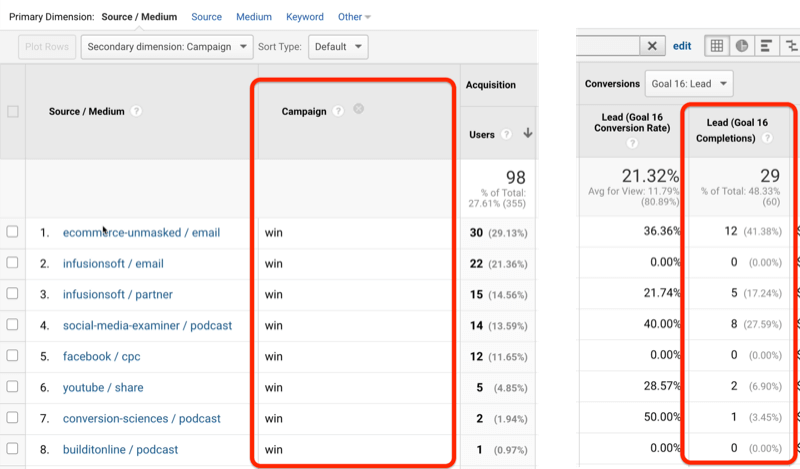
In the image below, you can easily see the number of leads and which traffic sources are effective at bringing in leads for the Win campaign.
#5: Save and Analyze Your Custom Report in Google Analytics
Now you can see the benefit of creating a customized source/medium report in Google Analytics but you probably don't want to go through all of these steps over and over again to get that information. The good news is that it's easy to save your custom report in Google Analytics.
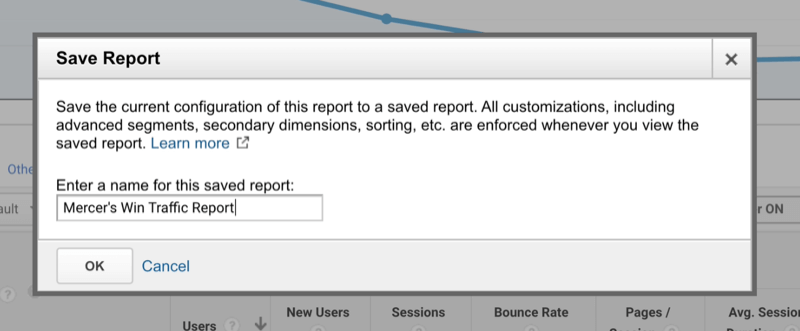
Start by clicking on Save in the upper-right corner of the screen.

In the pop-up window, type in a descriptive name for your report and click OK.

Discover Proven Marketing Strategies and Tips
Want to go even deeper with your marketing? Check out the Social Media Marketing Podcast! Publishing weekly since 2012, the Social Media Marketing Podcast helps you navigate the constantly changing marketing jungle, with expert interviews from marketing pros.
But don’t let the name fool you. This show is about a lot more than just social media marketing. With over 600 episodes and millions of downloads each year, this show has been a trusted source for marketers for well over a decade.
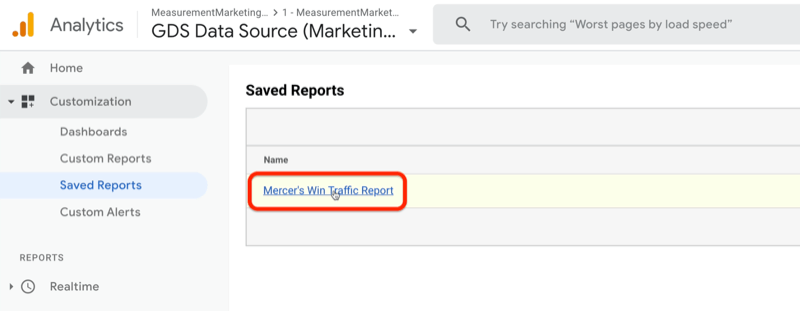
Once you've saved your report, you're probably wondering how to get back to it later on. In the left navigation, click on Customization > Saved Reports and you'll see the report you just saved in the Saved Reports list.
Once you know how many leads are coming in from different traffic sources, what can you do with this information?
Below, you can see that ecommerce-unmasked/email has generated a pretty decent amount of leads (12) for me in a short period of time and has a decent conversion rate (36%) compared to the other traffic sources that are coming through.
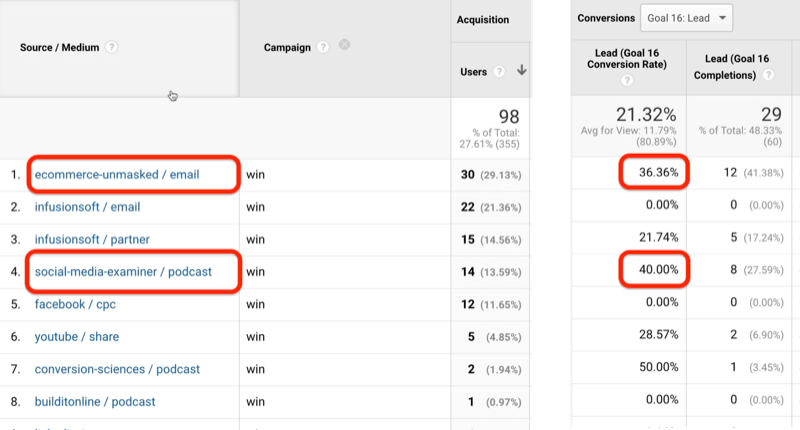
There's only one traffic source that has a slightly better conversion rate—the traffic I've gotten from the Social Media Examiner podcast I recently did. It's converting at 40%. This data tells me that podcast traffic is a good type of traffic for me to have so I'll want to generate more podcast traffic. And how do I do it? By getting on more podcasts.
This is an example of how you can take the information you find in Google Analytics and turn it into actionable marketing results.
Bonus: Customize the All Pages Report to Reveal 404 Errors
At this point, you've customized the source/medium report and saved it so you can quickly identify where your traffic is coming from. But what happens if you start losing that traffic because you have broken links—the dreaded 404 page? You might not know that's happening but your site visitors do, and so does Google Analytics with a little customization.

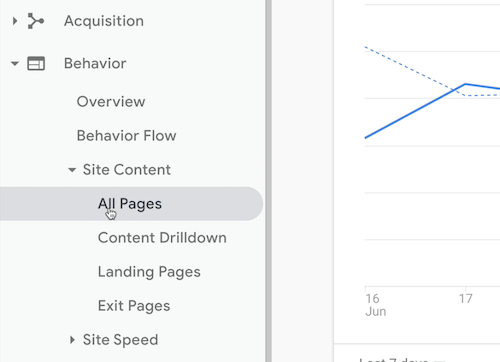
This time, you're going to customize a different type of report in Google Analytics. To access this report, go to Behavior > Site Content > All Pages in the left navigation.
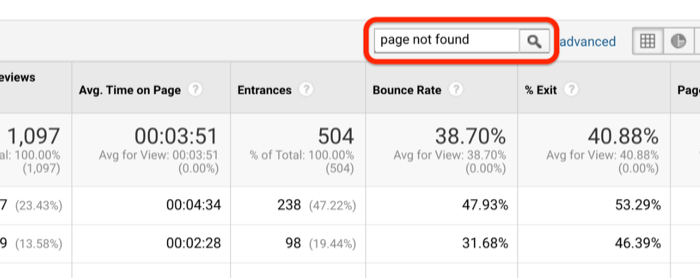
Next, you want to search for a page title that will identify your 404s. To do this, type “page not found” in the search box. The reason you're searching for this phrase is that the title of the 404 page normally is “page not found.” If your 404 page doesn't say this, it will say something else so search for that here instead.
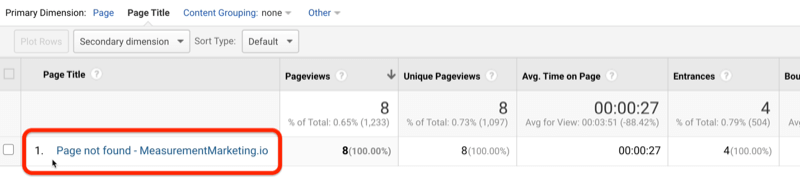
After you press Enter, you'll see all of the different 404 pages. These were all broken links. To find out what the links are, click the page title.
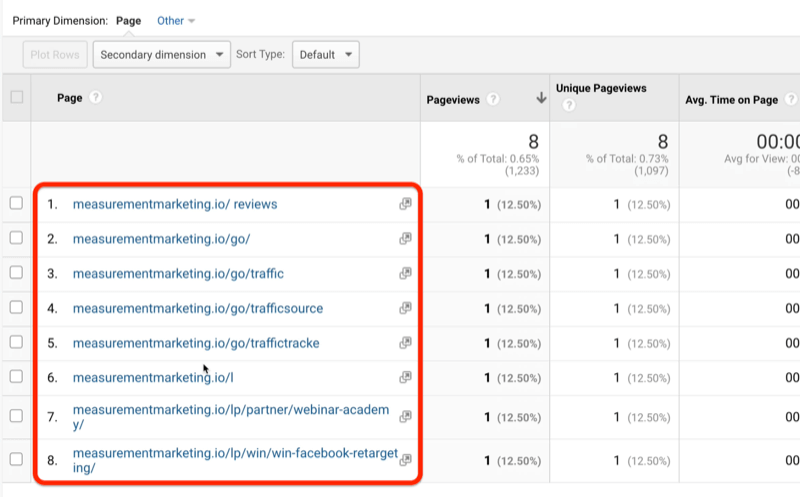
Now you can see what people typed in if they didn't find what they were looking for. They saw a broken link instead.
Now let's talk about how to use this report.
In the image above, you can see my visitors have mistyped a few different things. That's important information because you want to make sure that your links are easy to type in.
Another thing this report can reveal is if you sent an email out with the wrong link. You'd instantly see that issue here so you can fix it.
In my case, I started to notice that people were looking for our tools so we decided to change what our 404 page looks like. Now when it 404s, the page says, “Oops! Looks like you're in the wrong spot… What are you trying to do?” It then asks people if they're looking for the toolbox or one of our courses. That simple change has led to leads and sales and it only happened because we created this custom report in Google Analytics and saw what was happening. You can do the same thing.

As with the custom report you built earlier, you can save your customized All Pages report so you don't have to rebuild it later. Again, just click Save and name it something like “404 Report.” Then click OK and you're done.
Conclusion
Setting up these two custom reports in Google Analytics will help you quickly get to the data that will answer the questions you have. The source/medium custom report will help you see which traffic sources are actually creating leads, and the All Pages custom report will help you figure out where you're losing valuable traffic. And best of all, you can save these custom reports for quick access so you don't have to rebuild them later on.
What do you think? How will you use these Google Analytics reports to improve your own marketing? Share your thoughts in the comments below.
More articles on Google Analytics:
- Discover how to use Standard and Enhanced Ecommerce reports in Google Analytics.
- Learn how Google Analytics attributes traffic from Facebook.
- Find out how to analyze your YouTube channel performance in Google Analytics.
Attention Agency Owners, Brand Marketers, and Consultants

Introducing the Marketing Agency Show–our newest podcast designed to explore the struggles of agency marketers.
Join show host and agency owner, Brooke Sellas, as she interviews agency marketers and digs deep into their biggest challenges. Explore topics like navigating rough economic times, leveraging AI, service diversification, client acquisition, and much more.
Just pull up your favorite podcast app, search for Marketing Agency Show and start listening. Or click the button below for more information.
