 Do you sell products or services online? Wondering how Google Analytics can reveal useful details that impact your revenue?
In this article, you’ll discover how to use Standard and Enhanced Ecommerce reports in Google Analytics.
What Are Google Analytics Ecommerce Reports?
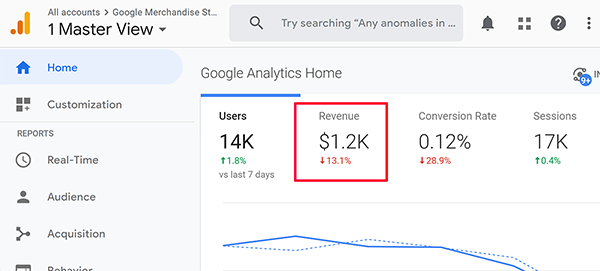
In Google Analytics, Ecommerce reports help you learn more about the revenue displayed on the Home screen. (Whenever you see revenue, you have eCommerce information coming into Google Analytics.) In this example, the Home screen shows revenue of $1.2K.
Google Analytics has two types of Ecommerce reports: Standard and Enhanced. They both tell you what products were purchased, how many products were purchased, and the amount of revenue those products generated.
The difference is that the Enhanced reports show you more information than the Standard reports. Both reports tell you what happened, but the Enhanced reports also show how you generated your revenue by providing more detail about the customer journey.
However, just because the Enhanced reports show more data doesn’t mean they’re better for your business. The Standard reports are easier to set up with Google Tag Manager, third-party carts, and other tools because they’ve been available longer. To choose the best reporting option for your business, it’s helpful to see what they offer and how you can use each one with other tools to analyze your revenue.
How to Navigate Ecommerce Reports in Google Analytics
In Google Analytics, you find Ecommerce reports under the Conversions tab in the left-hand sidebar. (That’s because conversions are about results and the revenue contained in the Ecommerce reports is a result of your users’ actions.) As you move through each Ecommerce report, you can see how the Standard and Enhanced reports tell stories about your revenue in different ways.
Standard Ecommerce Reports
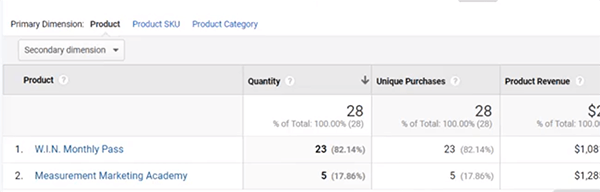
For the Standard setup, the Ecommerce Overview report shows the basics: the eCommerce conversion rate, the number of transactions, and the amount of revenue. The Product Performance report shows the products you have, how many were purchased in the selected period of time, and the revenue (not profit) those products generated. You can also see average price and average quantity.
The Sales Performance report shows the same information as the Product Performance report but emphasizes what happened by date. Specifically, it shows how much money you made on different dates so you can track revenue by those dates.
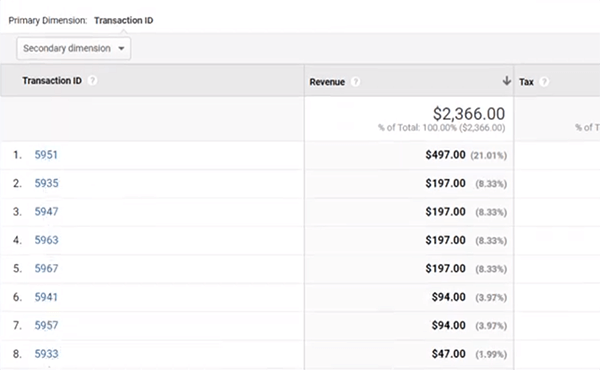
The Transactions report tells you what happened by order IDs. By listing the data based on each order ID that comes through your system, you can see how much each product sells for in each order.
The Time to Purchase report shows the number of days until a transaction actually occurred, which gives you an idea of what your time lag is.
Which AI Moves Actually Matter?
That's what every marketer is wrestling with now. New AI strategies, new tools, new takes every week — but no clarity. Most marketers and business owners are trying to figure out AI alone.The AI Business Society is your trusted guide. Get expert-led training you can put to work immediately. Plus a community of marketers sharing what's actually working.
I'M READY FOR REAL AI RESULTSEnhanced Ecommerce Reports
In the Enhanced Ecommerce reports, you see what happened just as you would in the Standard reports, but you also see more detail about how you generated revenue. Like the Standard Overview report, the Enhanced Overview report shows revenue and transactions, but it looks a little different.
The Enhanced Product Performance report is also similar to its Standard counterpart in that you see all products, the revenue they generated, the number of purchases, and the quantity, as well as average quantity and average price. However, you also see details like product refunds and cart-to-detail and buy-to-detail rates.
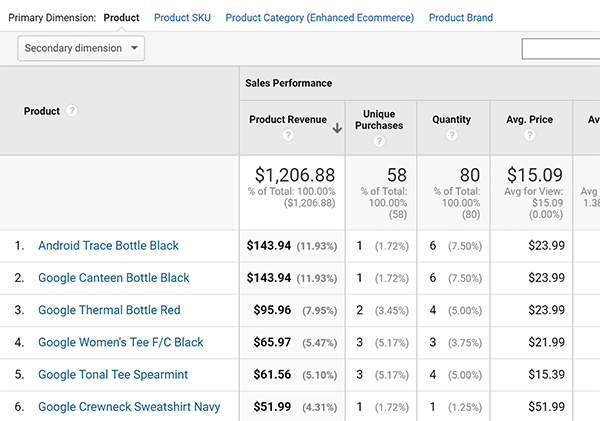
The additional information in the Enhanced Product Performance report shows how well your customer journey is working. The cart-to-detail rate measures the rate at which people who viewed the product detail pages moved into the cart process from those detail pages. The buy-to-detail rate shows the rate at which people who saw the product detail pages actually made a purchase.
The other Enhanced Ecommerce reports are completely different than the Standard Ecommerce reports.
The Shopping Behavior report shows how well your funnel is working by showing the number of sessions at each stage. For instance, you can see how many sessions included the product details page, added a product to the cart, selected a checkout option, and initiated checkout to process and fulfill the purchase.
3 Days of World-Class Training—Zero Travel!

Couldn't make it to Social Media Marketing World and AI Business World this year? Get all of the great content at a fraction of the price with a Virtual ticket.
That’s full access to recordings of every keynote, workshop, and session—the ones people travel thousands of miles to see. Don't wait. Get your Virtual ticket and enjoy actionable content that you can watch anytime, anywhere.
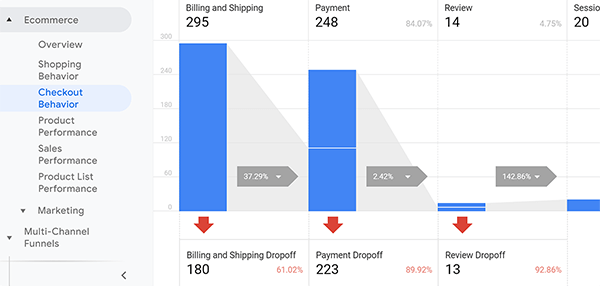
The Checkout Behavior report gives you a closer look at your checkout process, which may contain multiple steps. For each step in your checkout process, you can see how many people you retain. In this example, you can see how many people started the process, moved to the payment, reviewed payment, and then ultimately finished with a transaction.
The Sales Performance report shows the revenue from each order ID, along with information about tax, shipping, refunds, and quantity. Some of these metrics such as refund amount are only available in the Enhanced Ecommerce reports.
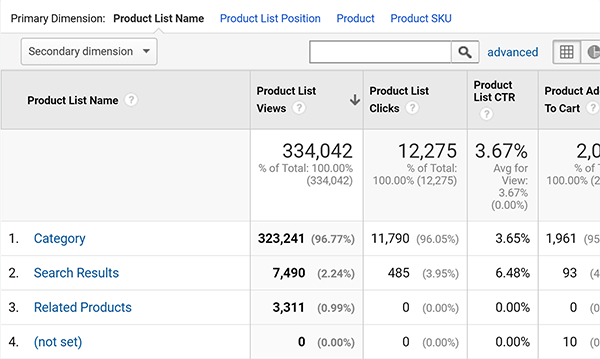
With the Product List Performance report, you can put products in a list and report that into Google Analytics. Click the Product List Position option, and you can test how products perform based on their position in the list. To visualize this, you can test whether the first product in the list gets more sales than the product in the seventh position.
Enhanced Ecommerce reports also offer a Marketing section with details about internal promotions, coupons, and affiliates. Select Internal Promotion to see how promotions for a product category (such as drinkware or Android-specific promotions) are generating revenue. The Order Coupon and Product Coupon options show how coupon codes that you pass through Google Analytics perform. You can also track affiliate codes to see how affiliates help your sales.
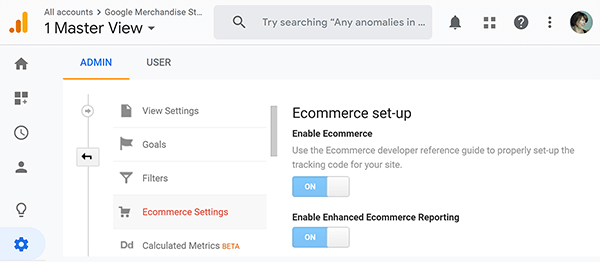
Tip: To explore the Enhanced reports in more detail, check out the Google Merchandise Store demo account.
Which Ecommerce Reports Should You Use, Standard or Enhanced?
When you’re deciding whether to use Standard or Enhanced reports, you need to consider the setup of your Google Analytics, how complex your eCommerce business is, and other tools you use to analyze and optimize your customer journey. Know up front that the setup for Standard versus Enhanced reports is incredibly different, with Enhanced being much more complicated.
Standard reporting is the easiest to set up. Your cart likely offers built-in integration with these reports. For example, WooCommerce, Shopify, and UltraCart help you integrate your cart with Google Analytics Standard reporting. You might be able to simply click a box, but some websites require a little help from your developer. Setting up Google Tag Manager with Standard reporting is also easy.
If you’re just getting started with eCommerce and want to set it up quickly, Google Analytics Standard reporting is the perfect fit for you because it’s so simple to set up and start passing these details from your cart to Google Analytics.
Although Google Analytics Enhanced reporting gives you a more detailed view of how things happen, the setup is complicated. You’ll have an easier time if you use Google Tag Manager with Shopify or WooCommerce, but the setup process still requires more steps because the Enhanced reports track more behaviors such as shopping and checkout.
You need the Enhanced reports only if you don’t have an easier way to answer questions about these behaviors. To illustrate, MeasurementMarketing.io uses Standard Ecommerce reports to tell us what happened. But because we use Google Data Studio to build out funnels, we can track how things happened in other ways.
Watch the video:
Conclusion
In Google Analytics, the Standard and Enhanced Ecommerce reports offer two different ways to analyze your revenue and optimize your customer journey.
Although the Enhanced Ecommerce reports offer more information, setting them up requires more work. Only make that extra effort if you don’t have another tool that helps you analyze your customer journey and sales funnels and how they generate revenue. And if you’re just getting started with Google Analytics Ecommerce reports, the Standard option is a great choice.
What do you think? Have you considered using the Enhanced Ecommerce reports? Will you try the Enhanced reports after reading this article? Please share your thoughts or tips in the comments.
More articles on social media metrics:
- Discover how Google Analytics attributes traffic from Facebook.
- Find out how to use Google Analytics to analyze the behavior of your site visitors.
- Learn how to manage and analyze your social media marketing in one dashboard.

Curious About How to Use AI?
Our newest show, AI Explored, might be just what you're looking for. It's for marketers, creators, and entrepreneurs who want to understand how to use AI in their business.
It's hosted by Michael Stelzner and explores this exciting new frontier in easy-to-understand terms.
Pull up your favorite podcast app and search for AI Explored. Or click the button below for more information.
