 Want your Facebook and Google ads to generate more revenue? Curious how Google Analytics data can help you find website optimizations that will help?
To explore how optimizing the customer journey helps you boost sales, I interview Tanner Larsson.
More About This Show
The Social Media Marketing podcast is designed to help busy marketers, business owners, and creators discover what works with social media marketing.
In this episode, I interview Tanner Larsson, an eCommerce optimization expert who focuses on revenue and the author of Ecommerce Evolved. His consultancy is Build Grow Scale, and he hosts an event called Build Grow Scale Live.
Tanner explains how marketers can analyze their whole customer-acquisition process to optimize revenue.
You'll also discover how analytics data can identify four revenue leaks that are easy to fix.

Share your feedback, read the show notes, and get the links mentioned in this episode below.
Listen Now
Where to subscribe: Apple Podcasts | Spotify | YouTube Music | YouTube | Amazon Music | RSS
Here are some of the things you'll discover in this show:
Revenue Optimization
Tanner's Story
In 2001, Tanner owned window cleaning and Christmas light businesses that were doing well, but he was bored. So he began learning about online marketing and sales with eBay and quickly became a PowerSeller. Although he loved selling online, the technology for eBay sellers was still so basic that he spent lots of time doing things he didn't like, such as weighing packages and printing labels.
Tanner then left eBay for ClickBank, an affiliate platform for informational and digital products. Inspired by people selling how-to business courses, he created one about building a window cleaning business. When he didn't get rich from this course, he realized the online space wasn't a magic place for making money. It was simply another business medium.
Tanner then began learning about online marketing and sales tactics. He not only loved implementing everything he learned, but also needed a new way to make a living. After almost going blind, he had a cornea transplant, which involved a long, restrictive healing process. Because he couldn't go outside or pick up anything over five pounds, he had to sell his window cleaning business.

After shifting to online sales, Tanner realized he preferred selling physical widgets, gizmos, and gadgets online. When you're selling an informational product, you have to go above and beyond to convince someone they need to buy it. Selling a physical product is easier for him because he can simply provide the supporting information.
Get World-Class Marketing Training — All Year Long!
Are you facing doubt, uncertainty, or overwhelm? The Social Media Marketing Society can help.
Each month, you’ll receive training from trusted marketing experts, covering everything from AI to organic social marketing. When you join, you’ll also get immediate access to:
- A library of 100+ marketing trainings
- A community of like-minded marketers
- Monthly online community meetups
- Relevant news and trends updates
Today, as a founder of Build Grow Scale, Tanner focuses only on eCommerce. The scope of his work has included online stores, sales funnels, and hybrid solutions. Through all of his big wins and losses, he's tested everything and learned to focus on a data-driven approach to eCommerce.
Some big losses with a Shopify store were especially useful in shaping Tanner's thinking about eCommerce. At first, the Shopify store took off, selling tens of thousands of products per week. But after a sudden change, he was writing $200,000 checks each month to keep the business afloat because the cash flow couldn't keep up with the growth.
After Tanner figured out what wasn't working, he started looking at data in a different, deeper way. Although his principles are based on eCommerce, you can use them for selling more than physical products. They would also work for visual products, services, and so on.
Listen to the show to hear more about Tanner's experience selling on eBay.
3 Mistakes Marketers Make When Acquiring Customers
 When marketers try to acquire customers, Tanner often finds they make three big mistakes. First, they're too focused on acquiring a customer and the first sale. Specifically, they want to cover all of their expenses and extract a profit from the first sale. This approach is a recipe for disaster and makes staying in business more difficult because you generate real profit from subsequent sales.
Second, marketers often don't leverage their data in the right way. Most people collect data by installing the Google Analytics tracking pixel on their site but never touch the data it generates. Tanner understands this because he used to hate data. However, he simply didn't understand the information that was available and how much it could help his business.
Third, marketers don't optimize the customer journey or analyze the details of all of the different customer journeys. A customer may be on social media before they visit your site, and one journey is the process you create to move them from impressions to clicks to your site.
The journey that drives traffic from social media to the website often gets the most focus, but the site or store journeys are just as important. These journeys begin when a customer lands on the site, and end with the time and fashion in which they leave. For example, people who bounce and people who buy have different customer journeys that are likely being neglected.
When you optimize the customer journey through the site and store, you improve the entire conversion process and eliminate friction points or disconnects at each step. When Facebook or Google ads aren't converting, marketers tend to focus on improving the ad targeting. However, finding the point on the website or store that needs to be optimized can be the change that truly improves conversions.
Because marketers know their product and website so well, they often don't see the roadblocks or friction points that appear on the site during the sales process. By using data to optimize your customer journey, you can see where you're losing sales and not even realizing it.
Listen to the show to hear my thoughts about leveraging the full picture your data can provide.
7 Sections of the Customer Journey
To explain how to optimize the customer journey, Tanner breaks down what he considers the seven sections and where marketers often make mistakes at each section.
Home Page: Although website visitors can arrive via different landing pages, many arrive via your home page.
A common misconception is that your site doesn't need search because you have only one product, sell a service, or something else. However, data shows almost every site can benefit from having search functionality prominently displayed on the site because customers don't just search for products; they search for answers. Then, you can collect data about search (which helps you improve your site) by turning on Site Search tracking.
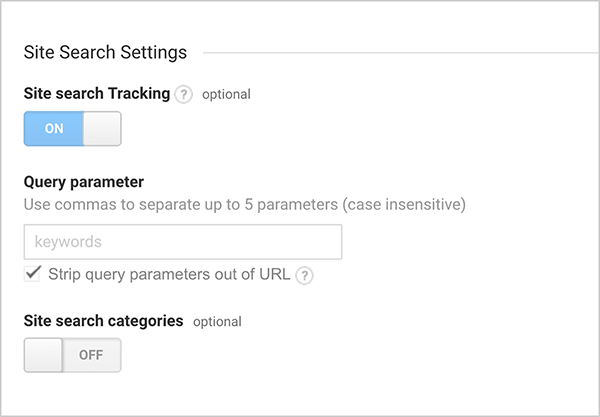
You also want to look for other issues on your home page, including complicated navigation, no clear value proposition, and sliders. Sliders are banner images that rotate right below the navigation. Although sliders are popular, they've lost in every website test Tanner and his company have run. Because sliders occupy valuable website real estate, this content can waste two-thirds of the screen.
Sliders often contain meaningless copy or product shots that aren't clickable. You don't want to dedicate the most important space on a website visitor's screen to this type of content. When you remove the sliders and move up important content, your site can start converting significantly better.
Tanner also emphasizes reducing clutter on the home page. On many websites, so many things are going on that the eye doesn't know where to go. As you examine the customer journey, make sure the home page design helps visitors focus on what you want them to see and provides intuitive navigation.
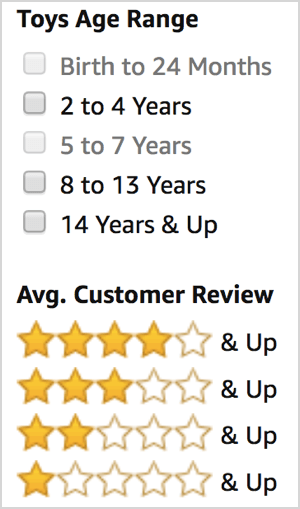
Category and Collection Pages: On a website that sells products, these pages organize and potentially display your offerings. Most online stores use the default filters, which don't necessarily line up with the product types that the store sells. When these pages are poorly organized or lack useful filters, visitors have difficulty finding the product that interests them.
To understand how useful filters can be, check out the left column of Amazon, which has awesome filters such as only Prime and only four stars and up.
Search Results Page: When your website offers search, you can manipulate the results visitors see in a way that optimizes the experience for the customer. If someone's search term doesn't produce any results, you can show a default response instead of nothing.
The layout of search results is also important. A garbled or unclear layout confuses visitors. However, you can streamline your search results page so visitors can easily skim the results and find what they need. To visualize this, notice how easy it is to skim Google search results pages.
Search results often pull in the generic metatext from the pages that appear in the results. However, this metatext is usually SEO bait that isn't optimized for sales, readability, or anything the customer cares about. Instead, make sure the search results provide information that shoppers or visitors will find useful. The results need to send people where they need to go.
Product Pages: Some of the biggest sales leaks happen on the product page, which is a sales page for a specific product. It might be a direct landing page or a page in a store.
If you're selling a physical product online, showing the wrong images on the product page can create problems. Because website visitors can't touch a product, the images need to help them see it as realistically as possible. The images might be poorly done or the wrong kind. If you show too many images, visitors can feel overwhelmed.
A product page also needs to answer questions on the page instead of directing customers to FAQs (frequently asked questions). When you send people to an FAQ for more information about your product, the visitor has to leave the product page for the FAQ page and sort through all of those questions.
Also, people abandon FAQ pages at a much higher rate than they do product pages. Answering a common question about your product or service on an FAQ page is like hiding the answer. Instead, answer these questions on the page that sells the product so customers have the information they need when they need it.
I ask Tanner what he thinks about video on product pages. Tanner says you need to consider how useful the video is to customers. When a video shares critical information the customer needs to move to the next step in the process, place the video above the fold on the product page. But a testimonial or hero-shot video belongs below the fold so it doesn't slow the page's download time.
Cart: You need to sequence each page in the cart carefully, keeping the customer focused only on the next step you want them to take.
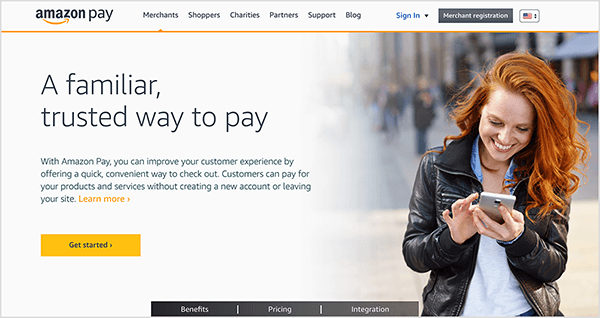
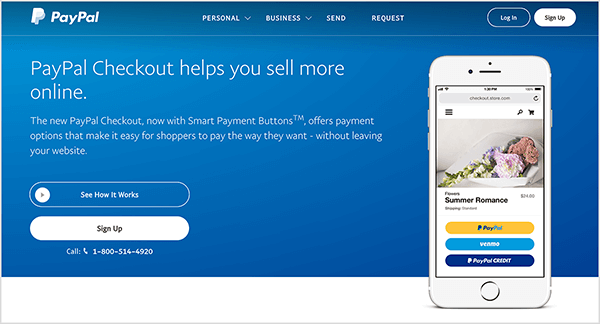
In many carts, customers see an option to pay with Amazon or PayPal immediately after adding an item to the cart. This sequence creates two problems. First, it pushes a buying decision before people have committed to pay or decided how to pay. Second, customers who click one of these options may leave your site before entering contact information that lets you follow up.
Collecting a customer's contact information before they leave your cart is important because that info enables you to follow up with people who abandon their cart. Without that data, the only thing you can do to bring them back is dynamic cart retargeting.
Instead, ask for an email and phone number before showing a payment option. You can suppress third-party payment options until customers reach the payment information page. Organize this page so customers can select a payment option and then enter their credit card number. Of all of the cart changes you can make, suppressing those buttons makes the biggest impact.
Some third-party payment options pop up without taking customers away from the cart, such as Stripe or PayPal Checkout (formerly PayPal Express). With these tools, you typically have a single-page cart process. In this case, Tanner recommends asking for the customer information first, and asking how customers would like to pay at the bottom of that page.
Checkout: After a customer adds an item to the cart, they're ready to go to checkout. If you don't have a cart, you skip right to checkout. With both the cart and checkout, poor abandonment recovery is the top issue. In the global eCommerce industry, abandonment totals $4 trillion per year in losses, and 30%-60% of that is recoverable.
High-ticket services or offers are significantly more likely to be recovered through a sales pipeline that automates abandonment follow-up. With this in mind, make the email field (not the name field) the very first one customers fill out on your order form or checkout page.
After the email field, ask for a phone number only if you're doing SMS follow-up. Otherwise, suppress the phone number field because each field you remove from your order form increases checkouts by 4.5%.
The checkout page also needs to be congruent with the rest of your website, which fosters trust with your customers. Say your company has a beautifully designed website but the checkout page is an ugly Infusionsoft order form that doesn't look anything like the site customers just left. That change in look and feel makes customers afraid the transaction isn't safe.
The checkout page also needs to offer support for customers who have an issue. In the header of the checkout page right next to your logo, show a customer support phone number and email. Making these contact options visible never increases your customer service volume but does improve customers' trust in the checkout process significantly, boosting completed checkouts by 17%.
If you use a live chat agent, you can add that to the checkout page, too. Tanner recommends keeping it minimized to avoid distractions. Let the customer pop it up if they want to chat with you.
Order Confirmation Page: Most businesses aren't managing customer expectations on the order confirmation page.

After you accept customers' money, you need to give them information about what happens next and what they need to do, if anything, after the sale. You can create a video or do whatever helps your customers feel comfortable.
The order confirmation page also offers the perfect moment to present an additional offer or start educating customers in a way that moves them toward the next escalation in your sales process.
When you work on optimizing the customer journey, don't jump into all of these areas at once. Tanner recommends you first analyze your site, starting at the home page (where the customer arrives at your site) and continuing through the checkout page.
After you finish the analysis, begin implementing actual changes where money changes hands—the checkout page. Then work your way forward to the home page so that every optimization builds on the preceding one. If you start at the home page but have a big problem in the middle or end of the journey, the home page changes won't help you increase conversions.
Listen to the show to hear how moving a video about Social Media Marketing World to the bottom of a page improved sales.
Revenue Optimization Versus Conversion Rate Optimization
Tanner and his team at Build Grow Scale coined revenue optimization because they needed a term that accurately captured what they do. Conversion rate optimization (CRO) emphasizes conversions, which is one step away from what people want. Revenue optimization emphasizes people's actual end goal: more money in their pocket.

Discover Proven Marketing Strategies and Tips
Want to go even deeper with your marketing? Check out the Social Media Marketing Podcast! Publishing weekly since 2012, the Social Media Marketing Podcast helps you navigate the constantly changing marketing jungle, with expert interviews from marketing pros.
But don’t let the name fool you. This show is about a lot more than just social media marketing. With over 600 episodes and millions of downloads each year, this show has been a trusted source for marketers for well over a decade.
Compared to CRO, revenue optimization is a more holistic approach to optimizing the site because it focuses on the entire customer journey, not just the front end. In fact, Build Grow Scale goes beyond the seven sections of the customer journey by digging into the website's back end. Also, with CRO, changes begin at the front, whereas Tanner begins changes at the end.
Revenue optimization and CRO also focus on slightly different outcomes. With CRO, you focus on conversion and lowering customer acquisition costs, which results in surface-level changes. In other words, you optimize the whispers instead of the shouts by optimizing what you see and testing what you think. For instance, change the color of a button and test how that impacts conversions.
With revenue optimization, Tanner and his team focus on presenting the right information at the right time to streamline the entire customer journey and remove all obstacles along the way. Because you test these changes with a direct focus on revenue, you avoid the problem he had with CRO, where conversions went up but revenue didn't.
Listen to the show to hear Tanner share more about the downsides of CRO.
How Data Can Identify Website Optimizations
Tanner then explains how you can use data to increase revenue. His suggestions are based on the work of eight full-time developers and data engineers at Build Grow Scale who spend about 500 hours per week running split tests on more than 24 websites.
To collect the data that helps you find these optimizations, you need to use Google Analytics and Google Tag Manager. No other data source can match the power of combining these tools. They not only collect data, but also give you access to cool filters, goals, and more that help you interpret that data.
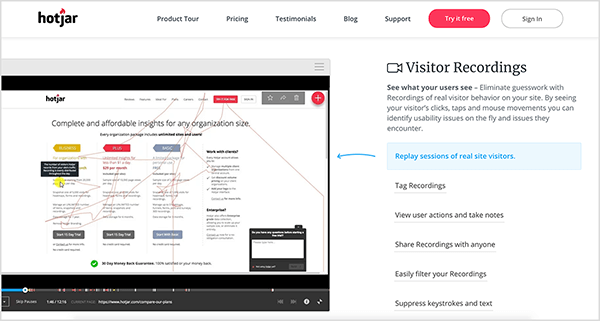
Tanner and his team use Google Analytics and Google Tag Manager to track every link, button, page, video, image, and so on. They also conduct user testing and use sites like Hotjar that record user sessions. After collecting all of this data, they pull reports to combine different data points and analyze what's happening.
To illustrate how you can collect and analyze data, Tanner shares four simple ways data can show you optimizations that boost revenue. These examples are all based on the same website that sells one product for $89. He shares how these not-so-obvious optimizations had a massive impact on the site's revenue. Each optimization you make builds on previous ones.
Analyze Search Data and Make Your Search Feature Prominent: By default, Google Analytics turns off the Site Search Tracking feature, which provides valuable data. To turn it on, open your account manager and turn on the Site Search Tracking feature.
The more prominent your search feature is, the better, because Site Search traffic data can help you improve your bottom line. When people search your site, you can extract the terms buyers use from Google Analytics and use those terms in your copy, ads, SEO, and so on along with your product name. You might also learn that buyers search for terms or your product differently than you expect.
On Tanner's example site, a Site Search report showed that 7% of the traffic used the search tool—a seemingly minor amount of traffic. However, when his team cross-referenced that group with an eCommerce report, they discovered that the 7% of people who searched accounted for 20% of the site's revenue and had a conversion rate of 14.75%, double the site's normal 7% conversion rate.
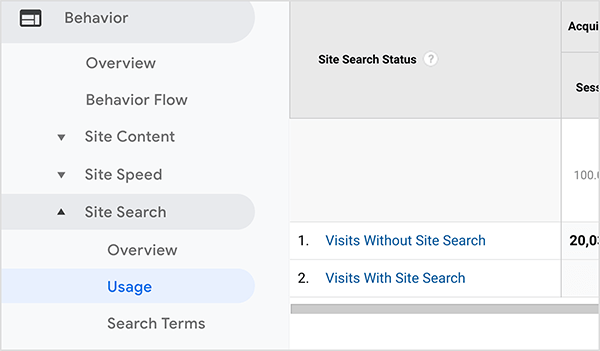
Based on these findings, Tanner's team optimized the site so that more people use the search feature. To make the search feature more prominent, they changed a little search bar on the left so that it now spans the top of the website. Now, around 13% of people use search, and those who do continue to convert at the higher rate, which has generated more revenue for the company.
In fact, sales have increased every time Tanner and his team have been able to increase the percentage of people who use the site's search function, whether it's mobile or desktop search.
Identify Underperforming Browser Segments: People use many different browsers, including Chrome, Safari, Firefox, and Edge. Mac users tend to use Safari or Chrome. PC users tend to prefer Firefox and Chrome. Some older people still think Internet Explorer is awesome.
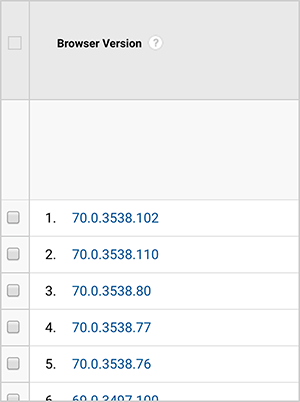
With these differences in mind, check for browser segments that underperform every month. You need to know which browsers and which versions of those browsers your visitors use. Then, for each browser version, check whether users convert (or become leads, consume content, etc.) at a lower rate than your site's average conversion or compared to people who use other browsers.
Although these data points seem geeky and boring, the impact of optimizing an underperforming segment is exciting. And everybody has underperforming browser segments, so you're guaranteed to find them. That's because browsers constantly push new updates, which can conflict with your site's existing code. Conversely, older browsers sometimes can't handle updates to website code.

You need to find underperforming segments because a browser conflict reduces the page's performance. To start, filter a Google Analytics report by device to separate mobile and desktop because they perform differently. Then click the lowest-performing browser segment to see how each version of that browser is performing. To illustrate, click Chrome to see how every version is performing.
Typically, you'll find that most browser versions are converting just fine, but a couple of them are significantly underperforming. After you identify those versions, share that data with your website developer or technology team. They'll use a tool like BrowserStack to look at the website with that browser version and figure out what the problem is.
The problem might be a code conflict happening under the hood or a display issue, like a button or image that doesn't appear correctly. If the site layout doesn't look right in that browser version, visitors may not trust that your site is safe.
When Tanner and his team looked for underperforming browser versions for his example site, the store had a conversion rate of around 7.11%, and 63% of website visitors used Chrome. The report showed Chrome users were converting at 6%, or 1% less than the site's average.
After identifying the issue and fixing one underperforming browser segment, the average conversion rate increased to 8%. With the increase from 6% to 7%, the website made 125 additional sales and added about $11,000 in revenue per month. Over the year, this optimization grew revenue by about $134,000.
Identify Underperforming Screen Resolutions: Your screen resolution is the pixel size of your screen, such as 1920 x 1080 pixels or 1366 x 786 pixels.
All resolutions should have the same conversion rate, so you want to look for resolutions that have a conversion rate that's lower than the site average. A low rate indicates your site looks squashed, something isn't lining up, mobile usage isn't working, or something like that.
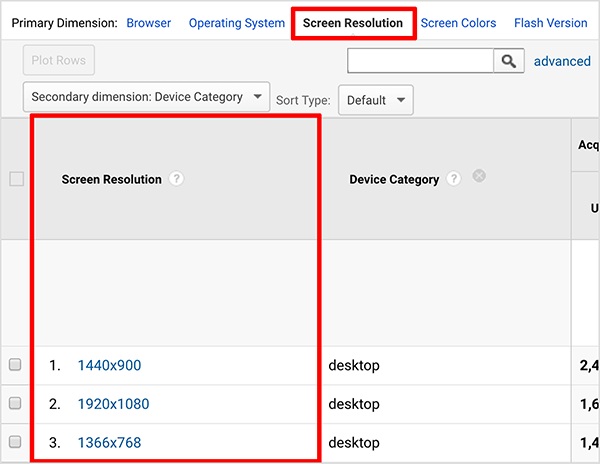
For each main browser, you look at the average conversion rate for different screen resolutions. Typically, two or three resolutions will drive most of your traffic, and of those, one or two will be underperforming compared to the other resolutions. Usually, an underperforming resolution has a display issue. For instance, an image or text covers up an Add to Cart button.
By fixing the problem, you can make some amazing revenue gains. For the example site, the 1366 x 768 resolution was underperforming, and about 13% or 14% of the website traffic used that resolution. After the display issue was resolved, the average conversion rate rose to match the rate for the other resolutions.
By leveraging and mining this data in Google Analytics, the team was able to identify a change and add 185 sales and about $16,000 in revenue per month. For the year, this optimization added about $200,000 of revenue.
Find High-Traffic Pages With Low Conversion Rates: For this optimization, you start by looking at traffic for every landing page on your website. In the report, you start with a list of all of the landing page URLs. Although you can sort these by source (such as ad traffic, organic, etc.), the report should simply list all of the pages but keep mobile and desktop users separate.
In this report, look for pages with a large number of sessions but a low conversion rate (or other key performance indicator, such as opt-ins). Because Google Tag Manager enables you to track people through the whole sales process, you can see the rate at which people convert for each landing page. To visualize this, someone who lands on the About Us page will convert at a certain rate.
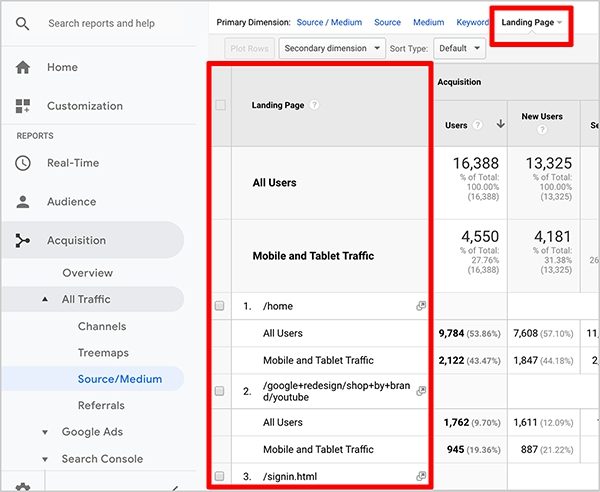
After you identify an underperforming page, look at the page like a customer and note disconnects or anything that seems out of the ordinary. Then, with a tool like Hotjar, create screen recordings and watch hundreds of consumers use your site. Notice where they click, what they do, and how long they spend in certain places. Patterns, bugs, and confusing areas will pop out at you.
Through sites like UserTesting, you can pay people to go through your site as a consumer who's never seen it before. They record the whole process and explain what they're thinking as they go through it. By watching these recordings, you can identify parts of your site that seem intuitive to you but aren't for users. After you identify and fix any issues you discover, you can run a split test.
By analyzing this data for the example site, Tanner and his team discovered that the About Us page was significantly underperforming: 13.2% of traffic entered via the About Us page, and the page had a conversion rate of 2.41%. Tanner finds that many people neglect their About Us page because they don't think of it as a money-making page. However, people do convert off of the About Us page.
Tanner and his team were able to increase the conversion rate for the About Us page to 6.6%, which wasn't quite as high as the site average of 7% but was still a good gain. As a result, the site added 340 extra sales and about $30,000 per month in revenue. For the year, that one optimization added up to about $363,000 per year of revenue.
The changes Tanner and his team made to the About Us page are especially interesting. The original About Us page featured a huge story about the company's founding and how they built the product. The story was well done, and the text was broken up nicely. However, the page had several issues.
To reach the product, users had to scroll back to the top. To fix this problem, Tanner and his team added Shop Now buttons throughout the copy, so that one always appeared on-screen as users scrolled.
The About Us page also featured a video that told the company's story. People were watching the video, but it was at the bottom of the page. Tanner and his team moved the video up and placed it left-justified next to some text. Then, at the bottom where the video was, they added a collage of lifestyle images that showed people using the product and a Shop Now button below the collage.
Although these four optimization examples require looking at conversion rates, Tanner emphasizes that the fixes aren't focused on conversion, but on increasing clarity across the entire customer journey. Anytime you do that, you win big.
Listen to the show to hear Tanner share how he changed from a spreadsheet avoider to a data geek.
Discovery of the Week
IG:dm is a desktop app that lets you manage Instagram direct messages from your desktop computer instead of your phone.

Some marketers prefer to manage social media on desktop because scrolling through Instagram on a phone can be addictive and distracting. On desktop, quelling the distractions is easier. However, the desktop version of Instagram doesn't let you answer and send direct messages; you have to use your phone. IG:dm adds this feature to macOS, Windows, and Linux computers.
After you download and install the software, you can use it to log into Instagram. All of your direct messages appear on the side so you can jump back into any of those. When you send messages, you type text or share a GIF, image, or video. However, you can't do other Instagram tasks like comment on posts. It's a single-feature app.
IG:dm is a free download available via the app website.
Listen to the show to learn more and let us know how IG:dm works for you.
Key takeaways mentioned in this episode:
- Learn more about Tanner and his work at the Build Grow Scale website.
- Get a copy of Ecommerce Evolved for free plus shipping or on Amazon.
- Discover more about Tanner's event, Build Grow Scale Live.
- Follow Build Grow Scale on Facebook and YouTube.
- Find out about the eBay PowerSeller program and ClickBank.
- Learn about Shopify stores.
- Discover how Amazon Pay, PayPal, PayPal Checkout, and Stripe work with your website.
- Read an introduction to using Google Analytics and Google Tag Manager.
- Find out how to turn on the Site Search Tracking feature in Google Analytics.
- See how your website looks in different browser versions with BrowserStack.
- Record user sessions on your website with Hotjar.
- Hire people to share how they use your site via UserTesting.
- Manage Instagram direct messages on your desktop with IG:dm.
- Tune into The Journey, our video documentary.
- Watch our weekly Social Media Marketing Talk Show on Fridays at 10 AM Pacific on Crowdcast or tune in on Facebook Live.
- Download the 2018 Social Media Marketing Industry Report.
- Learn more about Social Media Marketing World 2019.
Help Us Spread the Word! Please let your Twitter followers know about this podcast. Simply click here now to post a tweet.
If you enjoyed this episode of the Social Media Marketing podcast, please head over to iTunes, leave a rating, write a review, and subscribe. And if you listen on Stitcher, please click here to rate and review this show.
What do you think? What are your thoughts on revenue optimization? Please share your comments below.
Attention Agency Owners, Brand Marketers, and Consultants

Introducing the Marketing Agency Show–our newest podcast designed to explore the struggles of agency marketers.
Join show host and agency owner, Brooke Sellas, as she interviews agency marketers and digs deep into their biggest challenges. Explore topics like navigating rough economic times, leveraging AI, service diversification, client acquisition, and much more.
Just pull up your favorite podcast app, search for Marketing Agency Show and start listening. Or click the button below for more information.

