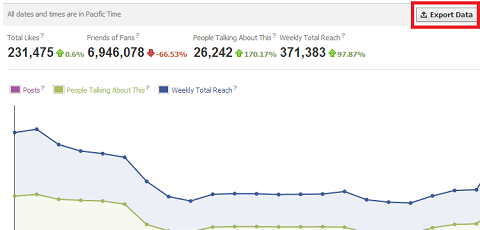
 Do you track your Facebook marketing?
Do you feel lost when you’re looking at your Facebook Page statistics?
Well, you’re not alone. Facebook metrics can be overwhelming and most Facebook Insights terminology is still hazy for many of us.
As a marketer, you know that what can be measured can be managed (and improved). So even if it seems complex, you need to measure your Facebook Page’s performance.
What statistics should you measure on your Facebook Page?
First you’ll want to focus on your Facebook post metrics. These are the only relevant indicators of the performance of your content. The other Facebook data can be misleading or gamed. But it’s very hard to trick individual post metrics.
Here are the six key metrics you need to track to understand your Facebook Page performance, why you need them and where to find them.
#1: Fan Reach
Fan reach simply corresponds to the number of fans of your Page who have seen any given post. This is “organic” reach, which means that it only records the views that occurred directly, and not through an action of a friend of a fan (such as a like, share or comment). The views that result from a friend’s actions are recorded in “viral” views.
Where to find your fan reach metrics
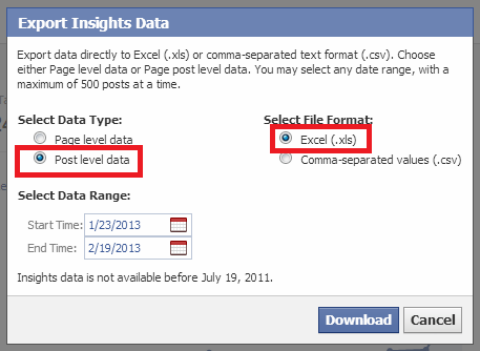
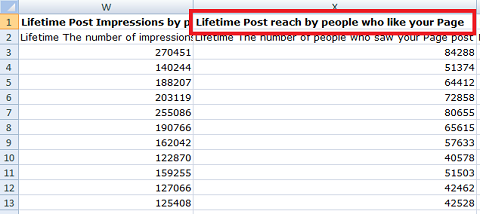
The fan reach metric is not available in the Facebook statistics interface; it’s only available in an Excel file available for download.
You’ll find it under the label “Lifetime Post reach by people who like your Page.” This is not as user-friendly as the web interface, I know, but it is important enough to spend the time retrieving this information.
Why your fan reach metrics are important to know
The per-post fan reach is probably the most important metric. It’s a key indicator. It helps you measure the appeal of your content to your audience and appreciate the quality of your audience.
An audience recruited from an eye-catching contest (or worse, bought through the thousands of questionable sites that sell “fans”) will quickly hide your posts from their newsfeed. If they don’t actively unsubscribe, their lack of interest (and therefore disengagement) will cause them to be effectively unsubscribed from your posts due to Facebook’s EdgeRank feature working behind the scenes.
Which AI Moves Actually Matter?
That's what every marketer is wrestling with now. New AI strategies, new tools, new takes every week — but no clarity. Most marketers and business owners are trying to figure out AI alone.The AI Business Society is your trusted guide. Get expert-led training you can put to work immediately. Plus a community of marketers sharing what's actually working.
I'M READY FOR REAL AI RESULTSFan reach is a key indicator of the health of your Facebook Page. The higher the quality of your audience and the more interesting your content, the more fans (and potential fans) you will reach.
#2: Organic Reach
Organic reach corresponds with the number of people, fans and non-fans, who have seen a given post. As with fan reach, organic reach only records views that are not the result of a friend of a fan’s action (which is counted in the viral reach).
The real difference between the fan reach (above) and this metric is that the organic reach includes views of people that are not fans of the Page but have directly accessed your Page or seen its content in a widget (for example, a “like box” on your site or blog).
Where to find your organic reach metrics
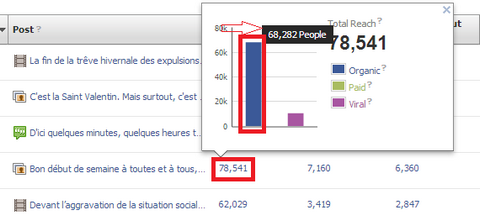
The organic reach is easier to find, as it is located within the Insight interface of your Page.
Just go to your Insights, scroll down to your list of posts, click on the Reach number for each post and hover your mouse on the bar chart for “Organic” and you’ll see the number.
You can also see this stat under each post if you’re logged into your Page.
So, if you have not downloaded the Excel file to get your fan reach as outlined above, you can check your organic reach metrics instead. But remember that your organic reach metrics can be quite different from your fan reach metrics.
The example below shows the differences we found between two Pages when comparing results of these two metrics.
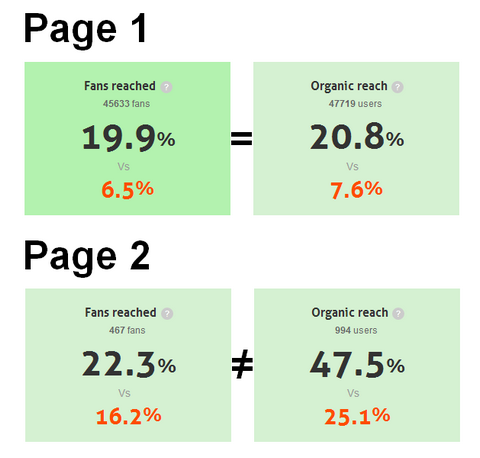
As you can see, your organic reach may not be an accurate reflection of your fan reach. So before relying on organic reach instead of fan reach, check if your Page has a big difference between the two.
Why your organic reach metrics are important to know
Organic reach can replace fan reach in the metrics you want to follow, but only if the average difference between organic and fan reach is not too high with your audience.
Your organic reach metrics can help you identify ways to improve your content’s organic visibility. For example, when organic reach is very close to fan reach, it usually means that people cannot be exposed to your content if they are not already fans.
This could be the consequence of a lack of proper communication about your Fan Page on your other marketing channels. If you have a website, a blog and a newsletter and there is very little difference between your organic and fan reach results, it probably means that you are not attracting a new non-fan audience to your content.
If this is your case, try to better promote your Page on other channels and you should see your organic reach going up.
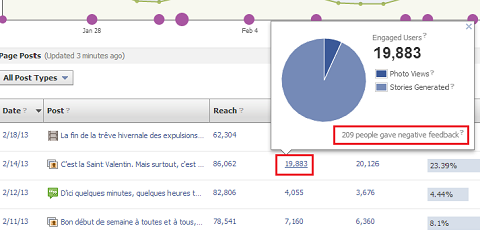
#3: Engagement
According to Facebook, with regards to post level metrics, engagement is “the number of people who clicked anywhere in your post”.
This includes liking, commenting and sharing and people who’ve viewed your video or clicked on your links and photos. And it also includes people who’ve clicked on a commenter’s name, liked a comment, clicked on your Page name and even gave negative feedback by reporting your post.
Engaged users are people who have clicked on this content from anywhere.
It’s the most important metric to know after your reach metric. Reach tells you how many people have potentially seen your content; engagement is the number of people who have interacted with your content.
Where to find your engagement metrics
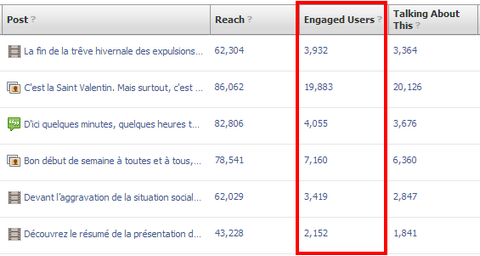
To see the engagement metric for each post, go to your Insights at the same place where you looked at your organic reach. The number of people who engaged with your content is right there in the “Engaged Users” column.
Why your engagement metrics are important to know
Engagement—whether the type that implies “acting” on your post by commenting, liking or sharing it, or the type that is more “passive,” such as watching the video, zooming on a photo or clicking on a link—is probably the second most important metric to focus on if you are serious about measuring your Page’s performance.
It’s not enough for your updates to be viewed by a lot of people. You need to make sure that the content you offer your audience triggers some kind of interest. And engagement is the only measurable sign of interest.
3 Days of World-Class Training—Zero Travel!

Couldn't make it to Social Media Marketing World and AI Business World this year? Get all of the great content at a fraction of the price with a Virtual ticket.
That’s full access to recordings of every keynote, workshop, and session—the ones people travel thousands of miles to see. Don't wait. Get your Virtual ticket and enjoy actionable content that you can watch anytime, anywhere.
When measuring engagement, do not focus on the raw number you see in your Insights. The only way to really understand that metric and compare posts is to look at the number of engaged people and the number of people reached for the post in question.
The only way to compare a post engagement metric with your other posts is to create a percentage. This gives you a number that you can use to benchmark the performance of each of your posts.

This formula helps you understand your results. If you rely solely on the number of engaged users, you’ll never know if good engagement on a specific post is due to the quality of your content, or if it was simply shown to more people.
This gives you a percentage that takes the exposure of the post into account and allows the comparison between posts.
#4: People Talking About This (or Storytellers)
The “People Talking About This” data in Facebook Insights is sometimes referred to as “Storytellers.” This is one of Facebook’s metrics that few people understand.
Here’s what you need to know. This metric is part of the engagement metric. So the number of “people talking about” a post is included in the number of people who “engaged” with that post.
The “people talking about this” metric only measures three types of actions: likes, comments or shares.
What makes “people talking about this” different from the engagement metric above is that it highlights the number of your fans who did something to show engagement to their friends.
Where to find your “people talking about this” metrics
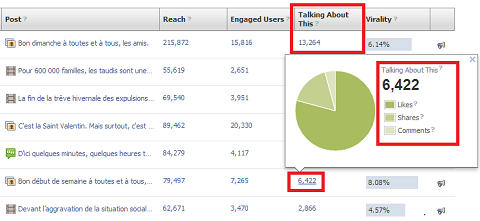
Again, go to your Insights interface where you found your organic reach and engagement stats, and look at the “Talking About This” column. Easy.
Why your “people talking about this” metric is important to know
This is the “viral” metric. One of your motivations for creating a Facebook Page was probably to connect with the friends of your existing fans for free! The “people talking about this” metric is the best for measuring how many people are willing to spread the word about you to their friends.
Remember, when a user likes, comments on or shares a post on your Page, Facebook may decide to publish this to this user’s friends to show that this user liked, commented on or shared a piece of content from your Page. I emphasize the “may” because Facebook is limiting the reach of these stories.
So, don’t expect too much from this metric. Although Facebook is still the best place to leverage viral stories like these, it’s not what it used to be. You used to frequently see in your newsfeed that a friend had liked, commented on or shared a piece of content from a Page. Chances are that you see less of this today.
#5: Click-Through Rate
Here comes a metric that you are sure to be familiar with! The CTR, or click-through rate, has been around for years on the web. It’s used to measure the effectiveness of email marketing, banner advertising, search engine ads such as Adwords campaigns or landing page quality.
The good news is that it means the same thing within Facebook. Click-through rates tell you the number of people who have clicked on a link in your content, watched your video or viewed a larger version of your photo.
Where to find your click-through metrics
Go to your Page Insights interface, click on the Engaged Users number and you’ll find the number of users who have clicked on your content.
If the content is a link, it will be named “Link Clicks;” if it is a video, it will be labeled “Video Plays;” if it is a photo, it’ll read “Photo Views.” Pretty straightforward.
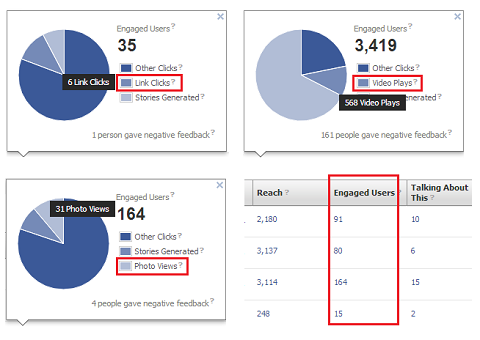
Why your click-through metrics are important to know
It is nice to know how many people have potentially seen your content (the reach metric), and even nicer to know how many of them were interested enough to act on it (engaged users), as outlined above.
But the bottom line is to know how many people were interested enough to pay attention to your content. And this means watching your video, looking at your photo or checking out your link.
The click-through metric is the bottom of your content quality funnel. Keep an eye on it.
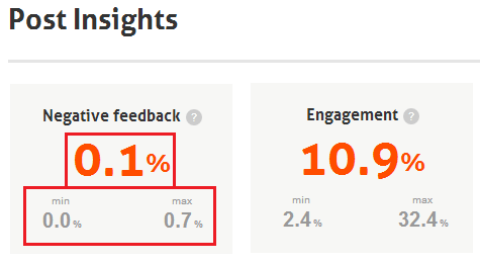
#6: Negative Feedback
Negative feedback is a “negative” action taken by a fan on your piece of content. It can be hiding a specific post, hiding all future posts from your Page, unliking your Page or even worse, reporting it as spam.
Simply put, the negative feedback metric counts the number of users who really did not like your content or the fact that it appeared in their newsfeed.
Where to find your negative feedback metrics
Go to your Page Insights interface, click on the Engaged Users number and you’ll find the number of users who gave negative feedback at the bottom of that window.
You cannot see the breakdown for the negative feedback number here in the Insights. If you want to know what negative actions were actually taken, you will have to download the Excel export as mentioned in the fan reach section above.
Why your negative feedback metrics are important to know
Since September 2012, Facebook has given more weight to the negative feedback metric. Posts with a high negative feedback number will have much less exposure through EdgeRank and Pages with an average negative feedback that remains high will have less and less reach over time.
Needless to say, if you want to benefit from your Facebook marketing, you need to keep your negative feedback numbers as low as possible.
As with all other engagement metrics (engaged users, people talking about your Page, clicks, etc.), when measuring negative feedback, do not focus on the number you see on your Insights dashboard.
The only way to really understand your negative feedback metric and compare the data you have for your different posts is to create a percentage score with the number of people who gave negative feedback and the number reached for that particular post.
You’ll end up with a percentage that makes sense because it takes the exposure of the post into account and allows you to compare results from different posts.
When looking at negative feedback in percentages, I’ve found the average negative feedback is 0.1%, but some Pages go as high as 0.7%!
Use These Six Metrics to Improve Your Facebook Marketing
Measuring your Facebook Page performance may seem like a daunting task if you have to do it manually from the Facebook Insights interface or the Excel download. And you may find it useful to start doing it that way to understand where the data comes from and what it means.
But once you’re familiar with the metrics, you can use third-party tools to save time. Although there are others, these free tools are a great place to start: Page Analyzer and Simply Measured (free version).
You can also decide to invest in paid tools such as Quintly, Pagelever, PostAcumen and Wisemetrics.
Your turn! What metrics are you paying attention to and why? Do you look at your data on Facebook directly or do you use a tool? Please leave your questions and comments in the box below.

Curious About How to Use AI?
Our newest show, AI Explored, might be just what you're looking for. It's for marketers, creators, and entrepreneurs who want to understand how to use AI in their business.
It's hosted by Michael Stelzner and explores this exciting new frontier in easy-to-understand terms.
Pull up your favorite podcast app and search for AI Explored. Or click the button below for more information.
