 Are you wondering if your Facebook content is connecting with people?
Building a compelling Facebook fan page is one thing. Creating consistent engagement is a whole other skill.
In this post, my intent is to bring to light several areas you may be overlooking that are causing your fan page to either plateau or not get off the ground much at all. To know more about Facebook engagement, check out this two-part post here and here.
The News Feed
Many businesses set up a Facebook fan page and look to their fan growth rate as the primary success metric. But number of fans isn't really the full story. You need to track and measure how much your fans are actually consuming, engaging with and sharing your content.
Some studies show that a whopping 90% of Facebook users don't return to a fan page once they click the Like button. They only see and interact with your content in their news feed. So your job is to ensure you're consistently posting relevant content that gets seen in the news feed of your fans and inspires lots of engagement with comments, likes, shares and @ tags.
To access your metrics, go to facebook.com/insights or click “View Insights” in the Admin panel at top right of your fan page. Insights are available on all fan pages with more than 30 fans, so if you just launched a new page, you'll need to get your first 30+ fans before you can begin tracking metrics.
Monitor Your Per-Post Insights
This is a handy three-part metric that's clearly displayed right on your fan page wall next to every post you create approximately 24 hours after publishing. The three parts are:
- What you posted
- The number of impressions
- The percent feedback
To clarify, impressions is the number of times your content was “rendered in the stream,” which means that your content was displayed on your fan page wall, shown in the news feed of fans, commented on or Liked.
Note that the impressions metric does not equate to an exact number of actual Facebook users; your content may be further down on the news feed while a fan is viewing other content. To see a more accurate number of actual views, go to Insights > Interactions > Post Views and that number is the total number of times your content has been viewed by fans and non-fans.
The percent feedback is calculated by taking the total number of comments plus Likes divided by the number of impressions. In the example below, I posted a photograph of the latest version of my social media business cards with an added QR code. The post was made on a Thursday at 5:10 pm PT—which is not my normal “high-traffic window” (typically 8:00 am – 12:30 pm PT). However, this particular post was very well-received, as it a) was a photo, which tends to get the highest weight in the news feed, b) contained exciting new information my fans wanted to know about and c) included actionable tips with links.
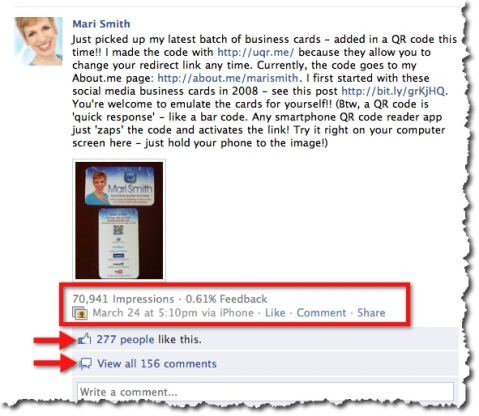
If you take 277 Likes + 156 comments = 433 / 70,941 impressions, the percent is 0.61%.
I recommend that you focus on the percent feedback number—you want that to increase. The number of impressions can be misleading. Sure, it's great to think tens of thousands of Facebook users are seeing your content. But you want them to engage with your content.

Discover Proven Marketing Strategies and Tips
Want to go even deeper with your marketing? Check out the Social Media Marketing Podcast! Publishing weekly since 2012, the Social Media Marketing Podcast helps you navigate the constantly changing marketing jungle, with expert interviews from marketing pros.
But don’t let the name fool you. This show is about a lot more than just social media marketing. With over 600 episodes and millions of downloads each year, this show has been a trusted source for marketers for well over a decade.
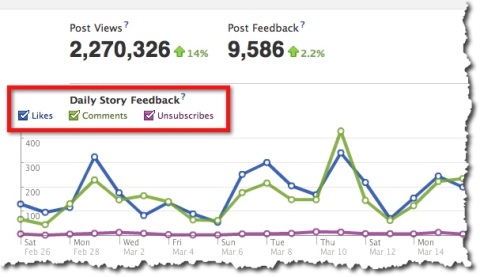
Monitor Your Daily Story Feedback
This metric also consists of three components, plus I added a fourth:
1. Total number of Likes on all of your content for any given day
2. Total number of comments on all of your content for any given day
3. Total number of “Unsubscribes” on any given day
4. Total number of “Unlikes” on any given day
Get World-Class Marketing Training — All Year Long!
Are you facing doubt, uncertainty, or overwhelm? The Social Media Marketing Society can help.
Each month, you’ll receive training from trusted marketing experts, covering everything from AI to organic social marketing. When you join, you’ll also get immediate access to:
- A library of 100+ marketing trainings
- A community of like-minded marketers
- Monthly online community meetups
- Relevant news and trends updates
The first two numbers are self-explanatory. However, Unsubscribes is a metric that's frequently overlooked by most Facebook fan page owners. When a fan chooses to hide your content from showing up in their news feed, this is considered an “Unsubscribe.” Remember, your fans are viewing your content primarily in their news feed.
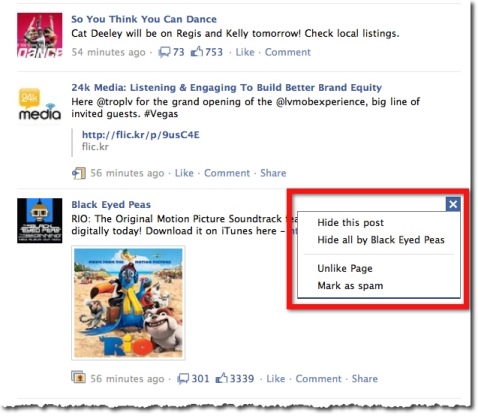
In the screenshot below, you can see the news feed options for a post made by a fan page I've Liked: Hide the post, Hide everything by the page, Unlike the page or Mark as spam.
The top two reasons that fans choose to hide your posts are 1) posting too frequently (meaning your posts are dominating their news feed and they can't see much of their friends' activity or other pages that they've Liked) and 2) posting content that's not relevant.
You can't see exactly which fans have hidden your posts from their news feed, nor can you necessarily tell exactly which piece of content caused fans to Unsubscribe (or Unlike). You can only see a total number for the day. It's vital to keep a watchful eye on this one metric alone. You may see your fan count growing nicely and maybe there's a decent amount of engagement happening. But you may be just treading water—as new fans join, others may be hiding your content.
You'll find your Daily Story Feedback under Insights > Interactions.
The fourth metric is the number of fans who have chosen to leave your fan page altogether. At least with the Unsubscribes, they're still fans and can post and engage on your wall. Facebook users may choose to Unlike fan pages for the same two reasons they hide posts—too frequent or not relevant. Fans can easily hover over any content in their news feed and select Hide or Unlike, as shown in the screenshot above with the Black Eyed Peas (just as an example!).
You'll find your Unlikes under Insights > Users > third graph down = New Likes and Unlikes.
There are many other metrics you can track and monitor via your Facebook Insights, such as Page Views; Daily, Weekly and Monthly Active Users; Daily Page Activity; Demographics; Media Consumption and more. But we'll save those for future blog posts!
For now, by monitoring your Unsubscribes (Hides) and Unlikes against what content you are posting each day and how much engagement (post comments and Likes) you're creating, you'll be better equipped to fine-tune variables such as the topics you post about, the type of content you post (photo, video, link, status update) and the time of day you post. Over time, you'll identify your own sweet spot for maximum engagement.
You might consider creating your own Excel spreadsheet as a dashboard. My coauthor, Chris Treadaway, and I recommend this practice in our book Facebook Marketing: An Hour a Day. In fact, I like to take the dashboard concept one step further and create a blend of an editorial calendar with retroactive tracking. That way you can plan what you're going to post and fine-tune along the way as you watch your daily engagement rates.
What do you think? What do you measure on your own fan page? Let us know in the comments below if this post was of value to you.
Attention Agency Owners, Brand Marketers, and Consultants

Introducing the Marketing Agency Show–our newest podcast designed to explore the struggles of agency marketers.
Join show host and agency owner, Brooke Sellas, as she interviews agency marketers and digs deep into their biggest challenges. Explore topics like navigating rough economic times, leveraging AI, service diversification, client acquisition, and much more.
Just pull up your favorite podcast app, search for Marketing Agency Show and start listening. Or click the button below for more information.
