Want to learn more about your LinkedIn company page and content performance? Did you know you can get on-the-go access to LinkedIn analytics on your mobile device?
In this article, you'll learn how to find and use LinkedIn analytics via the mobile app.
#1: How to Access Your LinkedIn Company Page Analytics via the Mobile App
Unlike Facebook Pages Manager, which has its own mobile app, you can only access LinkedIn company pages on mobile through the main LinkedIn app.
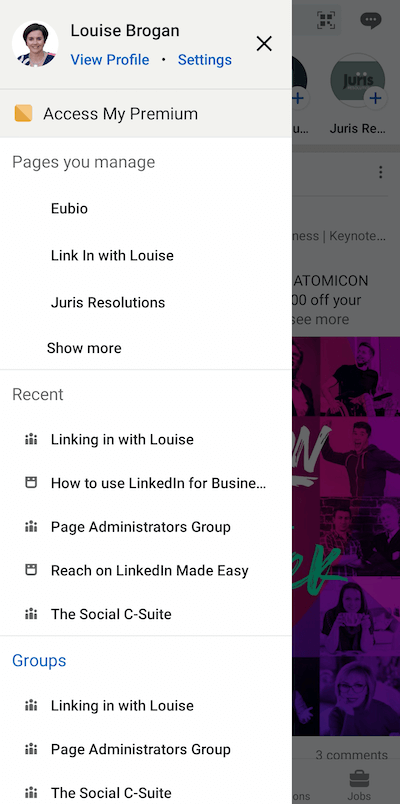
To navigate to your page, open the LinkedIn app and tap on your profile photo at the top left-hand side of your screen. From the slide-out menu that appears, select your company page.
Note: Only page admins can see LinkedIn page analytics. There are three types of page admins on LinkedIn: super admin, content admin, and analyst. This article explains the permissions for each type of admin.
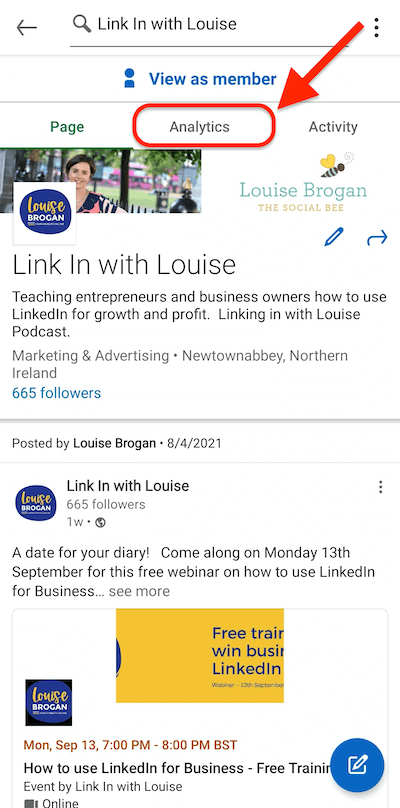
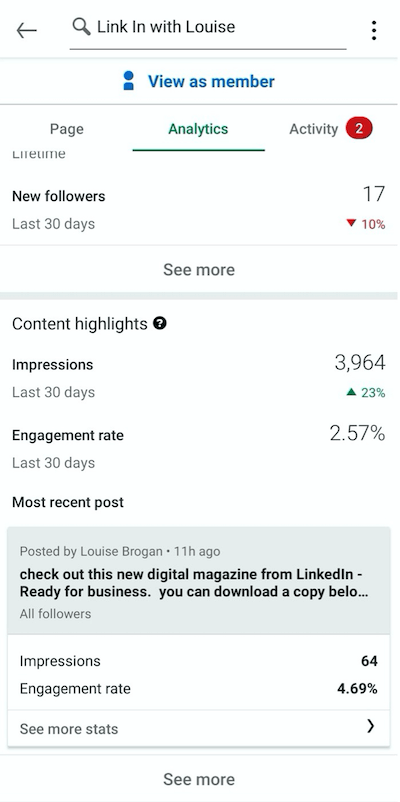
Once you're looking at your company page in Admin View, you'll see three tabs across the top of the screen—Page, Analytics, and Activity. Tap on the Analytics tab.
#2: Get a Performance Overview for Your LinkedIn Company Page and Content
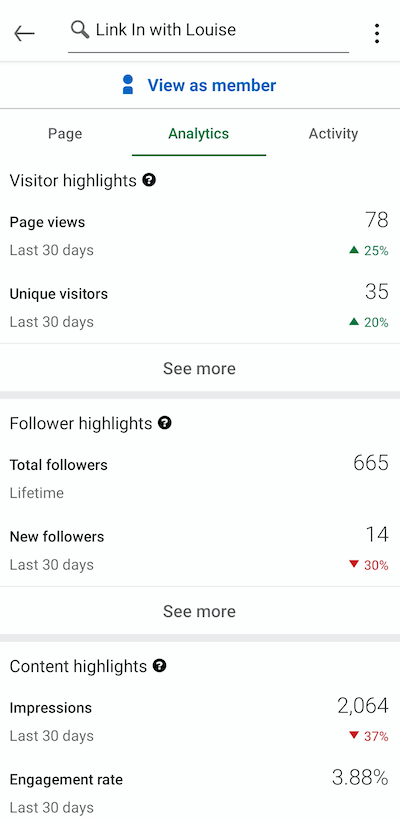
After tapping on the Analytics tab, you'll see a summary of highlights for your LinkedIn page, including:
- Visitor analytics
- Follower analytics
- Content analytics
- Stats for sponsored posts or boosted posts
If you tap on See More in each section, you can see more detailed data for the previous 30 days.
Each headline has a clickable question-mark icon. Tapping on this icon will explain more about the data you're looking at.
The summary screen gives you an overview of how your LinkedIn company page has performed over the past 30 days. Ideally, all of the change percentages will be green to reflect a positive direction. Reviewing this data regularly will help you gauge how your LinkedIn content is performing each month.
3 Days of World-Class Training—Zero Travel!

Couldn't make it to Social Media Marketing World and AI Business World this year? Get all of the great content at a fraction of the price with a Virtual ticket.
That’s full access to recordings of every keynote, workshop, and session—the ones people travel thousands of miles to see. Don't wait. Get your Virtual ticket and enjoy actionable content that you can watch anytime, anywhere.
For example, compare visitor highlights to follower highlights to see if visitors to your page are converting to followers. If you're seeing a percentage increase in visitors but you're not converting those visitors to followers, it's time to revisit your LinkedIn page strategy.
Also, check if increased content impressions are leading to increased visitors and followers.
#3: See LinkedIn Company Page Visitor Data
Under Visitor Highlights, you'll see two key pieces of data about visitors to your company page:
- Page Views: The total number of views your page has had over the last 30 days. A view is counted across all devices and tabs on your company page.
- Unique Visitors: The number of unique visitors to your page in the past 30 days. This number is calculated daily.
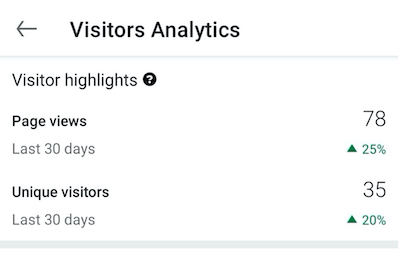
These metrics are measured for a 30-day period so you can see how your page is performing month to month. This data is counted across mobile and desktop and applies to views from logged-in LinkedIn members.
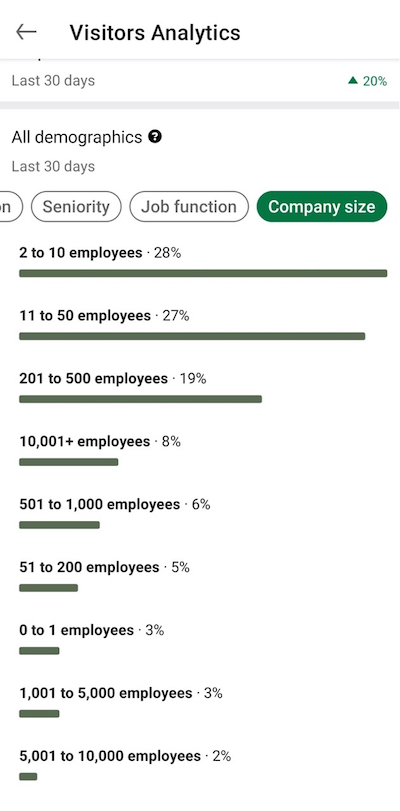
If you tap on See More under Visitor Highlights, you'll reveal more information about visitors to your company page. In addition to overview data, you'll see visitor demographics over the past 30 days.
You can filter visitor demographics data by category, including:
- Industry
- Location (at the country level)
- Seniority (for example, Owner/CXO/Director)
- Job Function (the role played in the company; e.g., Business Development, Administrative)
- Company Size (the size of the company/organization from 2–10 up to 10,001+ employees)
LinkedIn shows you what percentage of your visitors fall within each demographic.
These insights are important because you want to ensure your LinkedIn page is attracting your ideal audience. If your page is attracting a different audience than the one you're targeting, this data might help you uncover opportunities with new markets/industries or collaborations.
You may also find that a lot of potential employees may be visiting your page to learn more about your business or culture.
#4: View LinkedIn Company Page Follower Data
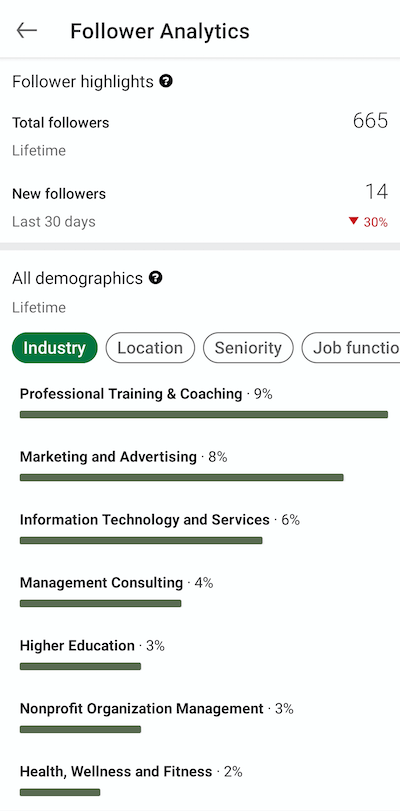
How many people are following your LinkedIn company page? The Follower Highlights key performance indicators (KPIs) share will show:
- Total followers: The total number of followers you've gained over the lifetime of your company page.
- New followers: The number of new followers you've gained in the last 30 days plus the percentage change from the previous 30-day period.
- Follower demographics: A breakdown of the demographics of the people who follow your page. This information is useful for tailoring your content to this audience. This data is measured across the lifetime of your company page.
The KPIs on demographics are measured by the aggregated demographics of LinkedIn members who follow your page. This is calculated by the formula:
Followers With This Demographic / Total Followers With Standardized Demographics
You can sort your followers' data by these attributes:
- Industry: Check which industries your followers work in. This is important because you want to attract followers who are most likely to invest in your products or services. Tailor your LinkedIn content for the demographic showing the most engagement and interest in your company.
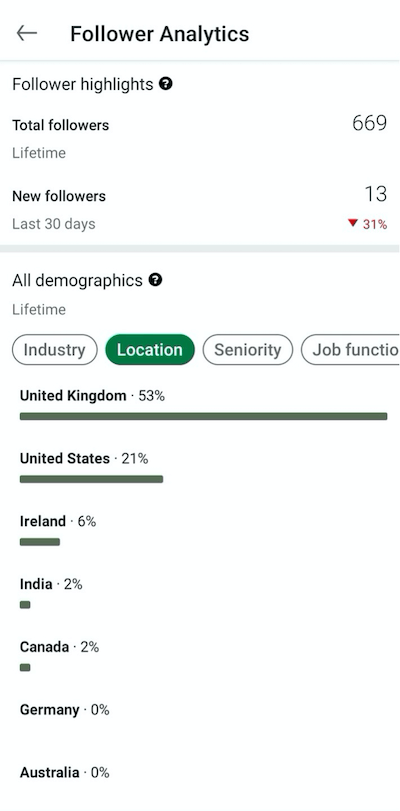
- Location: For many marketers working in a global marketplace, understanding the location of their audience can help determine where they should invest in sponsored content. If the majority of your followers are in the UK, for example, you could share content that relates to UK culture or current events. Targeted sponsored updates could then be aimed at the UK audience.
- Level of seniority: If your followers are in more senior management or CXO level roles, your page content could focus on more thought leadership content. LinkedIn attracts a more senior level of executive, and according to its own reports, those senior staff members enjoy reading thought leadership pieces online.
- Company size: Being able to view the size of the companies where your followers work will help determine if you're creating content for large corporate or smaller entrepreneurial or start-up audiences. Understanding who your followers are and what content they're engaging with will help guide your content marketing strategy and help you determine target audiences if you're going to invest in paid or sponsored content.
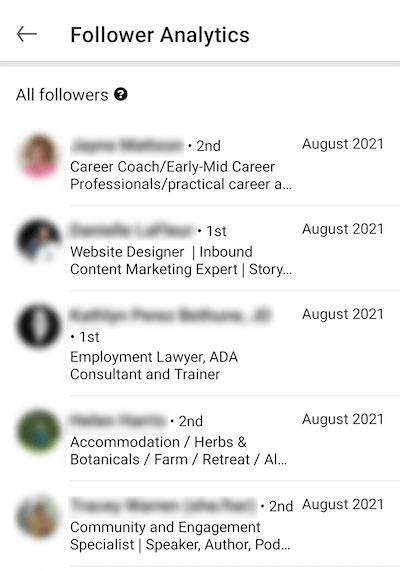
Viewing Individual LinkedIn Company Page Follower Information
Introduced in September 2020, LinkedIn's View Page Followers feature allows page admins to see details about the individual members who are following their page.
To see a list of your followers by name, open the Follower Analytics page and scroll down underneath the All Demographics section.
Want to Unlock AI Marketing Breakthroughs?
If you’re like most of us, you are trying to figure out how to use AI in your marketing. Here's the solution: The AI Business Society—from your friends at Social Media Examiner.The AI Business Society is the place to discover how to apply AI in your work. When you join, you'll boost your productivity, unlock your creativity, and make connections with other marketers on a similar journey.
I'M READY TO BECOME AN AI-POWERED MARKETERHere, you can see the name, headline, and date these LinkedIn members started following your page. Your followers will be listed in order by date, starting with the most recent.
Why does this matter to marketers? You can click on each follower and research what they're interested in, what topics they're discussing, and what hashtags they're following. These insights will help you develop content that will resonate with the people who are engaged enough to have followed your page.
If you have a marketing team, this could be a good project for someone on your team to research your customer persona.
You can click on any follower's name to visit their profile directly from this page. The list of followers will tell you if the member is in your network already (with 1st, 2nd, or 3rd+ beside their name). This feature will particularly benefit smaller businesses that can connect with their followers and start one-on-one conversations.
If you're hiring, note that some of your potential recruits may be included in this list of followers.
#5: Find LinkedIn Content Performance Data
Under Content Highlights, you'll find the impressions and engagement rate for your LinkedIn organic and sponsored content. This includes the new Boosted Post direct sponsored content option.
Impressions are the number of views your content has received when it's on-screen for at least 300 milliseconds or when someone has clicked on it.
Your engagement rate is calculated using this formula:
(Clicks + Likes + Comments + Shares + Follows) / Impressions
For a platform-wide benchmark to compare your page to, a SocialInsider study found that the average engagement rate on a post on LinkedIn is 0.35%.
Impressions and engagement rate are measured over the last 30 days so monitor your engagement rate each month to gauge how your content is improving. Benchmark your success against other businesses in your industry of a similar size or against your own performance.
The number of people who are following your page can impact your impressions. Ideally, you want all of your company page followers to see your content. However, with the average LinkedIn user visiting the platform only once a week, this could be a challenge. Posts from company pages don't perform quite as well as personal posts that create conversation among members.
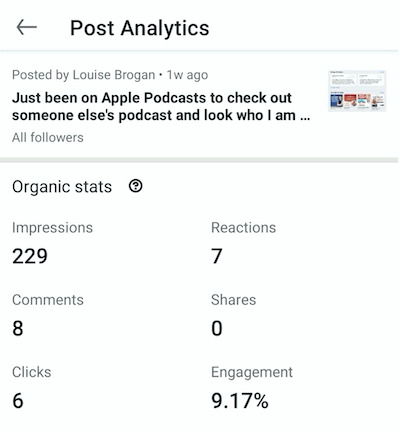
Your LinkedIn post analytics include the following:
- Organic stats
- Sponsored stats (if you've paid to sponsor your content)
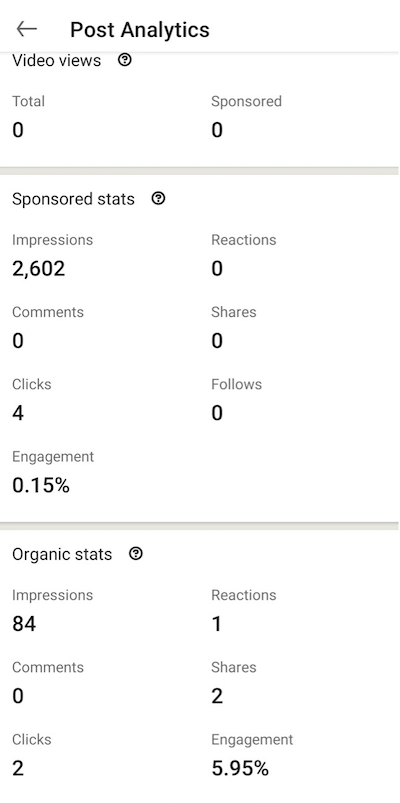
- Video views (for native LinkedIn video)
Tap on See More Stats for your most recent post to see the post analytics. At the top of the screen, you can see when the post was shared and by which member of your page admin team.
This level of detail is useful because you can measure what actions your followers are taking on your post.
By benchmarking the engagement percentage, you'll be able to measure what type of content your audience is most interested in. Consider the number of clicks and where those clicks lead people. A good measurement to track is how many people click through to your website versus how many people click on a video to watch or an article to read.
LinkedIn organic post KPIs include:
- Impressions: How many times your post has shown up on someone's LinkedIn screen
- Reactions: The number of people who have clicked on the Reaction button
- Shares: The number of times your post has been shared by an individual or organization
- Comments: The number of comments left on your post (this includes your responses)
- Clicks: The number of times someone has clicked on your post
- Engagement rate: Measured by the number of (Clicks + Likes + Comments + Shares + Follows) / Impressions
How you measure success for your LinkedIn content will depend on your goals. Understand the KPIs and measure them against your goals for your content. For example, if you're trying to drive people to your website, focus on the number of clicks.
Also consider how your post compares to the other posts on the page, controlling for type of post (video, SlideShare, PDF, image, or article).
A large increase in engagement likely indicates that this is a good time to boost the post for either brand awareness or lead generation. When you sponsor a post, you'll be able to see the sponsored post KPIs. On mobile analytics, these include:
- Impressions
- Comments
- Clicks
- Shares
- Follows
- Engagement rate
The addition of the follows KPI will demonstrate how many new followers you're getting as a result of sponsoring your content.
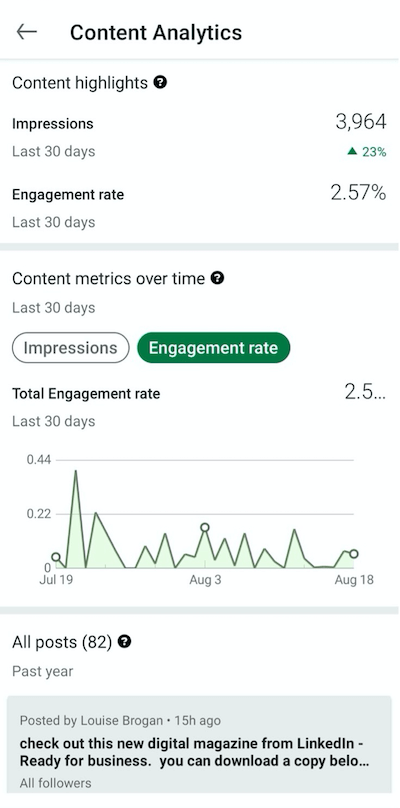
To view your content metrics over time, tap on See More in the Content Highlights section. In your content analytics, you can see the following data:
- Content Metrics: An aggregate number of organic and sponsored content over time. Sponsored metrics include sponsored content (through LinkedIn Campaign Manager) and direct sponsored content (boosting a post).
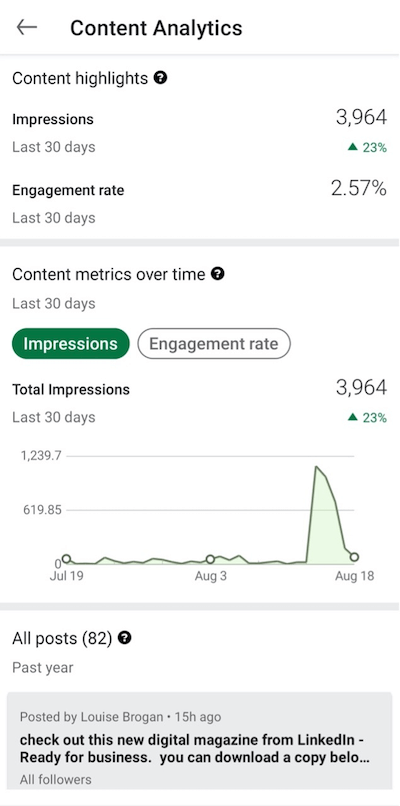
- Impressions over the last 30 days: Views when the content is on-screen for at least 300 ms or when it's clicked
- Engagement rate: This is calculated using the formula shown earlier.
Below the Content Metrics information, you can view all of your LinkedIn posts in the past year.
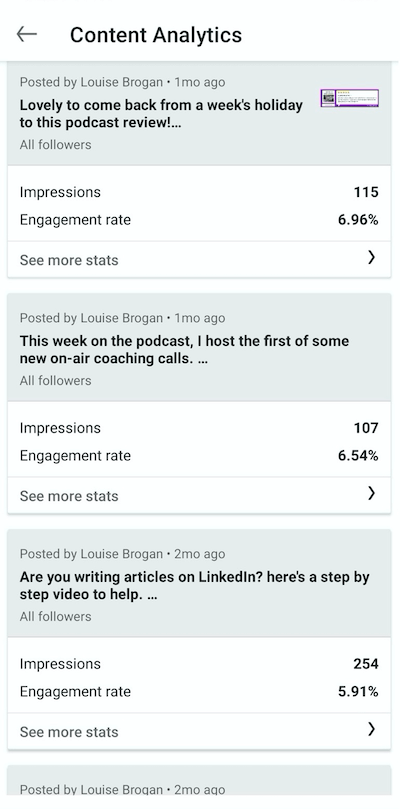
This summary reveals the impressions and engagement rate for each post. You can also see who posted the content and when. To see more detailed analytics for a post, tap on See More Stats below the summary.
Posts with images have a small icon of the image shared in this summary so you'll be able to see at a glance whether posts with images are getting more impressions.
Conclusion
By understanding who's visiting and following your LinkedIn page, you can tailor your content to build relationships with your audience.
Use your LinkedIn analytics to guide your organic content, and as you see your numbers increase across the three groups of analytics, think about whether it's time to start investing in sponsored content on LinkedIn. You can boost your post directly from the company page or create LinkedIn ads for longer paid campaigns.
While the LinkedIn mobile app offers a great deal of useful data when you're on the go, for more detailed information on your company page analytics, be sure to check out your LinkedIn analytics on desktop.
Get More Advice on LinkedIn Marketing
- Sell on LinkedIn without ads.
- Build your expertise using three types of video on LinkedIn.
- Manage your LinkedIn presence in 10 minutes a day.

Curious About How to Use AI?
Our newest show, AI Explored, might be just what you're looking for. It's for marketers, creators, and entrepreneurs who want to understand how to use AI in their business.
It's hosted by Michael Stelzner and explores this exciting new frontier in easy-to-understand terms.
Pull up your favorite podcast app and search for AI Explored. Or click the button below for more information.
