 Are you wondering what type of Facebook post works best?
Are you struggling with getting engagement or reach on your Facebook posts?
You may have heard that you need to post more photos or more questions or more photos with questions…
But what really works best for your audience?
In this article, you’ll learn how to find out which types of Facebook posts work best for your page.
Why Experiments?
Running controlled experiments from time to time will help you discover what works on your page so you won't have to take someone elses word for it.
It's also a great way to help you come up with a posting structure that may help you streamline your content creation in the future.
#1: View Insights for Ideas
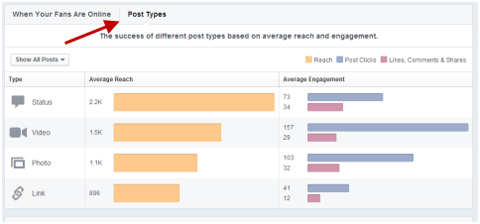
In your Insights section, you do have some data on your best post types (under Posts), but that can be a function of what types of content you have been posting lately. So you may not get the whole picture if you haven't been posting many links recently. But it's a good place to start your investigation.
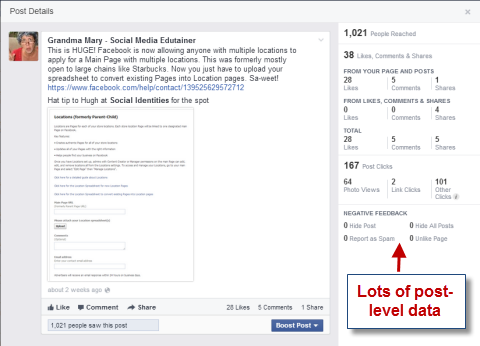
Another good place to start is to look at the Posts section and click on one of the posts. You will get a lot of information on your individual posts. The example shown here is a photo tip, which typically does very well on my page.
What I wanted to see is how posts did in a more controlled experiment. If I posted similar information with a link or a text post, would it do as well? Here's an idea of how you can set up an experiment on your own page to do a little investigation.
#2: Set Up Your Experiment
Start with an outline of types of posts that you want to test and length of time. I ran two different time periods to test the number of posts per day. The longer your testing period, the better your results. But for the purpose of this post, I chose to run my test this way:
Length: Posting 5 times per day for 3 days
Types of Posts: Text, link, photo
Get World-Class Marketing Training — All Year Long!
Are you facing doubt, uncertainty, or overwhelm? The Social Media Marketing Society can help.
Each month, you’ll receive training from trusted marketing experts, covering everything from AI to organic social marketing. When you join, you’ll also get immediate access to:
- A library of 100+ marketing trainings
- A community of like-minded marketers
- Monthly online community meetups
- Relevant news and trends updates
Post times and formats:
- 6 am: Informative post with a link and a tag of another Facebook page (text post would remove the link preview, photo post would have the link in the status area)
- 9 am: Tip (link post would include a link to the tip, photo post would include a photographic representation of the tip)
- Noon: Longer post (more text, but also would include a photo or link if needed)
- 3 pm: Question
- 6 pm: Humorous post
For the second experiment I posted 3 times a day with slightly later times: 10 am, 1 pm and 7 pm.
If you're going to be a purist about this testing, you would post the same information each time and vary the post type each time. But that might not be so fun for your fans.

Discover Proven Marketing Strategies and Tips
Want to go even deeper with your marketing? Check out the Social Media Marketing Podcast! Publishing weekly since 2012, the Social Media Marketing Podcast helps you navigate the constantly changing marketing jungle, with expert interviews from marketing pros.
But don’t let the name fool you. This show is about a lot more than just social media marketing. With over 600 episodes and millions of downloads each year, this show has been a trusted source for marketers for well over a decade.
Once you've done your posts, you should wait a day to allow for all the results and then you can start assembling your data.
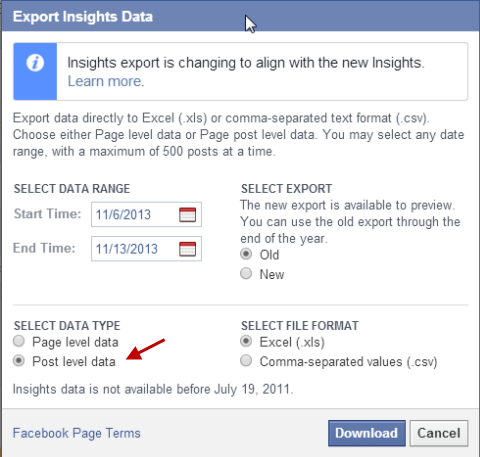
First, download your post-level data in your Facebook Insights area. Click Export Data, then select your date range and make sure you've selected the Post-level data button.
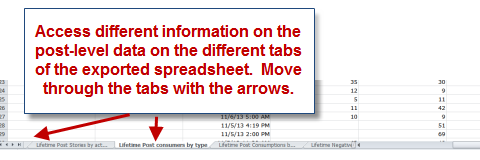
Now you're going to need to gather the data on four different tabs of the Excel spreadsheet.
#3: Gather the Data
I wanted to know about comments, likes and shares, as well as the clicks, reach and hides for each post. I found that information on each of these tabs within the spreadsheet:
- Lifetime Talking About This: Comments, likes and shares
- Key Metrics: Reach
- Lifetime Post Consumers by Type: Clicks
- Lifetime Negative Feedback: Hides and unlikes
One thing to note on the Lifetime Post Consumers by Type is that you'll see Link Clicks, Other Clicks and Photo Views. The Other Clicks incorporate when someone clicks anywhere on the post that isn't the photo or the link—they may click on the headline, the text in the status area or on a See More link if you have a long post.
And a note on the Lifetime Negative Feedback: You'll have a column for Unlikes of Your Page and the “xbutton_clicks”, which is the Hide button. I take the sum of these columns since they have a similar effect—the person is not consuming your content in the news feed anymore.
Now put these statistics into one spreadsheet so you can compare.
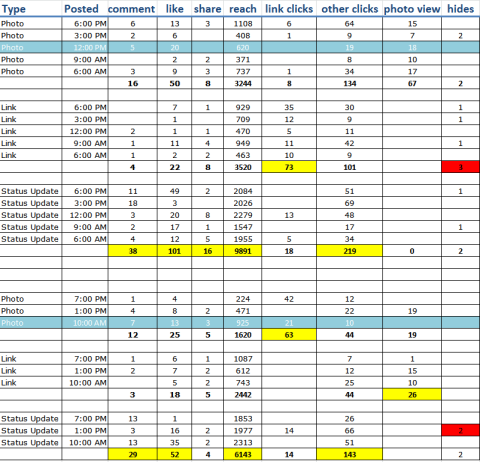
Sum up the days of data so that you can see what type of post “won” the day. Highlight the winners for each day. Obviously in terms of reach, you may be seeing the same people for each post, but it still equates to potential eyeballs on your posts.
#4: Draw Some Conclusions
From this data, you may see patterns. One thing that's obvious is that the status updates are the best at comments, likes, reach and other clicks for the two posting schedules. So I need to keep that in mind when doing my posting. But I did see that the link posts did OK in the reach for their posting schedules. I'm not sure how the link posts got photo views in the second round of testing so that was unusual.
The other thing you can do is compare the time slots between the posts and see if a certain type of post does better in one time slot. I noticed that the midday photo posts seemed to perform well compared to the other times during the day that I posted photos. After running this experiment, I might make sure my midday post has a photo.
Final Thoughts
By doing more controlled experiments, you can also find out what works best for your page. I would recommend using more data and trying different types of posts—maybe add a video post or test some different tagging strategies.
In any case, it was a fun exercise and I felt like I learned a few new things. I also confirmed my thoughts about the status updates getting a little bit more engagement and reach.
What do you think? What types of experiments have you tried running on your page? How did they turn out? Share your thoughts with us in the comments below!
Attention Agency Owners, Brand Marketers, and Consultants

Introducing the Marketing Agency Show–our newest podcast designed to explore the struggles of agency marketers.
Join show host and agency owner, Brooke Sellas, as she interviews agency marketers and digs deep into their biggest challenges. Explore topics like navigating rough economic times, leveraging AI, service diversification, client acquisition, and much more.
Just pull up your favorite podcast app, search for Marketing Agency Show and start listening. Or click the button below for more information.
