 Are you using Instagram Stories in your marketing?
Wondering where to find metrics and key performance indicators (KPIs) for Instagram Stories?
In this article, you'll discover how to use Instagram Insights for Stories.
Why Track KPIs on Instagram Stories?
Stories have become an integral part of the Instagram experience. In fact, out of 800 million active Instagram users, about 300 million are daily Stories users as well. As such, it's no surprise that brands and businesses are also making use of Stories.
Because stories are instant and ephemeral (unless you're using Highlights), it may seem that setting KPIs for measurement is unnecessary. However, if you're investing your time and effort in stories, you need to have a clear idea of how to measure their performance.
Here are four KPIs to help you gauge the effectiveness of your Instagram stories using the Insights on your Instagram business profile.
#1: Reach and Impressions
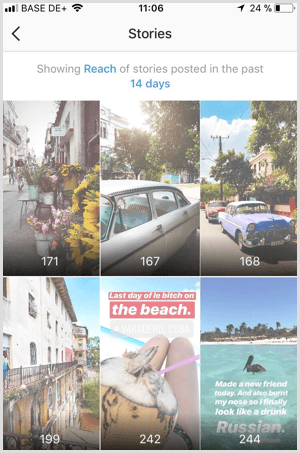
These two metrics will help you estimate the size of your stories' audience. Typically, more people will watch your stories more often than they like your pictures.
What's the difference between reach and impressions? Reach is the number of actual people who have seen the story, while Impressions is the number of times your story has been viewed. So if you posted a story and reached one person who viewed your story five times, Insights would show one reach and five impressions.
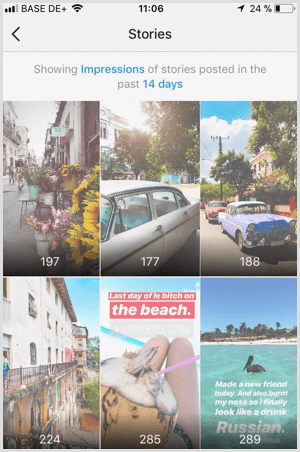
This is why stories normally have higher impressions and lower reach numbers.
How high should your reach rate be? While this depends on the size and engagement of your audience, the more followers you have, the lower your stories' reach rate will be. This rule of thumb applies to most metrics on Instagram: the more followers you have, the lower your engagement rate, your reach rate, and so on.
For instance, I have approximately 3.2K followers on my personal Instagram account and my engagement rate is 8.57% per photo. Kim Kardashian has approximately 108.5M followers and her engagement rate is 1.97%.
Which AI Moves Actually Matter?
That's what every marketer is wrestling with now. New AI strategies, new tools, new takes every week — but no clarity. Most marketers and business owners are trying to figure out AI alone.The AI Business Society is your trusted guide. Get expert-led training you can put to work immediately. Plus a community of marketers sharing what's actually working.
I'M READY FOR REAL AI RESULTSHow Can You Use These Metrics?
If you see a drop in reach, take a look at the frequency of your story publication to be sure you post stories on a pre-determined schedule each day or week. You'll also want to capitalize on the use of geotags and hashtags, and tag a featured user's username in your stories when appropriate.
If you see a drop in impressions, consider the quality of your stories. If your stories are blurry or bouncy, you may need to upgrade and improve the production so they're easier to watch. You'll also want to make an effort to publish stories that give users a reason to view each one repeatedly. Include elements of humor, surprise, or insider perspectives.
#2: Story Features
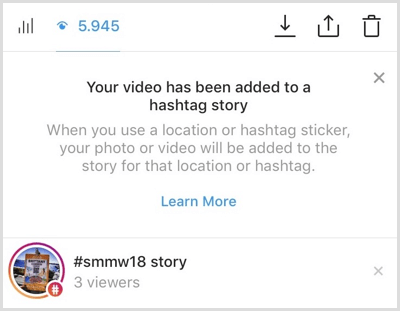
Using geolocation stickers or hashtag stickers in your stories can do more than increase reach that's tracked via Reach and Impressions. Using these elements can also help you get featured in the story for a particular location or hashtag.
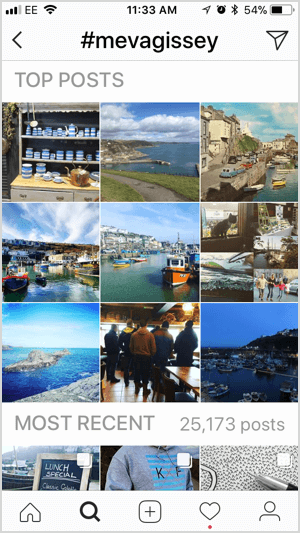
Where can you see this metric? If your story got featured, you'll see a message like the one below in that story's analytics.
How Can You Use This Metric?
If your story does get featured, track the number of additional viewers you acquire. Take note of the number of new viewers each hashtag or sticker brings in, and then use the best-performing element in posts designed to reach new audiences.
#3: Taps Back, Taps Forward, and Exit Rate
Taps are interesting, albeit a bit ambiguous, metrics that leave the quality of your content open to interpretation. However, you can get some clarity from your analysis by looking at the exit rate.
Taps Forward is the number of taps users made to see the next photo or video in your story, while Taps Back is the number of taps users made to see the previous photo or video in your story.
3 Days of World-Class Training—Zero Travel!

Couldn't make it to Social Media Marketing World and AI Business World this year? Get all of the great content at a fraction of the price with a Virtual ticket.
That’s full access to recordings of every keynote, workshop, and session—the ones people travel thousands of miles to see. Don't wait. Get your Virtual ticket and enjoy actionable content that you can watch anytime, anywhere.
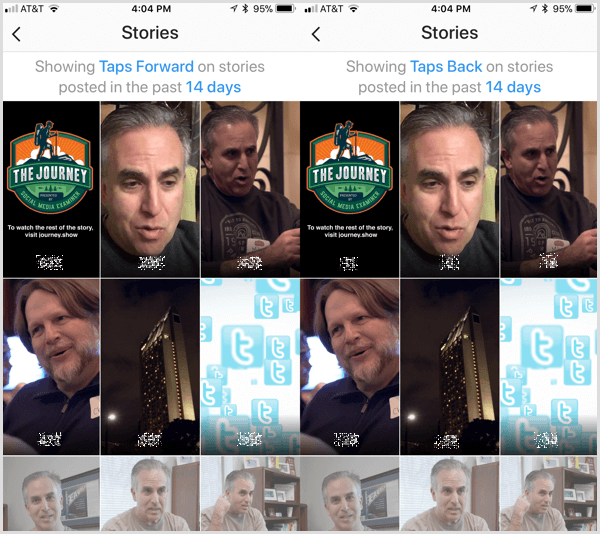
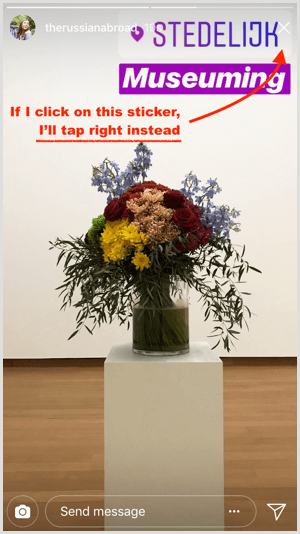
A high number of taps forward isn't ideal. Use this as a warning sign that your story wasn't interesting, was too long, or wasn't cropped properly. A high number of taps forward could also mean that the composition of your story is off. For example, placing stickers or calls to action (CTAs) too close to the right side of the screen could lead to false taps forward.
A high number of taps back is a better KPI, signaling that people liked the story enough to re-watch it or that the story almost came to an end, so they quickly tapped back and then tapped forward to watch it again.
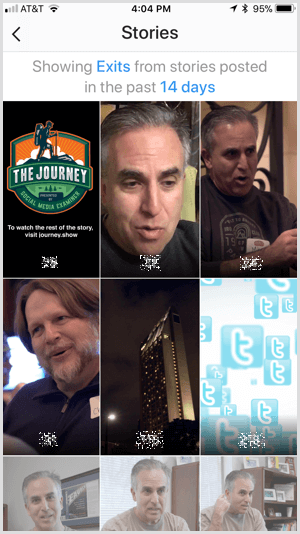
Exits, or ‘swipes away' as Instagram itself calls the metric, tell you whether users watched your story to completion or if they exited before the story ended. Exits happen when:
- Users swiped left (not tapped back or forward) to move to another user's story.
- Users closed Instagram while viewing your story.
- Users have clicked on the X on the top-right corner of your story.
- Users have swiped down the media, thus going back to the main feed.
How Can You Use These Metrics?
To accurately analyze taps and exits, it's important to deliver a sequence of coherent stories rather than a series of sporadic singular stories. Use taps to discover which types of media are most interesting to your audience. The fewer exits you get, the better. If you see a rise in exits, add elements that make your stories more interactive.
#4: Actions on Location and Hashtag Stickers
Aside from boosting your reach rate, a hashtag sticker can also show how successful you are at engaging your audience and driving traffic. While Instagram doesn't let you track clicks on actual user handles, Insights does show you the number of taps on stickers, making it easier to evaluate their performance in stories.
How Can You Use This Metric?
Track the clicks on every sticker you add to stories to see which are most effective at generating the engagement you're after.
Bonus KPI: Clicks on Links for Traffic
There's one KPI that currently isn't tracked using Instagram Insights. However, I have tips for where you can find this metric to measure its performance.
Users can't convert directly on Instagram. Outside of shoppable posts, another option is to use links to drive viewers to your site where you can convert them. For most account holders, the only space to place links on Instagram is in your bio. However, if your account has over 10,000 followers, you can add URLs to your stories, too.
Users watching your story will then be able to tap the See More CTA at the bottom of your media and get redirected to your special offer, an article, a website, or whatever you choose to promote.
To illustrate, here's how @gretastravels uses multiple story features to draw attention to the link and encourage people to swipe up:

Where Can You See This Metric?
For the moment, you can find this metric only in good old Google Analytics. Start by using UTMs to differentiate the URLs you promote on Instagram.
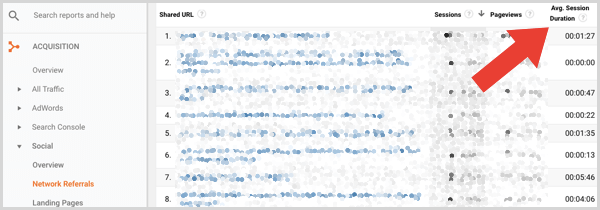
Then in Google Analytics, go to Acquisition > Social > Network Referrals to see all of the traffic coming to you from Instagram. Then click Instagram to see the traffic from unique URLs.
What Can You Do With This Metric?
Use this metric to accurately assess how well the links and stories you're combining are driving traffic to a channel off of Instagram.
Begin by composing a sequence of media to create a narrative in your story. It's easy to do that on Instagram now with all the GIFs, fonts, arrow lines, and emojis available. These elements allow you to reuse the same media, but turn them into an interactive storyline.
If your story generates a healthy number of clicks but session duration (which the red arrow is pointing to in the image above) or conversions are low, that may be a cue that the landing page of your offer is misaligned with your story message. Evaluate the presentation of the landing page and make any tweaks you think might boost sales or time on page.
Conclusion
Using Instagram Stories is great for interacting and engaging your audience, but it's important to work from a defined objective and a carefully laid-out plan that includes KPIs.
Use the tips above to make adjustments to your own stories and improve the return on your efforts.
What do you think? What other Instagram Stories KPIs do you track? How do you use the data? Share your thoughts in the comments below!

Curious About How to Use AI?
Our newest show, AI Explored, might be just what you're looking for. It's for marketers, creators, and entrepreneurs who want to understand how to use AI in their business.
It's hosted by Michael Stelzner and explores this exciting new frontier in easy-to-understand terms.
Pull up your favorite podcast app and search for AI Explored. Or click the button below for more information.
