Are your Facebook ads working for you? Wondering which metrics you should be tracking?
In this article, you'll discover nine ways to analyze and assess the performance of your Instagram and Facebook ad campaigns.
#1: Assess Awareness
When you're running social media ad campaigns, it's interesting to see how many people are viewing your content. You can measure this by looking at two key performance indicators (KPIs):
- Reach: The number of people who saw your content. For example, if your Instagram ad was shown to 100 Instagram users, your reach would be 100.
- Impressions: The number of times people saw your content, even if the same person saw the ad multiple times. If your ad was shown to 100 people who each viewed it twice, you'd have 200 impressions.
The importance of these metrics varies depending on your campaign type and goals. A campaign optimized for link clicks, for instance, won't necessarily need to measure awareness but one optimized for awareness would.
One thing to always review is the ratio of impressions to reach. If the reach is 1,000 and your content received 10,000 impressions, each person within your audience group saw your ad about 10 times on average.
Showing the same ad to people multiple times might cause ad fatigue or annoy your audience, leading them to click Hide Ad and mark the ad as repetitive. In turn, your ad's relevance score will decrease, leading to a higher CPC and CPM.
In a nutshell, your entire campaign will become much more expensive because the algorithm thinks your ad isn't relevant, and you should therefore pay more to reach that audience.
#2: Evaluate Engagement
Engagement relates to any metric that reveals a person has interacted with your post, such as:
- Likes
- Shares
- Comments
- Clicks
The importance of these metrics will vary depending on the campaign type.
For example, a campaign optimized for conversions should focus more on monetary metrics but a campaign optimized for reach would prioritize these engagement KPIs. Why? Because likes and shares can increase the organic reach of the ad post.
High engagement rates signal to social advertising algorithms that your content is engaging, giving those platforms a greater reason to display the ad to your audience.

Remember, social media platforms want to make sure users have a great experience on their site. Displaying low-quality ads won't achieve that but ads with high engagement rates are more likely to fit the “great experience” bill.
#3: Monitor the Click-Through Rate
The click-through rate (CTR) of your social media campaigns is the percentage of people who click your link after viewing the ad. As a reference point, the average CTR for a Facebook ad is 0.9%, compared to 1.51% for a Twitter ad, and 0.26% for a LinkedIn ad.
Get World-Class Marketing Training — All Year Long!
Are you facing doubt, uncertainty, or overwhelm? The Social Media Marketing Society can help.
Each month, you’ll receive training from trusted marketing experts, covering everything from AI to organic social marketing. When you join, you’ll also get immediate access to:
- A library of 100+ marketing trainings
- A community of like-minded marketers
- Monthly online community meetups
- Relevant news and trends updates
The CTR for your paid social campaigns is important because it's an indicator of ad quality. The more people who view your ad and click the link, the more relevant and engaging the ad is.
Plus, in campaigns where you pay for impressions, a high CTR is often a budget-saver.
Let's look at an example. Suppose you launch an ad campaign where you pay $1 per click and get 30 clicks from 1,000 impressions. The total cost for your entire campaign is $30.
But when you launch a campaign and pay $20 per 1,000 impressions and achieve a CTR as high as 5%, you'll get 50 clicks in total. Not only do you pay less for 50 clicks, but you also get more engagement with your ad for fewer marketing dollars.
#4: Track the Number of Referrals From Social Media
Tracking website traffic is important for any marketer. But when you're running social media ad campaigns, it's critical to dive deeper into your on-site analytics, starting with the number of referrals you're getting from each channel.
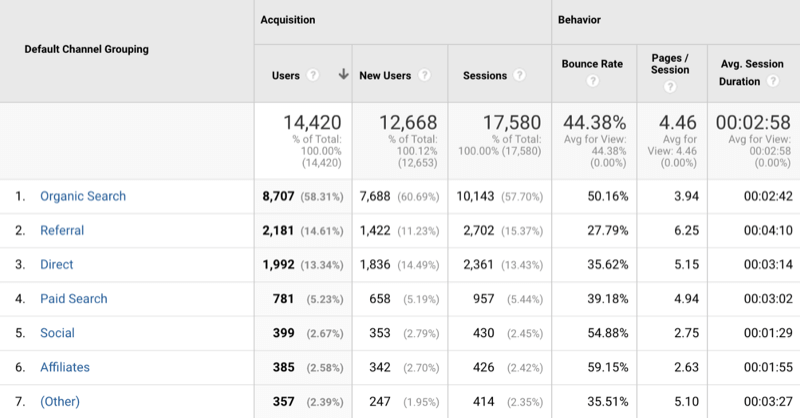
Sometimes, the number of clicks to a social media ad or post is different from the number of people who actually visited the website.
Let's say you're promoting a post on Facebook, and someone clicks the link in your ad but exits the browser tab as soon as they click it. Facebook considers it a click. However, your website analytics don't fire up because the page hasn't loaded. These discrepancies might mean your advertising platform shows more traffic than you actually get.
However, verifying the number of referrals you've received from each social media channel in Google Analytics can be a great workaround, especially if you're using UTM parameters to get more granular with your tracking.
#5: Check the Bounce Rate
You've checked your analytics and found that you're getting some traffic from the social media channels you're using to promote your website. Now you need to think about what happens after people click the Visit Website button. Do they spend time on your site and engage with other pages? Or do they click the exit button after spending a few seconds on your site?
If it's the latter, your bounce rate will be high. A large percentage of people visiting your website through social media are viewing just one page and leaving afterward.
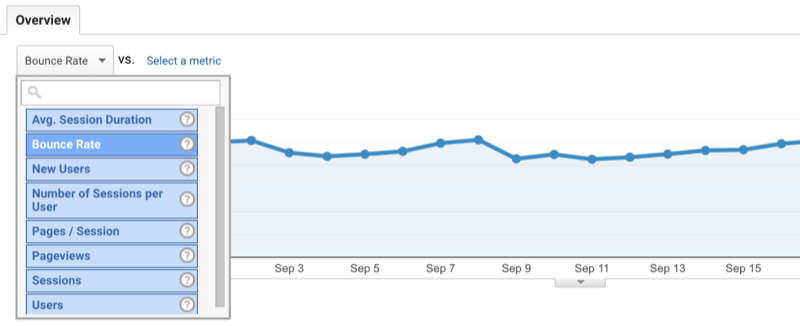
Tracking your bounce rate will give you an idea of the type of content you should be sharing on social media.
Suppose your blog post “How to Create an App” has a 10% bounce rate, whereas the post “The Technical Guide to Creating an App Integration” has a 90% bounce rate. This significant difference in bounce rates might be a sign that the people you're targeting are likely more interested in beginner-level content and aren't ready to be bombarded with technical jargon.
A high bounce rate isn't just a problem for your social media department, though; it impacts your overall marketing team as well. That's because the bounce rate could have a knock-on effect on SEO, where Google thinks a website with low time on site isn't relevant or high-quality—two factors that search engines look for when ranking content in search.
#6: Monitor the Conversion Rate
Ask any social media marketer what their most important metric is, and I'll bet “conversion rate” is the most common answer. It's the percentage of website visitors who turn into paying customers.
Conversion rate is one of the most important metrics for a reason. No matter what campaign type you launch, your goal is to get more conversions. In the long run, you count on it to pay off with more conversions from future campaigns.
There are several tools you can use to track the conversion rate of your paid social media campaigns, including:

Discover Proven Marketing Strategies and Tips
Want to go even deeper with your marketing? Check out the Social Media Marketing Podcast! Publishing weekly since 2012, the Social Media Marketing Podcast helps you navigate the constantly changing marketing jungle, with expert interviews from marketing pros.
But don’t let the name fool you. This show is about a lot more than just social media marketing. With over 600 episodes and millions of downloads each year, this show has been a trusted source for marketers for well over a decade.
- Your advertising platform
- Your website's analytics
But once you've found your conversion rate, it's interesting to know how many visitors from social media end up on your customer list.
According to Heap's research, the average conversion rate for Facebook is around 4.7%, beating other platforms like Instagram, Twitter, Pinterest, and Snapchat.
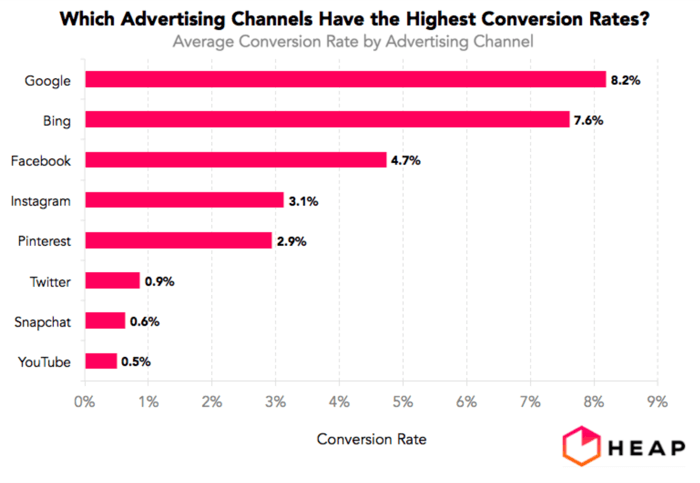
Again, it's worth split-testing which social media ad copy and visuals generate the best conversion rate. You might find that including the word “now” creates a sense of urgency, which therefore boosts conversions. But you won't know unless you test it.
Once you've found your conversion rate, you'll be able to see how many people turned into customers after viewing your social media posts.
#7: Calculate the Cost Per Conversion
Another metric you should track is the cost of each of those conversions, which will help you judge whether it's sustainable for you to continue advertising on that social platform—and more importantly, generate a return on your investment.
You can calculate your cost per conversion by dividing the total amount spent by the total number of conversions. If you spend $100 to acquire five new customers, your cost per conversion is $20.
To take this analysis a step further, calculate your average revenue per user (ARPU). If you know that your customer brings in $500 over the course of their life, a $20 upfront acquisition cost is nothing.
But if your cost per conversion is higher than the $5 lifetime revenue you'll generate from a customer who costs $20 to acquire, there's no point in running those ads.
#8: Reveal the Number of Assisted Conversions
Some forms of marketing are notoriously difficult to track. Social media is one of those because although it doesn't always bring direct conversions, it quite often assists in converting from other channels. For example, someone may click an ad, go to your website, then leave; do some additional research; and finally convert.
Social media marketers are often confused by the discrepancies in their conversions reports from the ad platform and their analytics account. This is usually because social media platforms use first-touch attribution (meaning the visitor first arrived on the website from social media) and therefore credit their ad for the conversion.
However, Google Analytics tends to use a last-touch attribution model, which means that although the visitor clicked the ad to begin with, they returned to the website via organic search when they made their purchase. In this case, SEO is credited with the sale.
You can find instances where social media assisted (but wasn't officially credited) with a conversion using the Assisted Conversions report in Google Analytics.
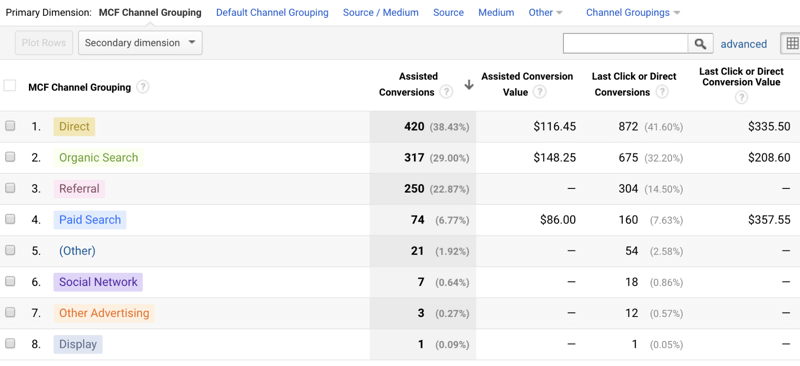
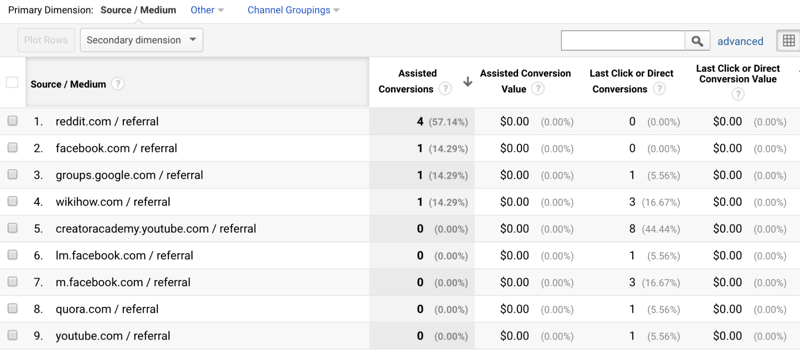
Here, you'll find the pathways customers used to make a purchase. If you can spot the Social Network account for a large volume of assisted conversions, click the tab to dive deeper and analyze which platforms were most successful.
#9: Determine the Return on Investment
The return on investment (ROI) of your social ad campaign tells you whether you're making money in return for the cash you're spending. If you spend $100 on advertising and generate $250 in sales as a result of the campaigns, your ROI would be 150%. (This can also be referred to as return on ad spend or ROAS.)
You don't need to calculate this metric manually, though. The majority of social advertising platforms have a column to show your campaign's ROI throughout its duration.
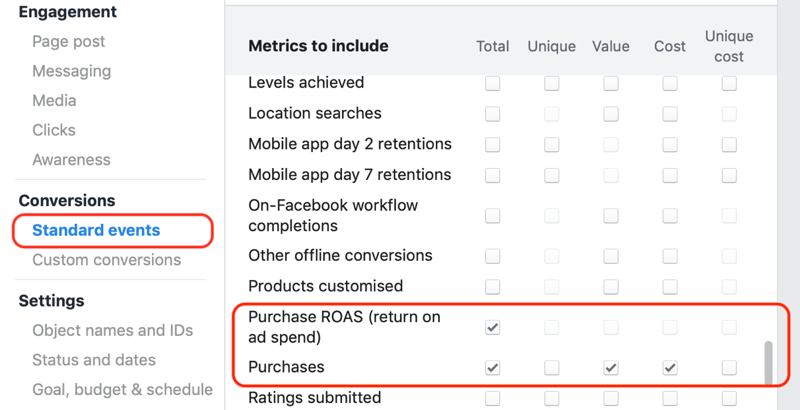
If your ROI percentage is positive, great news! You're making more money than you're spending, and advertising on that channel is paying off.
However, if your ROI is negative, you're sinking cash into a campaign that isn't sustainable. In a nutshell, you're wasting money. So you'll need to reconsider your ads by:
- Editing the ad itself (visuals and copy)
- Changing the audience targeting
- Switching the campaign's objective
Remember to turn off the campaign while you make these changes. It's unlikely that your ROI will magically improve before making any edits so avoid wasting more cash on an underperforming campaign by pausing it as soon as a negative ROI creeps in.
Bonus: Breakdown by Placement, Device, Age, and Gender
You've got a list of metrics you need to track while running your campaigns. To take those a step further and gain more insight into your campaign's success, break down your campaigns by:
- Placement: Do Facebook ads shown in the news feed have a better engagement rate than those shown in the right-hand column?
- Device: Are people using a mobile device more likely to convert?
- Age and Gender: Do people ages 18-25 generate a higher CTR than the 60+ demographic?
- Time of day: Are people more likely to click a link from their Instagram feed in the morning, afternoon, or evening?
If you know which placements, devices, and demographics convert best, you can exclude non-converting elements from future campaigns or split your budget to favor the best-performing ones.
For instance, if you know women convert at a higher rate than men, create an ad set targeting each and place more budget into the one targeting women.
Regardless of the trends you find, knowing more about your ads will help narrow the targeting in future campaigns for better results at a lower cost.
Conclusion
As you can see, monitoring your social media ad performance goes beyond checking the ROI every so often. Sure, the awareness you're generating and the conversions you're winning are important—but so are other metrics such as bounce rate and CTR that help you predict and improve performance.
Keeping a close eye on these metrics will help you stop any campaigns that could be losing money and move forward with the ones having an impact on your bottom line.
What do you think? Which of these metrics do you follow closely to gauge the effectiveness of your social media ad campaigns? Share your thoughts in the comments below.
More articles on social media ads:
- Find seven tips to take the performance of your next Facebook ad campaign to a higher level.
- Learn how to create Instagram ads that work.
- Discover how to create objective-based ads using LinkedIn Campaign Manager.
Attention Agency Owners, Brand Marketers, and Consultants

Introducing the Marketing Agency Show–our newest podcast designed to explore the struggles of agency marketers.
Join show host and agency owner, Brooke Sellas, as she interviews agency marketers and digs deep into their biggest challenges. Explore topics like navigating rough economic times, leveraging AI, service diversification, client acquisition, and much more.
Just pull up your favorite podcast app, search for Marketing Agency Show and start listening. Or click the button below for more information.

