Have you noticed a change in Facebook ad relevance scores? Wondering what the three new Facebook ad relevance diagnostics tell you?
In this article, you’ll learn how to use Facebook ad relevance diagnostics to improve your advertising campaigns.
What Changed With Facebook Ad Relevance Metrics?
Facebook's relevance score is an assessment based on how well your ad is resonating with the audience you're serving it to. Each ad is rated on a scale of 1–10, with 1 being not very relevant and 10 being very relevant to your audience. Ads receive a relevance score when they've generated more than 500 impressions.
The problem with this metric is that it doesn't give you much direction on how to improve a low score. A low score doesn't tell you if the problem is the ad itself, the audience targeting, or the conversion you're bidding for. There's also a perception that ads with low relevance scores don't get results, which isn't the case. Ads with low relevance scores can still get results; however, a low score may mean there's room to improve your results.
To help you better assess your ad performance and give you more direction on where to make improvements, Facebook is replacing the relevance score with three ad relevance diagnostics. These metrics assess the quality of the ad, the engagement the ad is receiving, and the ad's expected conversion rate compared to ads competing for the same audience.
For each of the ad relevance diagnostics, your ads will receive a ranking of Below Average, Average, or Above Average, rather than a single estimate between 1 and 10.
With the shift from the relevance score to a ranking of how your ads compare to ads competing for the same audience, you can better identify which parts of your ad campaigns need improvement. For instance, a Below Average quality ranking for your ad is a cue to improve the quality of your ad creative or change the audience targeting for that ad to an audience that will better respond to it.
What if you have a Below Average engagement rate ranking? Your ad is reaching the right people but it may not be compelling or exciting enough to make your audience stop to interact with it. In this case, consider ways to make your ad more eye-catching, or align that ad with an audience that will find it interesting.
If your conversion rate ranking is Below Average, look at your post-click experience to see if you can make improvements to the customer journey. Keep in mind that conversions may be lower than average but still producing your desired results.
#1: Find Facebook Ad Relevance Diagnostics in Ads Manager
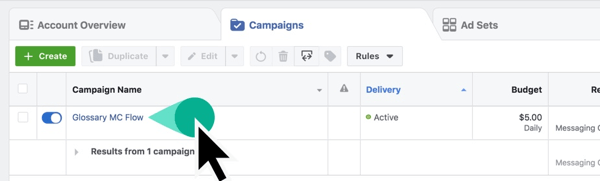
The Facebook ad relevance diagnostics apply only to ads, not to campaigns or ad sets. To access this data, open Ads Manager and click on the campaign you want to examine.
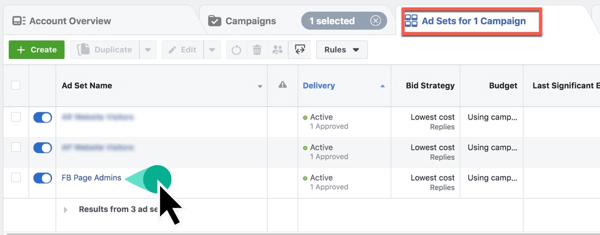
Next, choose the ad set that contains the ads you want to look at.
Which AI Moves Actually Matter?
That's what every marketer is wrestling with now. New AI strategies, new tools, new takes every week — but no clarity. Most marketers and business owners are trying to figure out AI alone.The AI Business Society is your trusted guide. Get expert-led training you can put to work immediately. Plus a community of marketers sharing what's actually working.
I'M READY FOR REAL AI RESULTSNow at the ad level, scroll to the right to see additional columns.
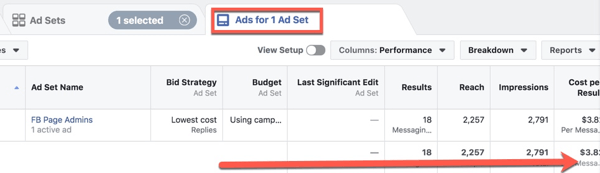
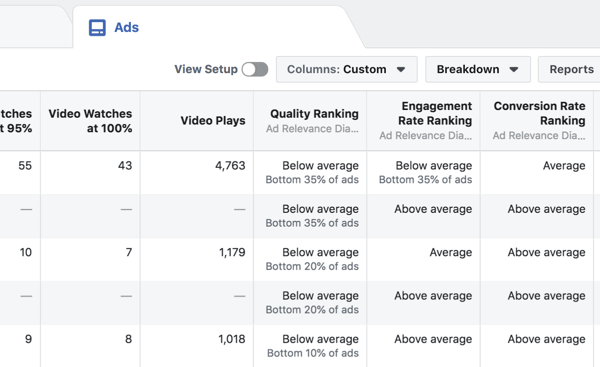
The default columns view in Ads Manager contains the three relevance diagnostics: quality ranking, engagement rate ranking, and conversion rate ranking. If your ad has received more than 500 impressions, Facebook will give you a ranking of Below Average, Average, or Above Average for each of the three metrics.
Keep in mind that ad relevance diagnostics are gradually rolling out to all Facebook advertising accounts. If you don't yet have access, you'll see a relevance score instead.
Add Facebook Ad Relevance Diagnostics to Custom Ads Manager Reports
You may want to see the ad relevance diagnostics alongside other reporting presets. By default, these metrics are available in the Performance preset. However, you can also choose a different preset and customize your columns to include Quality Ranking, Engagement Rate Ranking, and Conversion Rate Ranking.
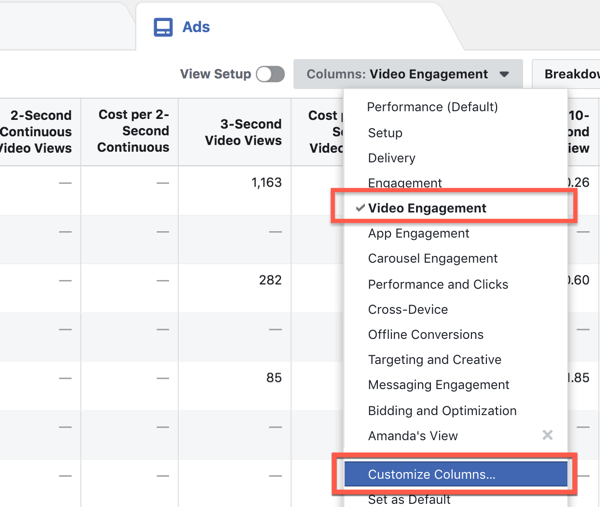
From the Ads view, choose an alternate Columns preset from the drop-down menu. In this example, I selected the Video Engagement preset. After you choose your preset, choose Customize Columns.
In the Customize Columns window, check the boxes for Quality Ranking, Engagement Rate Ranking, and Conversion Rate Ranking in the Performance section.
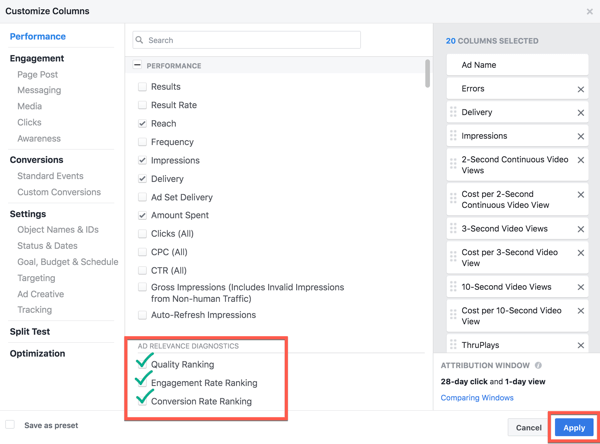
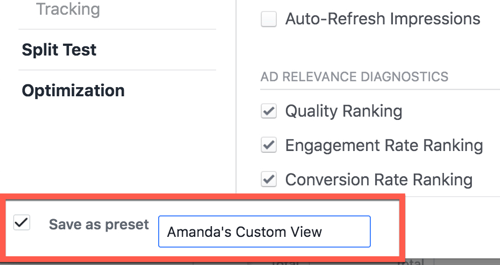
If you want to save your customized column view, select the Save As Preset check box in the lower-left corner of the window. Then give your custom view a name. When you're done, click the Apply button in the lower-right corner to confirm the change.
Your new saved view will appear in the Columns drop-down menu.
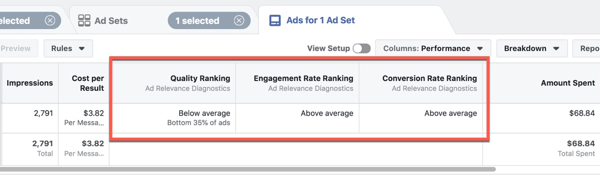
Now scroll to the end of your report and you'll see the ad relevance diagnostics metrics for ads with more than 500 impressions.
#2: Explore the Facebook Ad Relevance Diagnostics
Here's a closer look at the three new ad relevance diagnostics rankings.
3 Days of World-Class Training—Zero Travel!

Couldn't make it to Social Media Marketing World and AI Business World this year? Get all of the great content at a fraction of the price with a Virtual ticket.
That’s full access to recordings of every keynote, workshop, and session—the ones people travel thousands of miles to see. Don't wait. Get your Virtual ticket and enjoy actionable content that you can watch anytime, anywhere.
Quality Ranking
Facebook's quality ranking is an assessment of your ad's perceived quality. It's measured using feedback received on your ads and the post-click experience. Your ad is ranked against ads that competed for the same audience.
Ad quality takes into account how impactful and eye-catching your images/videos are and how compelling the ad copy (text), headlines, and call to action (CTA) are.
To illustrate, a Facebook ad targeted to residents of Toronto may be considered higher quality if the ad photo shows the iconic CN Tower rather than a generic city skyline. The CN Tower image makes the ad instantly more relevant to the audience it's being served to.

Engagement Rate Ranking
Facebook's engagement rate ranking measures your ad's expected engagement rate. Your ad is ranked against ads that competed for the same audience. Engagement includes all of the likes, reactions, comments, shares, and clicks (including link clicks and clicks anywhere else on the ad). Ads that spur conversation in the comments from more than one user are an indication of higher engagement than ads with several likes but no comments.
Conversion Rate Ranking
The conversion rate ranking is an assessment of your ad's expected conversion rate. Your ad is ranked against ads with the same optimization goal and competing for the same audience. Conversions are the desired action for which you're optimizing your campaign. To visualize this, if you're optimizing your campaign for purchase conversions, an ad compelling more people to complete the purchase instead of abandoning the site at the checkout page will rank higher.
#3: How to Use Facebook Ad Relevance Diagnostics to Improve Your Facebook Ads
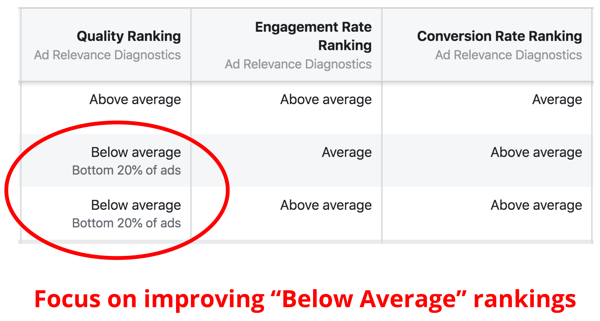
Now let's look at how to use these diagnostics to improve your ads. For the most impact, Facebook recommends that you work on improving low rankings rather than trying to achieve perfection:
“It's more impactful to move a ranking from low to average than it is to move a ranking from average to above average, so focus on improving low rankings rather than on improving average rankings.”
In other words, your ads just need to be good enough relative to the audience they're competing for.
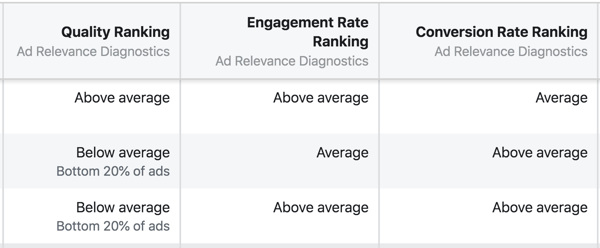
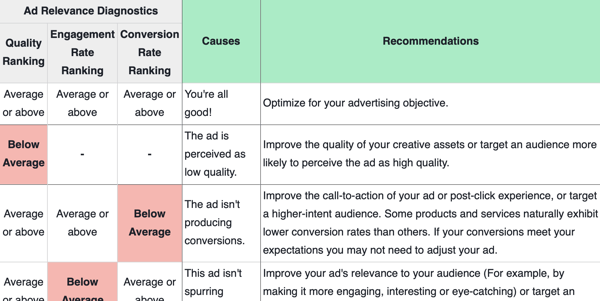
Facebook provides a detailed chart with recommendations (as shown below) to help you diagnose and improve your ads based on the ad relevance diagnostics rankings they received.
For instance, if your ad received a quality ranking of Below Average, but the engagement rate and conversion rate rankings are Average or Above Average, these assessments suggest the ad itself isn't resonating as well as it could with your target audience and chosen objective. To make improvements in this scenario, Facebook recommends that you tweak your ad image or copy.
If your ad received an engagement rate ranking of Below Average, but the quality and conversion rate rankings are Average or Above Average, look for ways to make your ad more appealing or eye-catching to your target audience, or redefine your targeting to reach an audience that's more likely to engage with your ad.
If the conversion rate ranking of your ad is Below Average, but the quality and engagement rate rankings are Average or Above Average, Facebook suggests focusing on improving the ad's CTA or post-click experience, or adjusting your targeting.
Access Your Original Relevance Score in Ads Manager
For Facebook advertisers who have regularly used the relevance score metric, switching to the three ad relevance diagnostics can be an adjustment. And some advertisers may prefer to use all of the relevance metrics together.
The traditional relevance score metric is still available, but it's not part of Ads Manager's default reporting view. You need to customize the columns to add it to your reports. To do this, open the Ads tab in Ads Manager, click the Columns drop-down menu, and choose the Customize Columns option.
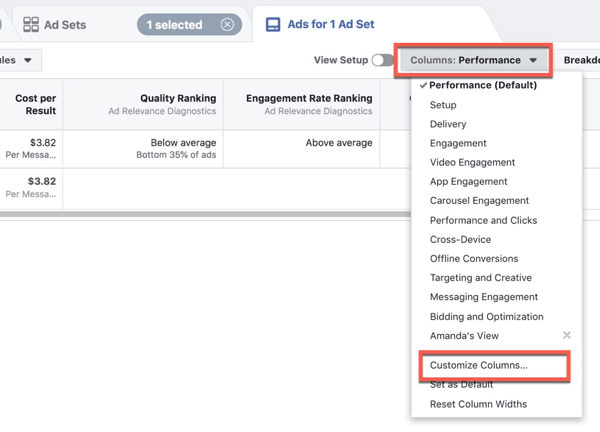
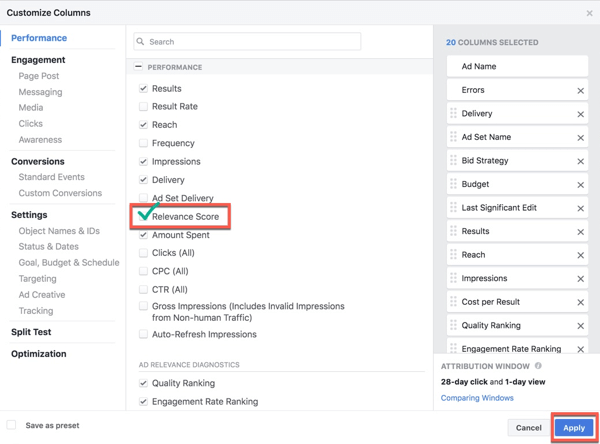
In the Customize Columns window that opens, select the Relevance Score checkbox under Performance. Then click the Apply button in the lower-right corner to confirm and save this change.
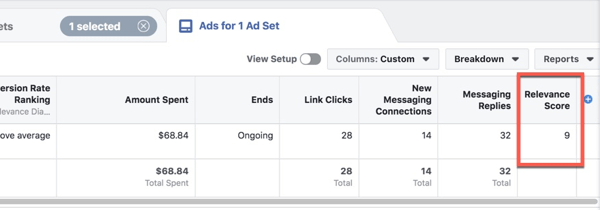
Now scroll to the far right of your columns to see the Relevance Score column. Remember that you need more than 500 impressions to receive a relevance score on your ads, and this metric is available only on the Ads tab, not on the Campaign or Ad Sets tabs.
Conclusion
The Facebook ad relevance diagnostics will give you a more granular look at where bottlenecks may be occurring in your ad campaigns. This data helps you understand how your ads are performing compared to ads that are competing for the same audience. If your ads aren't performing as expected, you'll know where to focus on making improvements to achieve the best possible ad costs and results.
Keep in mind that the relevance diagnostics rankings are estimates, so use them only as a guide. They can be very useful in helping you improve the overall quality of your ads for the audiences you're serving them to.
What do you think? How will the Facebook ad relevance diagnostics help you improve your campaigns? Will you still look at the traditional relevance score? Share your thoughts in the comments below.
More articles on Facebook ads:
- Find four ways to generate clicks, leads, and conversions using Facebook ads.
- Discover the most common mistakes made with Facebook ads and how to resolve them from top Facebook advertising experts.
- Learn how to use Facebook's automated rules to save time managing Facebook ad performance.

Curious About How to Use AI?
Our newest show, AI Explored, might be just what you're looking for. It's for marketers, creators, and entrepreneurs who want to understand how to use AI in their business.
It's hosted by Michael Stelzner and explores this exciting new frontier in easy-to-understand terms.
Pull up your favorite podcast app and search for AI Explored. Or click the button below for more information.
