Overwhelmed by all of the metrics inside Facebook Ads Manager? Wondering which ones to focus on?
In this article, you'll find 10 important metrics to use when analyzing your Facebook ads. Plus, you'll discover how to track them with a custom report.
Tracking Facebook Ads Metrics in a Custom Report
When it comes to Facebook ad metrics, you can broadly categorize them into two buckets: default and custom. The default metrics already exist in Ads Manager and you simply select them when creating your custom report. Custom metrics, on the other hand, are those you create using different formulas to display data that isn't available as standard in your ad account.
It's easy to become overwhelmed by the sheer number of Facebook ad metrics you could analyze in your ad account—reach, impressions, frequency, results, click-through rate (CTR), quality score, conversion ranking, and return on ad spend (ROAS), to name just a few. And with the ability to create custom metrics, the options become endless.
To measure the real impact of your Facebook advertising on your business and how it's generating new sales and customers, I'm going to walk you through how to add 10 core metrics (both default and custom) to a custom report.
#1: Create a New Custom Report in Facebook Ads Manager
To start, you're going to need to build a custom report so you can add all of the default and custom metrics we're going to cover into one data view. This will allow you to look at these metrics across all of your campaigns, ad sets, and ads with ease.
Let's assume you're using Facebook ads to generate sales for your business and using the Conversions campaign objective, optimizing for purchases. The goal of your campaign is to generate a purchase action, which represents a sale of your product or service. This could be tangible like in an eCommerce business running through Shopify, or a sale of a product for an information business running through Kajabi or SamCart.
To build a custom report, open your Facebook Ads Manager dashboard and click on the columns button on the far right of the screen. You'll then see a list of all of the default metrics with Performance selected by default.
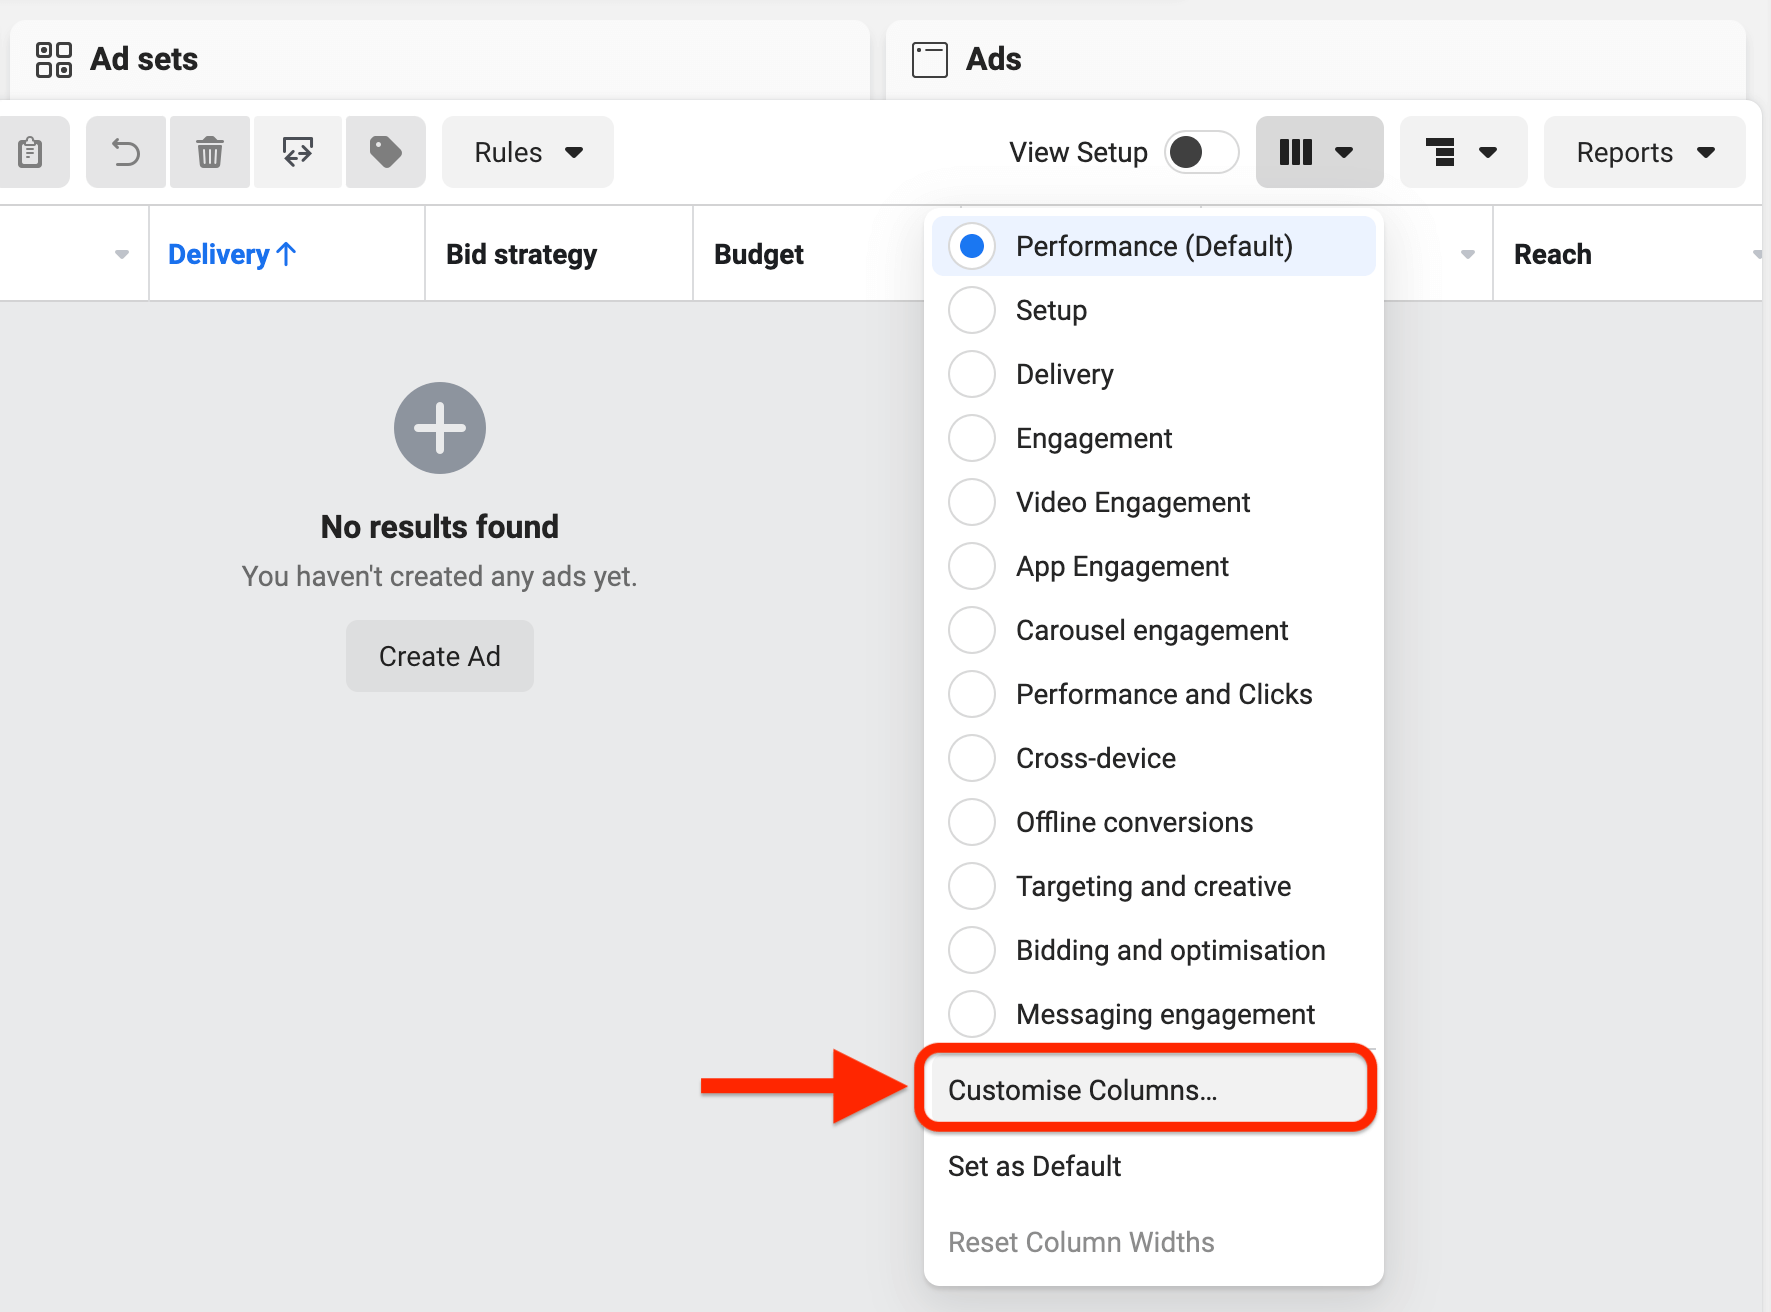
Scroll down to the bottom of the list and select Customize Columns. This will allow you to drag and drop the metrics you want to track into your reporting dashboard.
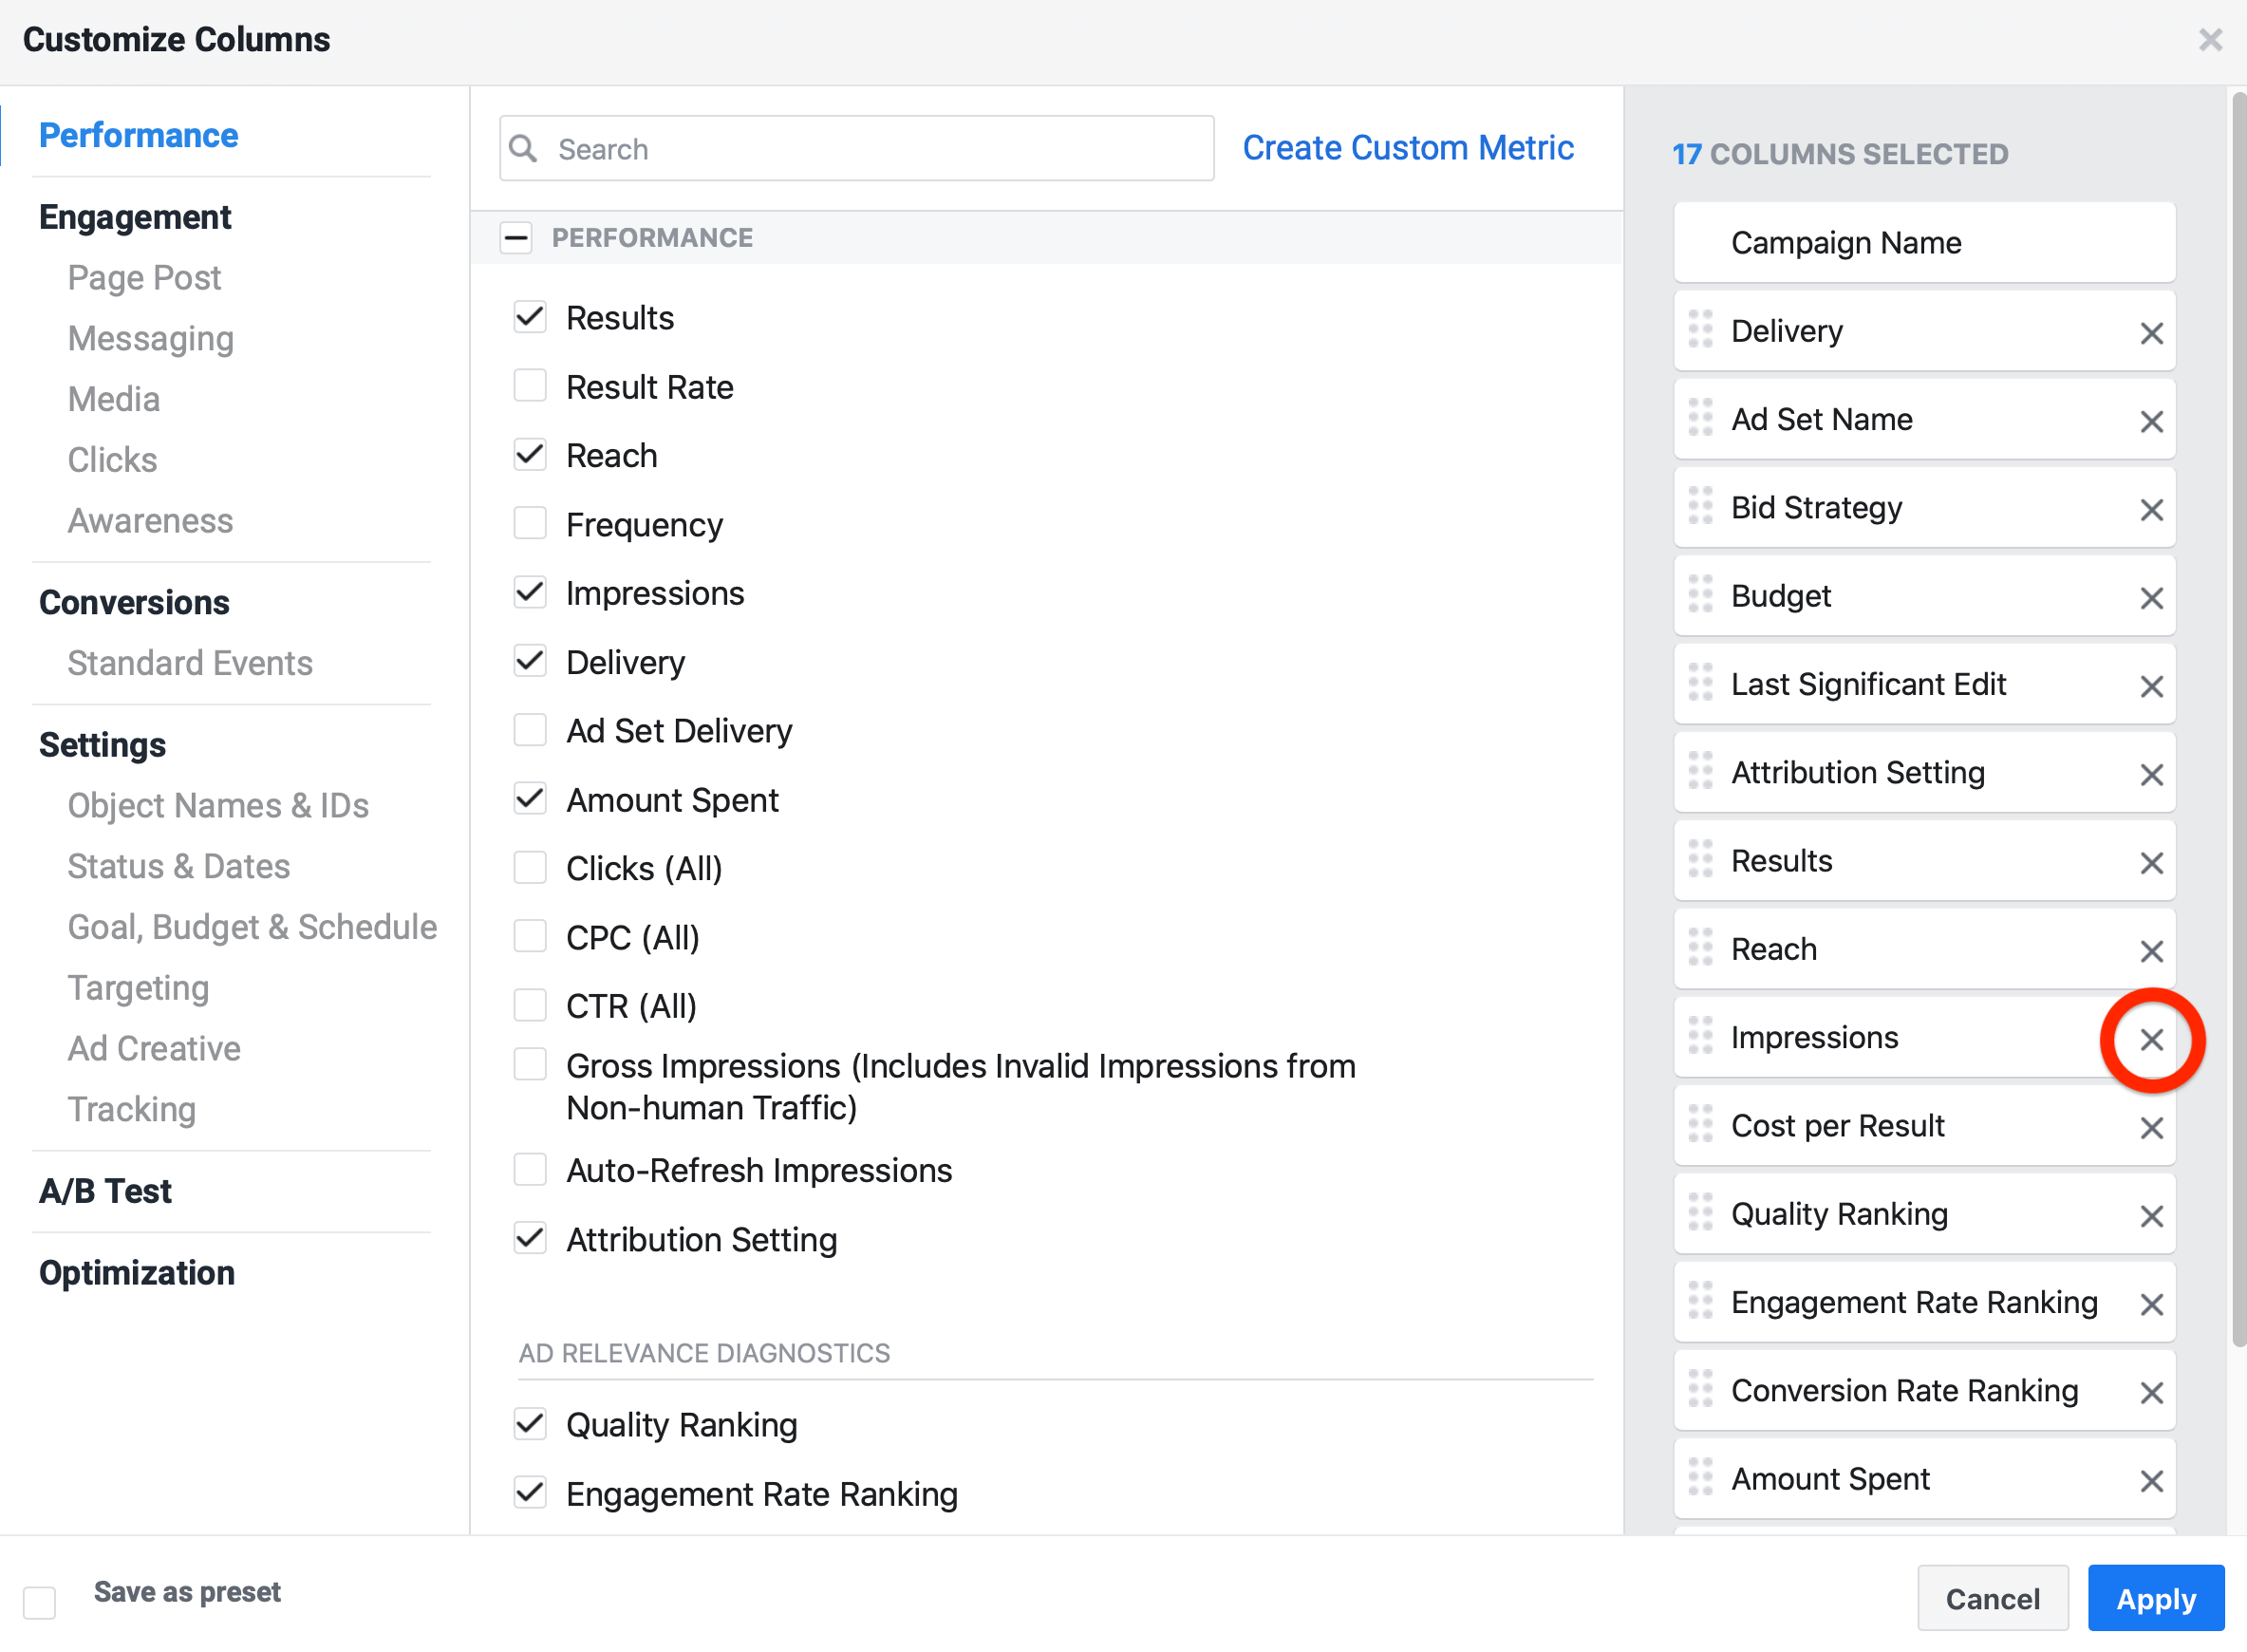
In the Customize Columns window, you'll find three columns. On the left, you'll see the categories of metrics to choose from, the middle is where you select your metrics, and the right column lists the metrics that will be included in this reporting view.
In the list of metrics on the right, Facebook lets you delete metrics you don't want to use in your custom report and drag and drop to reorder them.
Get World-Class Marketing Training — All Year Long!
Are you facing doubt, uncertainty, or overwhelm? The Social Media Marketing Society can help.
Each month, you’ll receive training from trusted marketing experts, covering everything from AI to organic social marketing. When you join, you’ll also get immediate access to:
- A library of 100+ marketing trainings
- A community of like-minded marketers
- Monthly online community meetups
- Relevant news and trends updates
Start by deleting the following metrics in the right column:
- Impressions
- Quality ranking
- Engagement rate ranking
- Conversion rate ranking
- 3-second video plays
- Video percentage watched
- Video average play time
To delete a metric, simply click on the X to the right of the metric.
When you're finished, the next step is to start adding metrics to your custom report alongside the default performance metrics (like results and cost per result) you didn't delete.
#2: Add 4 Metrics to Assess Website Traffic From Your Facebook Ad
The first four metrics you want to add to your report will help you determine whether the traffic generated from your Facebook ad is getting to your website and how much it's costing you.
Start by adding these three metrics:
- Link clicks
- CPC (cost per link click)
- Landing page views
You can use the search bar at the top of the screen to quickly find the metrics you want to add.
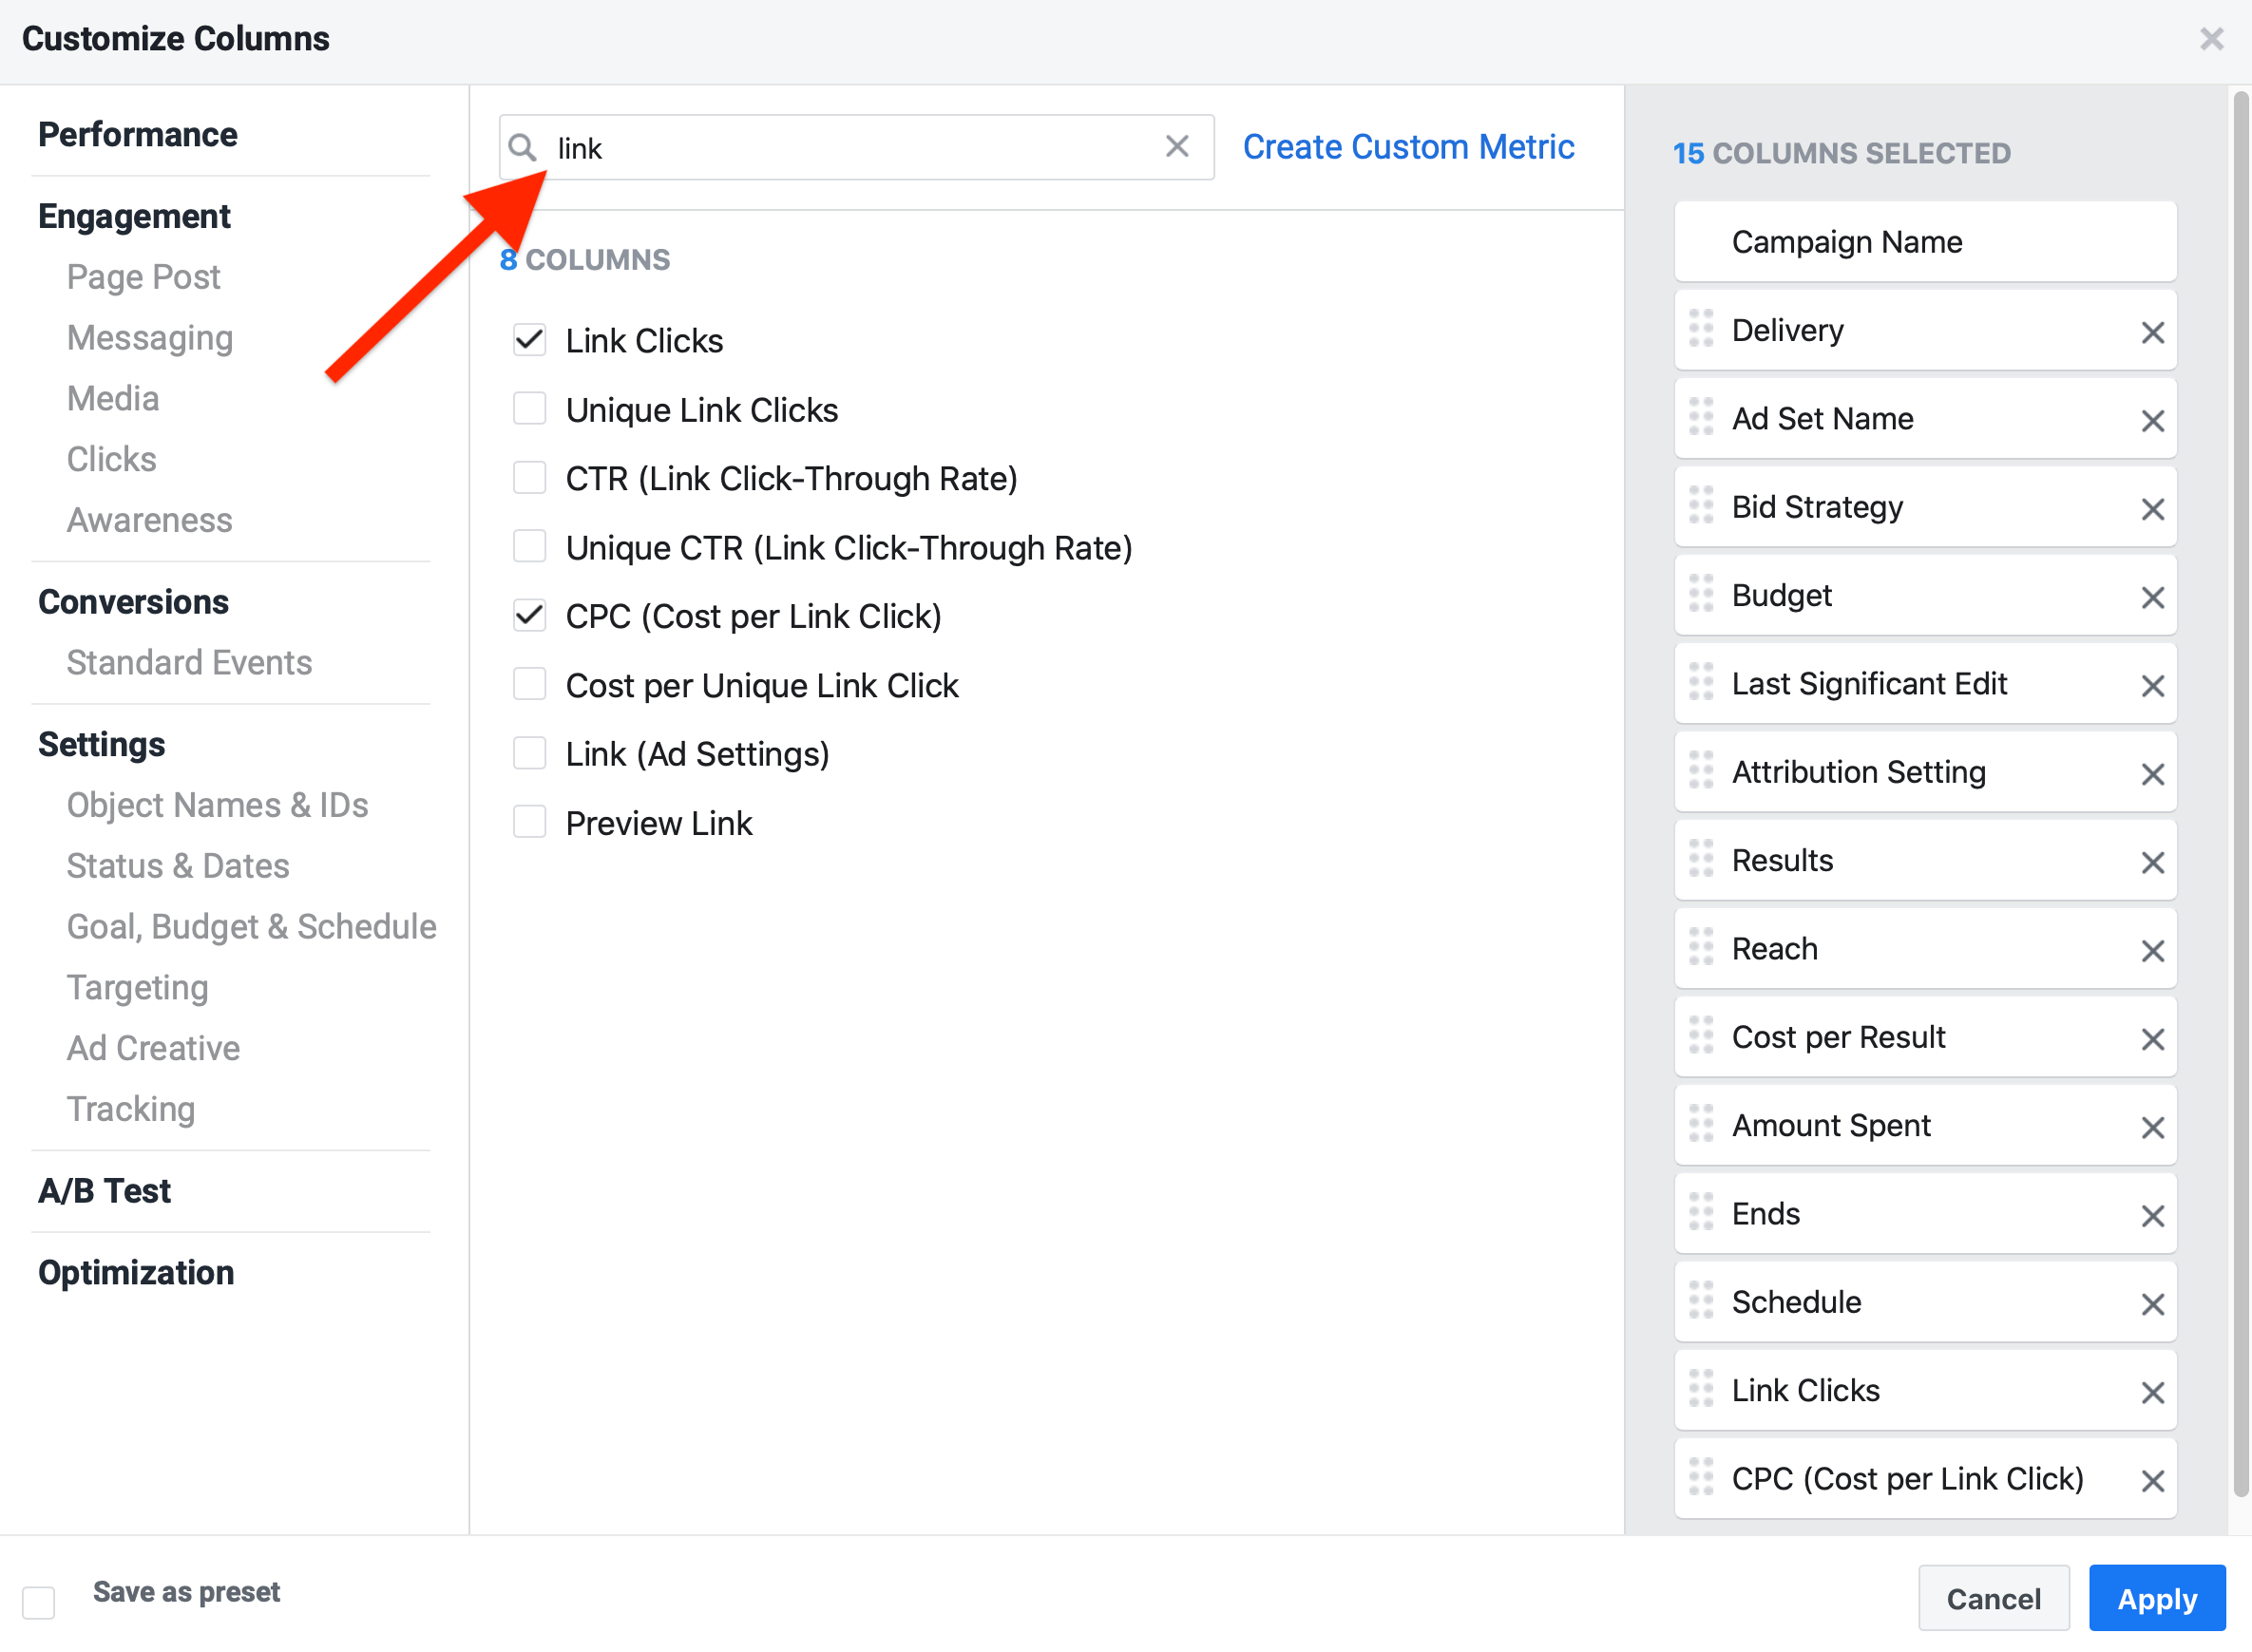
These three metrics are important on-platform metrics that measure the drop-off between people who click on your ads and those who stay to load your website. This is one of the first things to look at when running Facebook ads because it indicates how much of the traffic clicking on the ads is actually getting to your URL destination.
One reason for the drop-off between link clicks and landing page views is slow page load times. If you get 100 link clicks but you only see 50 landing page views, that means your website is loading too slowly and you've got a big issue on your hands. You've just doubled the cost of your traffic because only one in two people are staying to load the page, instead of everyone who clicks on your ad.
Another important metric you need to measure (because it determines your CPC) is CTR, specifically the link CTR. Add it after the landing page views metric. The better your CTR, the more Facebook will reward you as an advertiser, giving you a lower CPC, as there is a direct correlation between CPC and CTR.
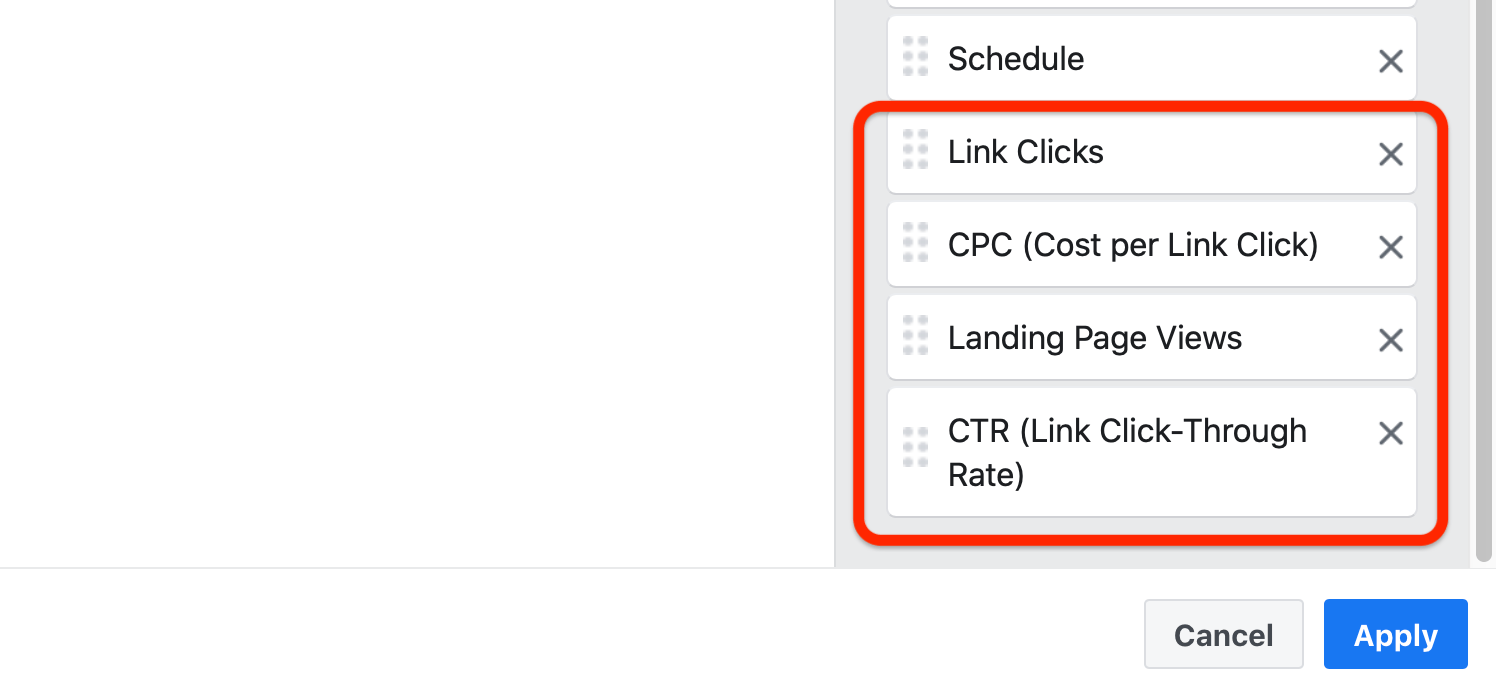
For example, you can use benchmark CTRs based on the temperature of the audience. You'll see a lower CTR for cold audiences like lookalikes and interest-based ones because these are new people who don't know your business yet. Aim for at least a 1% CTR for these types of audiences.
For warm audiences of Instagram engagers, you'll see a higher CTR so aim for a minimum of 1.5%. And for hot audiences of website traffic or eCommerce standard events such as add to cart, strive for at least a 1.75% CTR.
#3: Add 4 Purchase-Based Facebook Ad Metrics
Now let's move on to the purchase-based metrics. You want to add these four metrics to your reporting column:

Discover Proven Marketing Strategies and Tips
Want to go even deeper with your marketing? Check out the Social Media Marketing Podcast! Publishing weekly since 2012, the Social Media Marketing Podcast helps you navigate the constantly changing marketing jungle, with expert interviews from marketing pros.
But don’t let the name fool you. This show is about a lot more than just social media marketing. With over 600 episodes and millions of downloads each year, this show has been a trusted source for marketers for well over a decade.
- Total number of purchases
- Purchase value (giving purchase conversion value)
- Cost per purchase (giving cost per acquisition)
- Purchase ROAS
After you add these metrics, be sure to deselect the checkboxes under each purchase metric in the right-hand column. These give a further breakdown you don't want, as you're looking at the metrics as a whole figure.
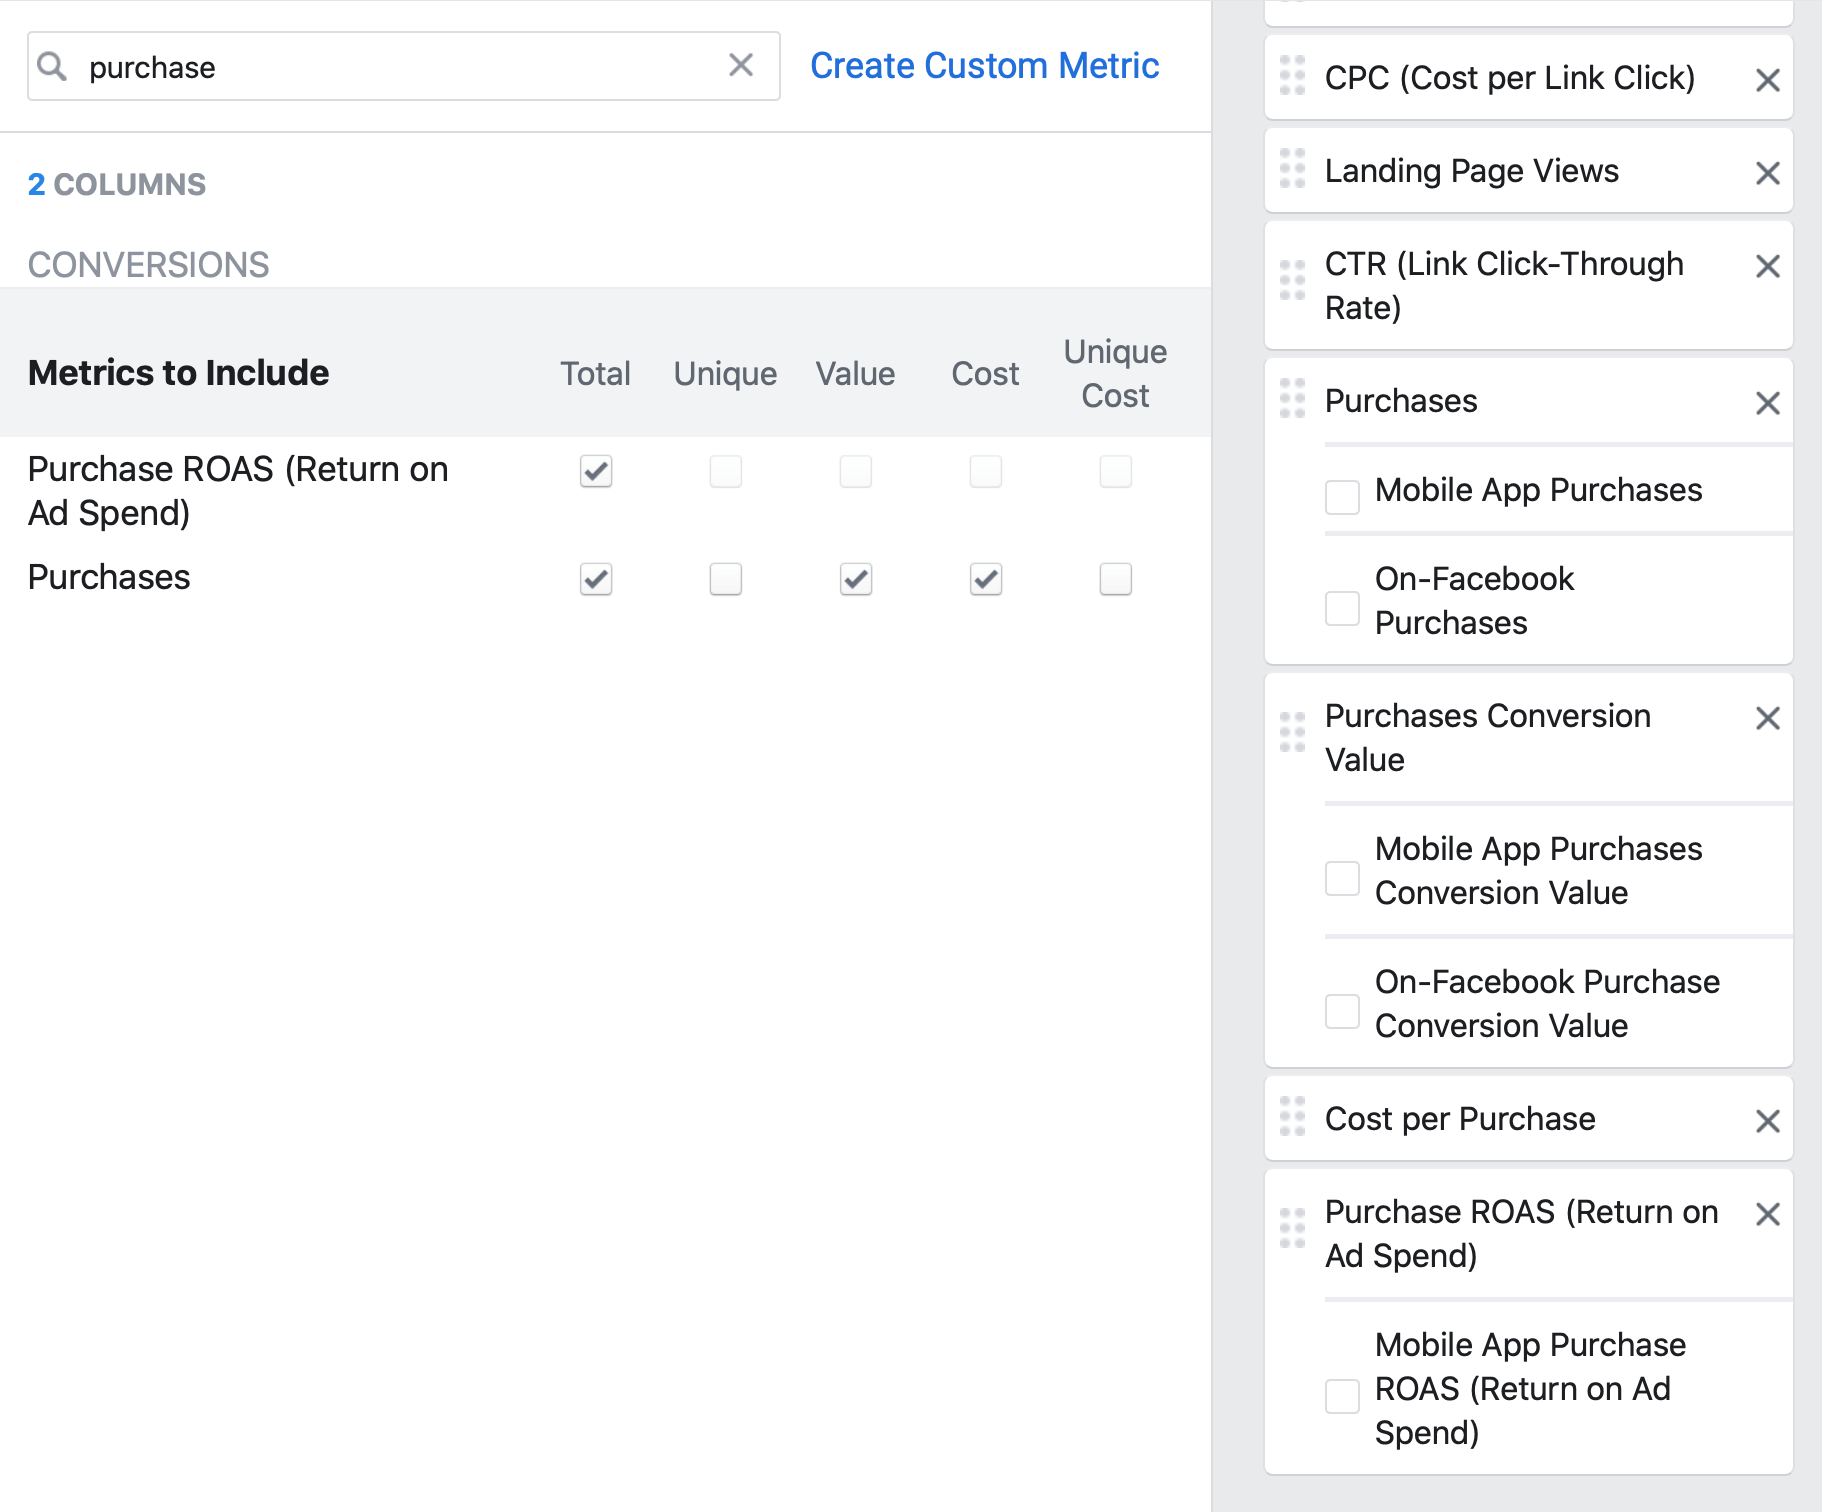
The four purchase metrics above will tell you everything you need to know about the number of sales you're generating, how much revenue you can attribute to those sales, your cost per acquisition, and your ROAS, giving you the profitability of your Facebook ads.
Let's do a quick recap. You should now have a custom reporting column with the following additional metrics:
- Link clicks
- CPC
- Landing page views
- Link CTR
- Purchases
- Purchases conversion value
- Cost per purchase
- Purchase ROAS
#4: Add 2 Custom Metrics to Track Average Order Value and Sales Page Conversions
Now you're going to build two custom metrics that will give you additional insight beyond the default metrics that Facebook gives you.
Average Order Value
The first custom metric you want to create is average order value (AOV).
In the Customize Columns window, click the Create Custom Metric link.

In the pop-up window, name this metric AOV, which denotes the average revenue per purchase. The difference between your cost of acquisition (cost per purchase) and AOV is your ROAS.
Let's say it costs you $15 to get a purchase and the AOV is $45. Your ROAS is at 3X because $45 ÷ $15 = 3.
You're going to use the following formula for Facebook to calculate your AOV:
Purchases Conversion Value ÷ Purchase
Next to the name of your custom metric, select Numeric from the Format drop-down menu. Then in the Formula section, start typing in “purchases conversion value” and select it from the menu that pops up.
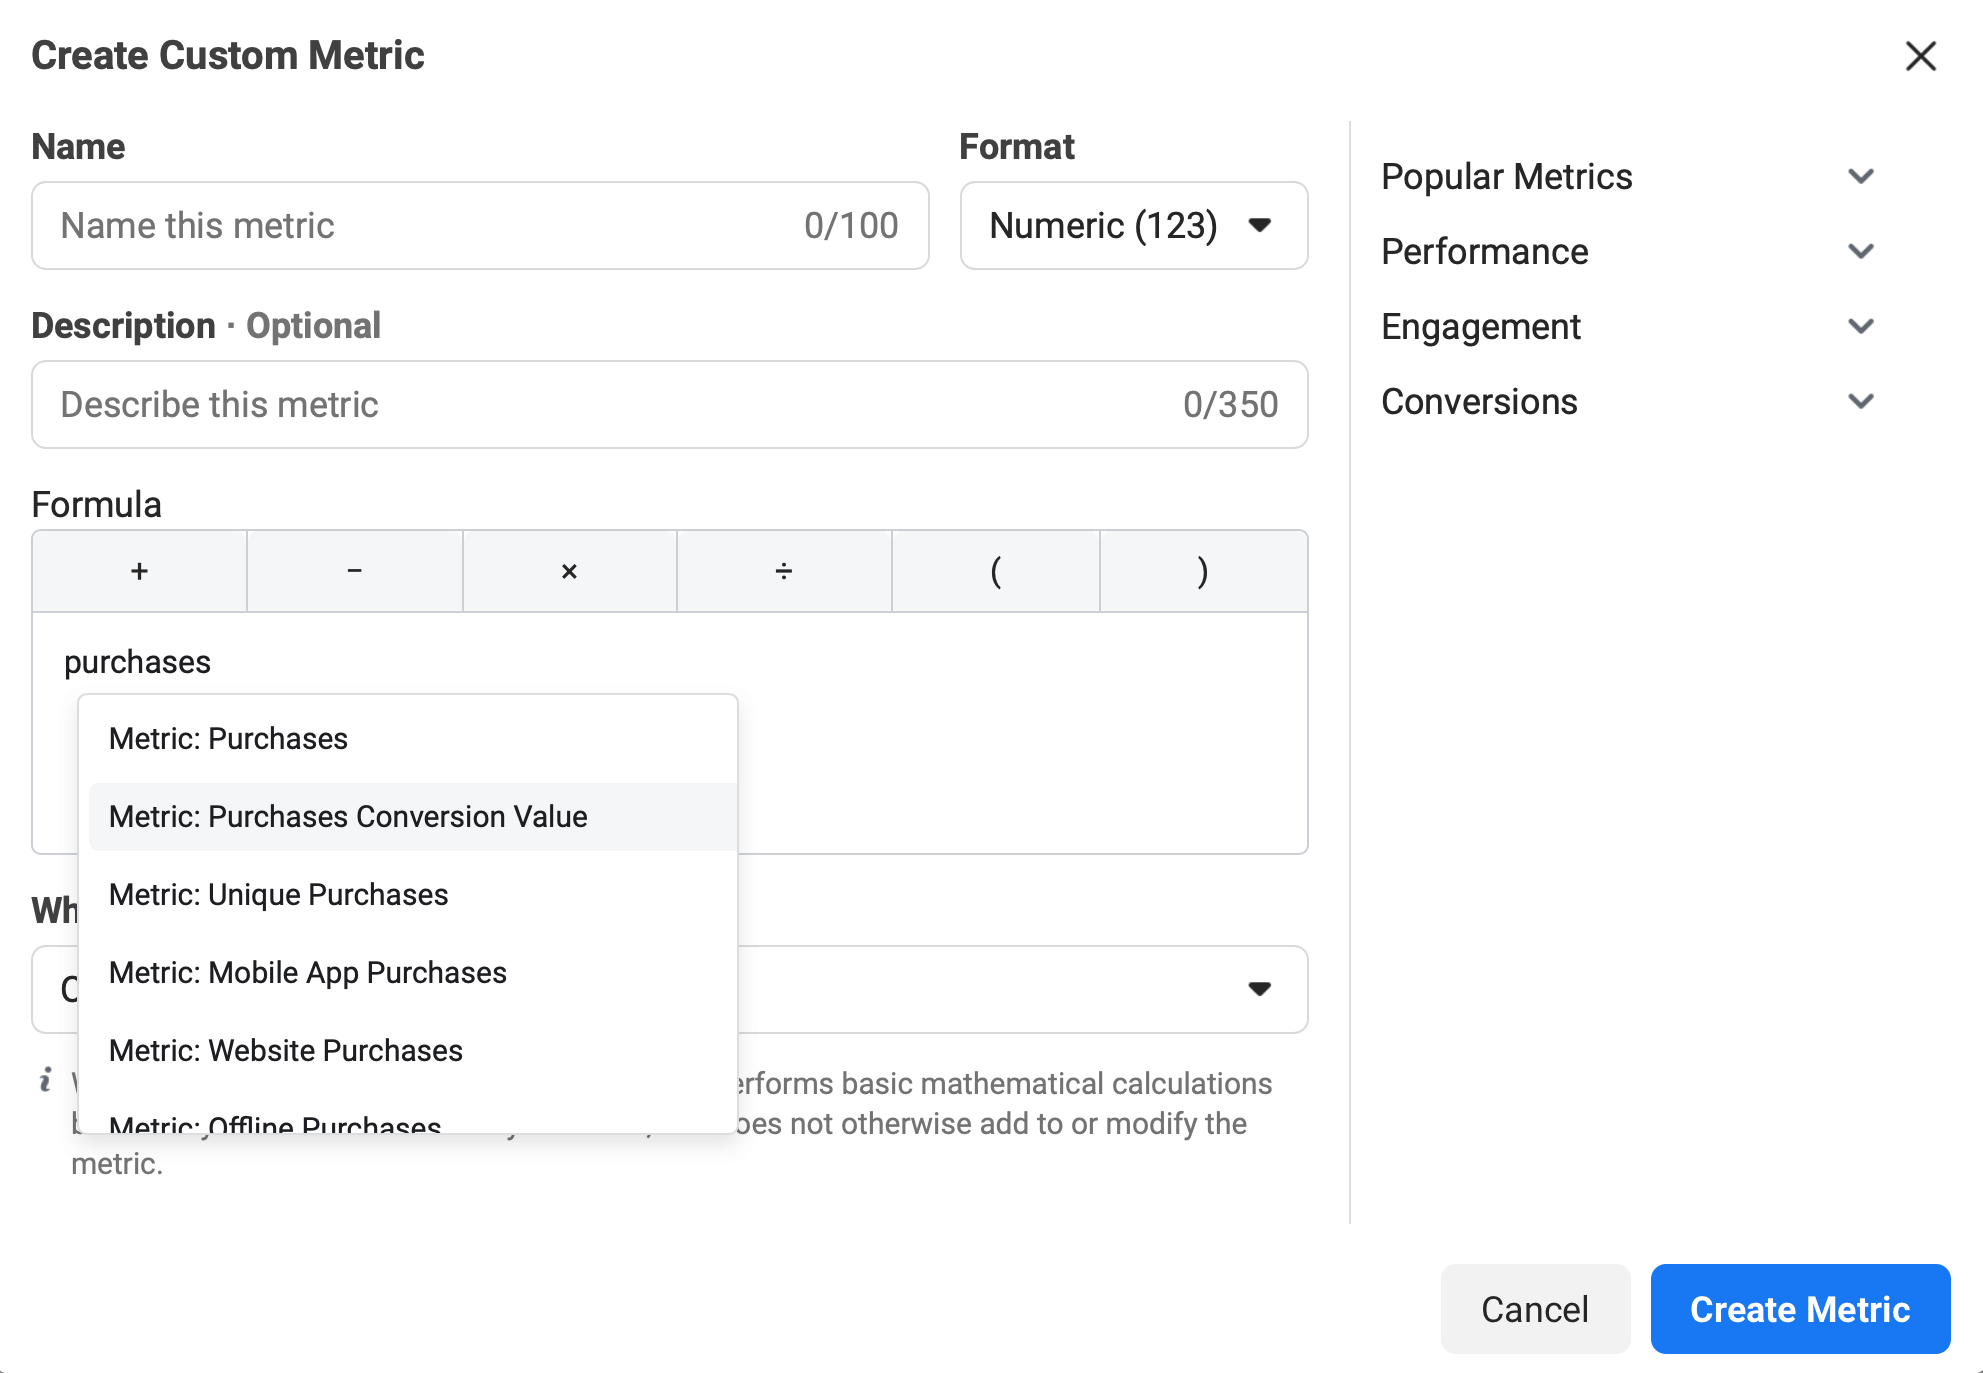
Next, click the division symbol and then type in “purchases.”
After you've entered the formula, click Create Metric. That now shows you the AOV.
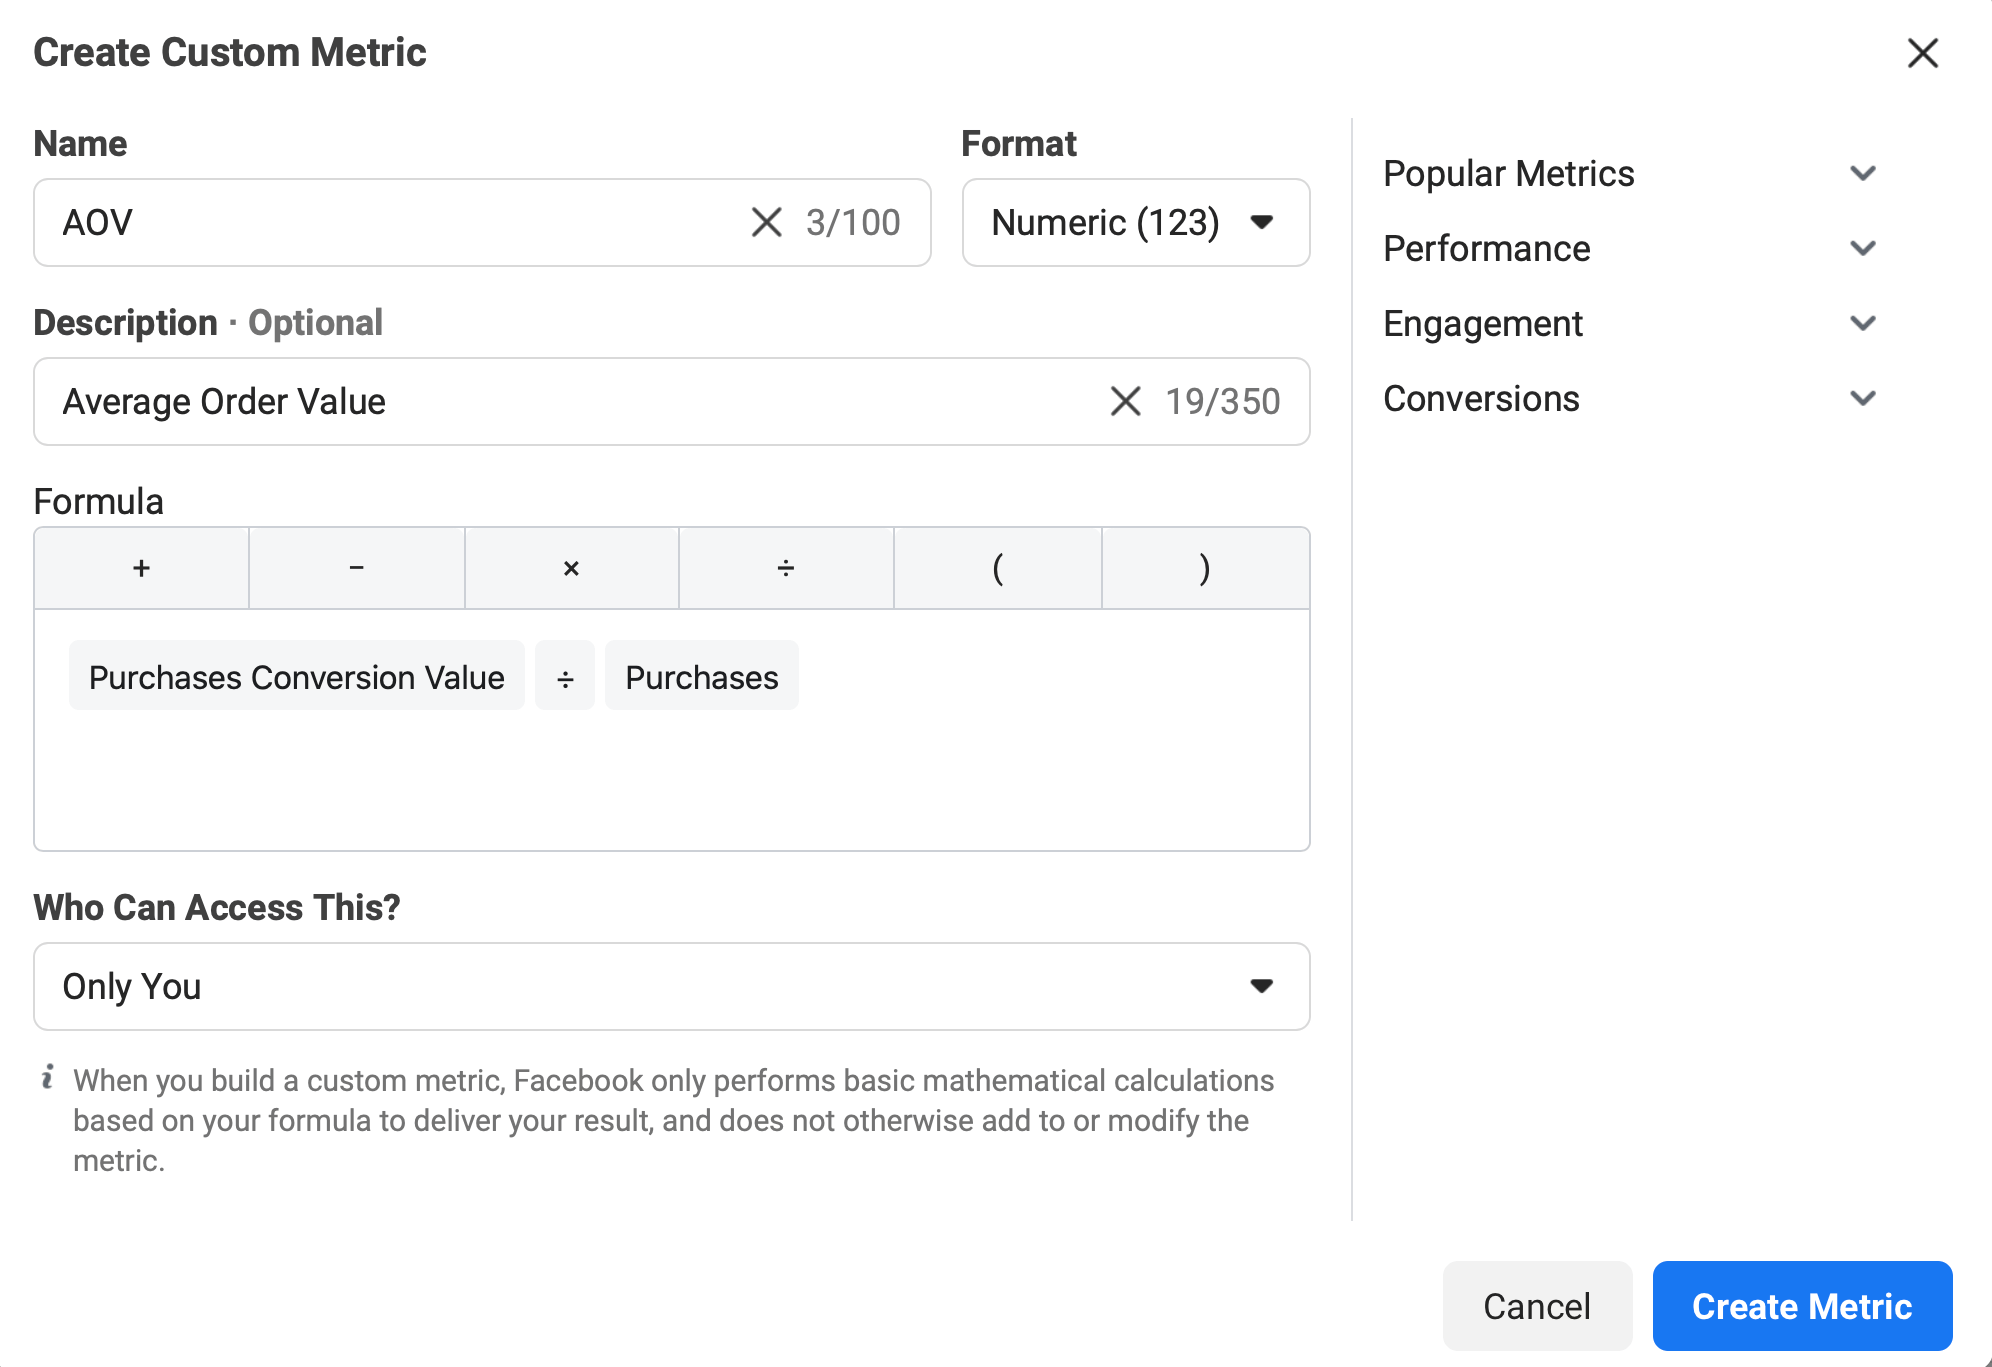
The next step is to add this custom metric to your report. In the middle column, select AOV in the custom metrics section.
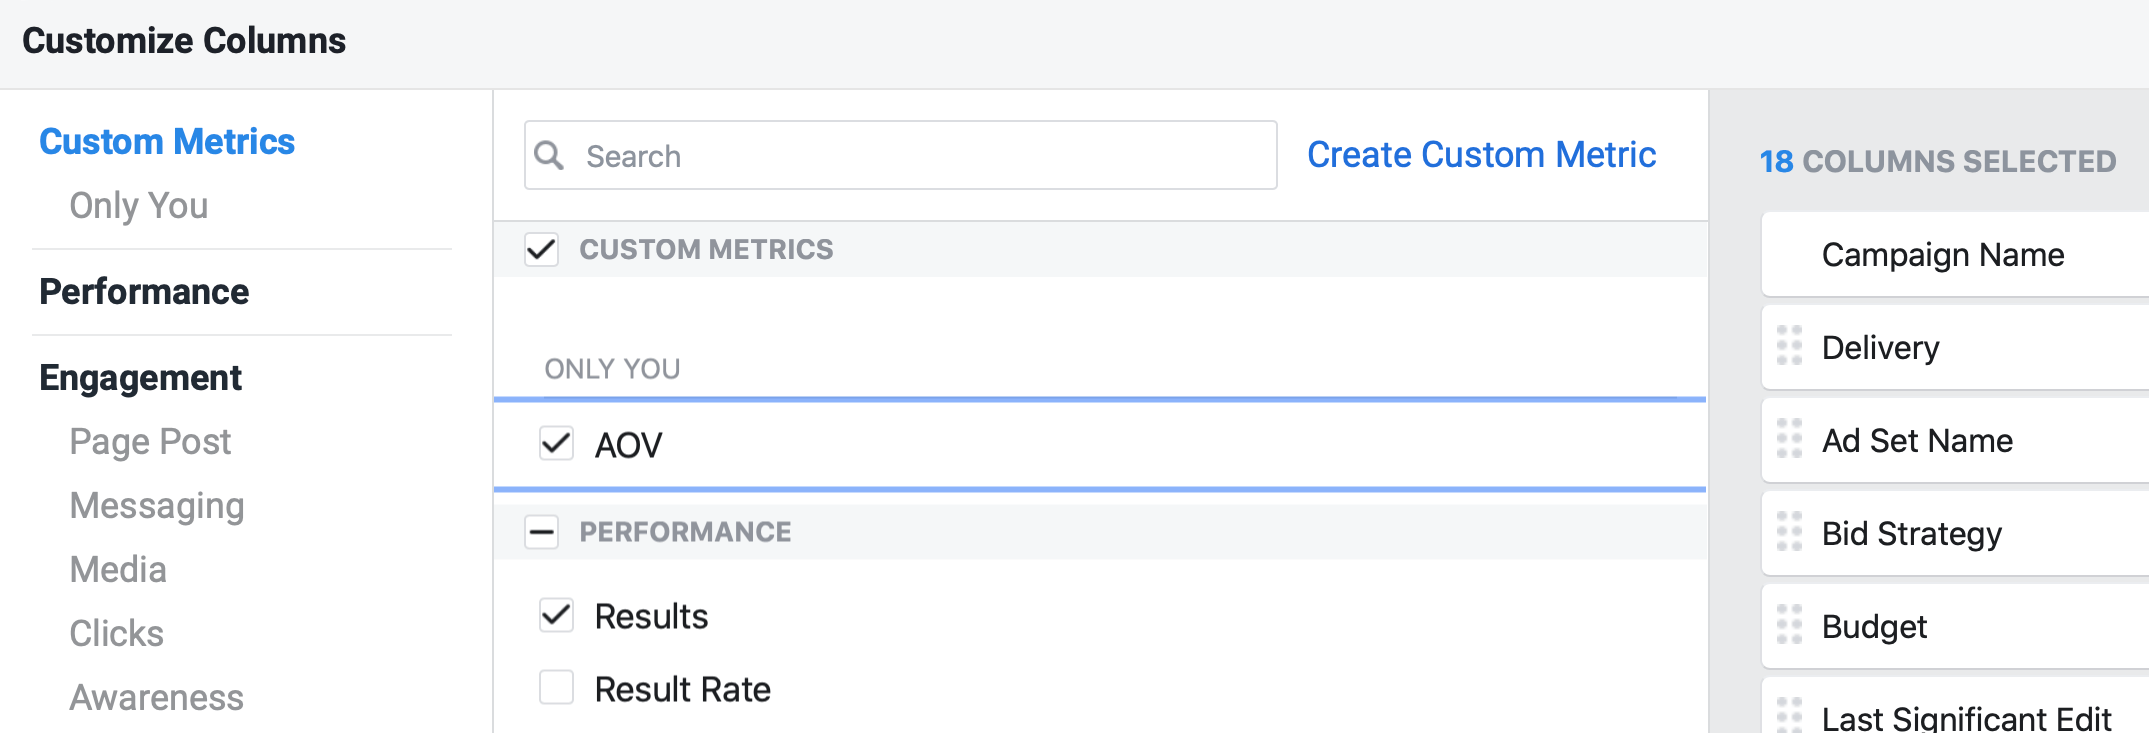
AOV is super-important because when you're analyzing ads, you'll find some ads have better on-Facebook metrics, like a better CTR. However, their ROAS might not be as good because their AOV is not as high. Understanding what ads deliver the highest AOV, and therefore the highest ROAS, is critical to measuring your Facebook ad success and knowing the next steps, whether that's further testing, optimizations, or scaling.
Sales Page Conversion Rate
The other custom metric you want to create is sales page conversion rate. It's critical to know your sales page conversion rate because you can then see which Facebook ads convert better, not just from a CTR perspective (which is an on-Facebook metric) but using an off-Facebook metric like sales page conversion rate.
To set up this custom metric, click on Create Custom Metric again. Type in “sales page conversion rate” for the name of this metric and choose Percentage as the format.
In the Formula section, enter the following formula to calculate this metric:
Purchases ÷ Landing Page Views
This is going to give you a percentage-based sales page conversion rate. It looks at the landing page views—people who have actually stayed to load that page from your ads—and then the percentage of those people who have purchased within the 7-day attribution window.
When you're done, click Create Metric.
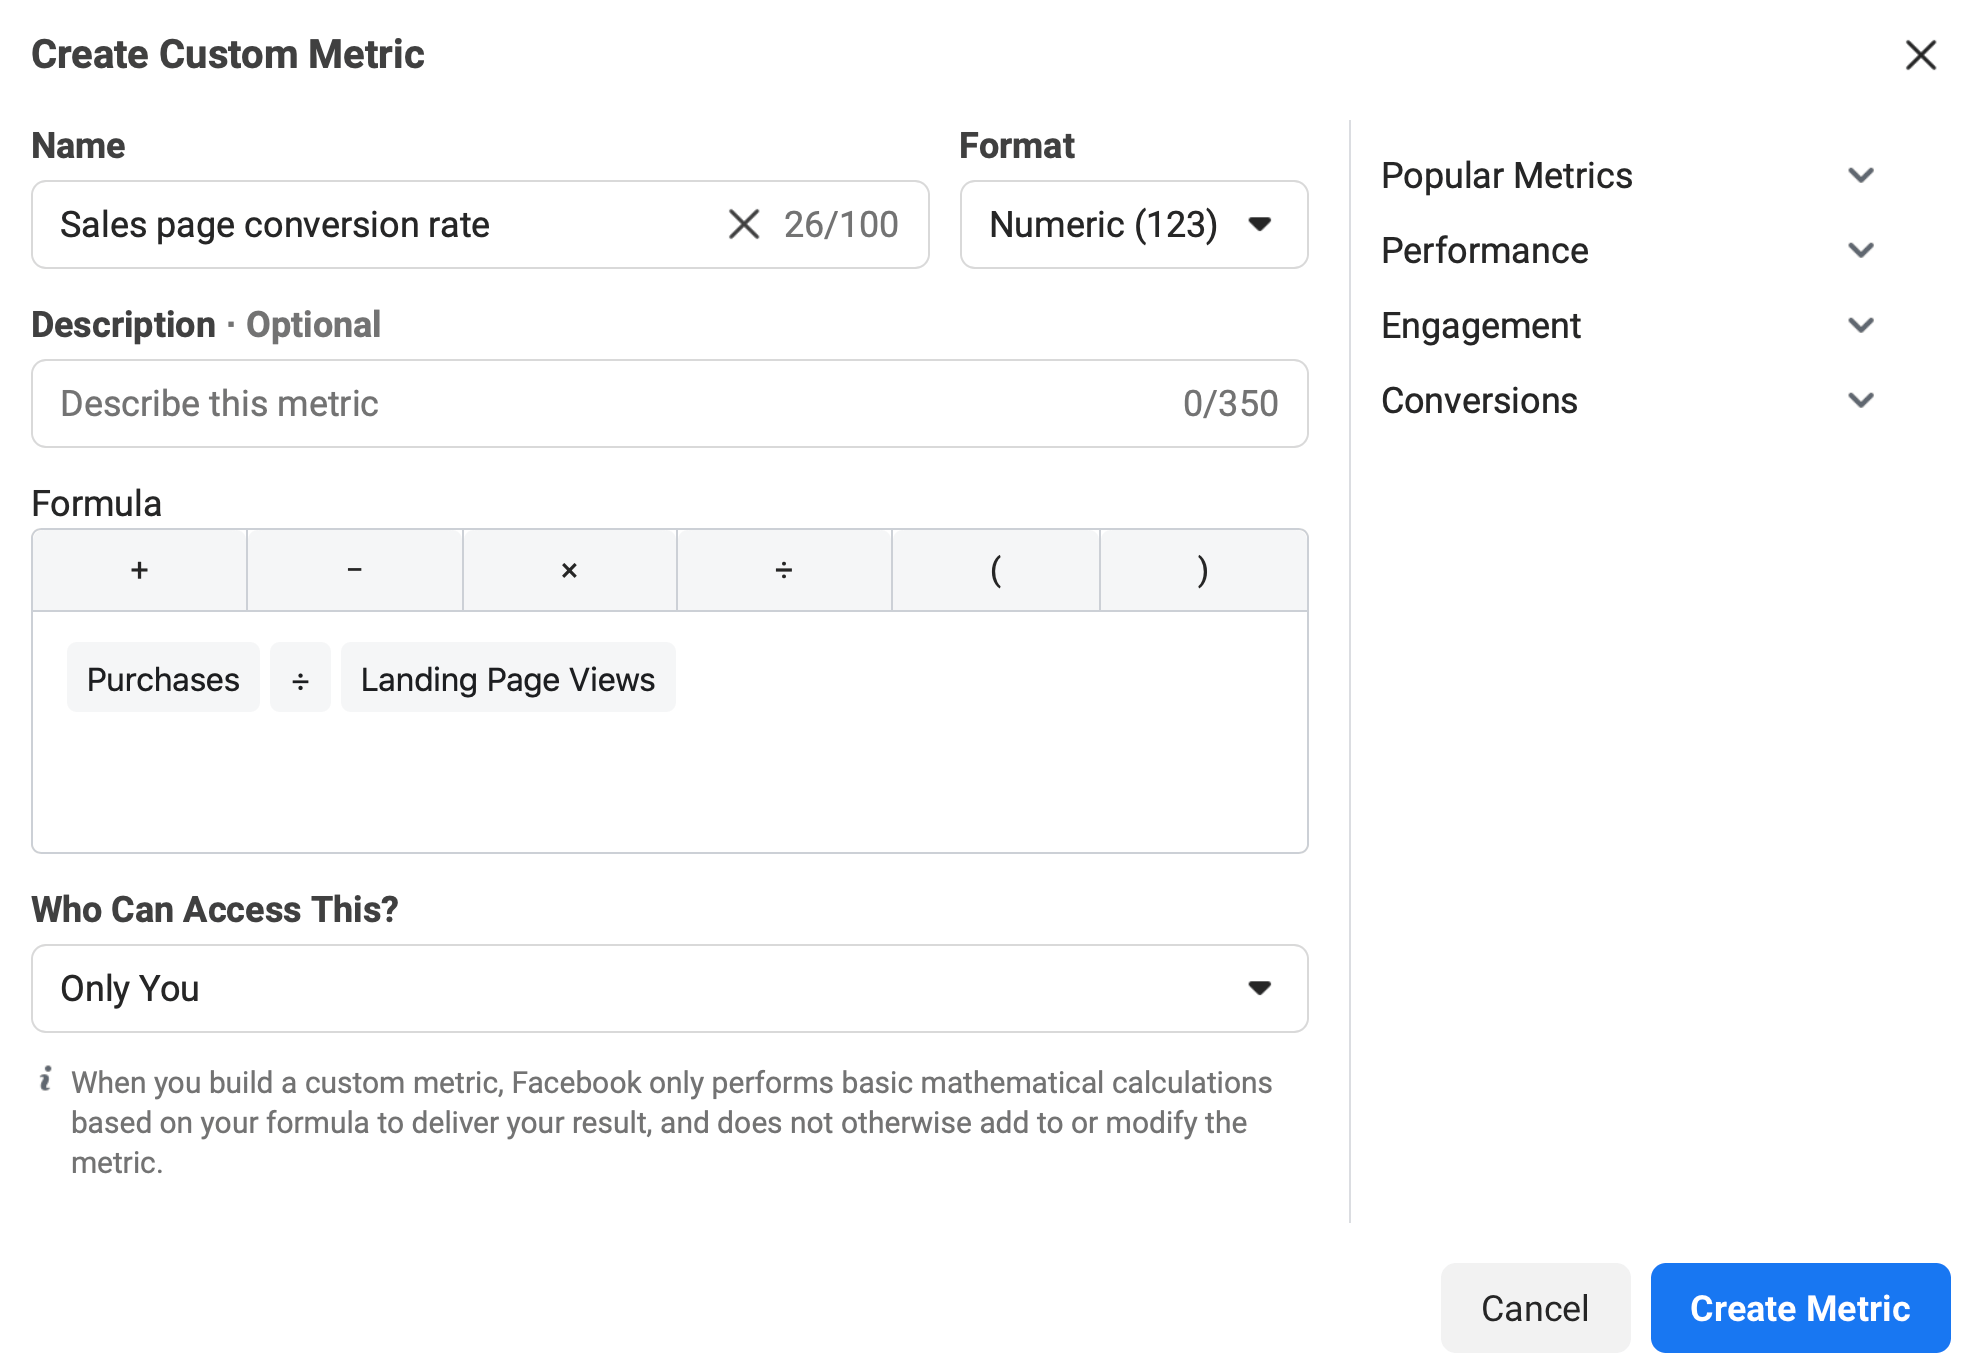
Then add the custom metric you just created to your report.
Some of the highest sales page conversion rates I've seen recently are around 8% across the whole account. I've even seen as high as a 10% sales page conversion rate from cold campaigns when using a custom landing page for Facebook traffic.
Let's recap once more. In your custom report, you're going to have these columns:
- Link clicks
- Cost per link click
- Landing page views
- Link click CTR
- Purchases
- Purchase conversion value
- Cost per purchase
- Return on ad spend
- Average order value
- Sales page conversion rate
The last step is to save this report as a preset. To do this, click Save as Preset in the lower-left corner, type in a name for it, and then click Apply.

This going to be your custom ROAS report with which you can measure your campaigns' effectiveness. You'll be able to choose it from the Columns drop-down menu in your Ads Manager dashboard.
Conclusion
These are the key metrics you need to track on Facebook—default ones plus custom metrics that you can create—that are going to be fundamental to evaluating your success on the platform.
By using on-Facebook metrics such as link clicks and landing page views, you can measure the effectiveness of the traffic being sent to your site. Then, using the off-Facebook metrics—the purchase ones and custom metrics—you can measure the real impact of your advertising on your business and how it's generating new sales and customers.
Get More Advice on Facebook Ads
- Scale your Facebook ads.
- Build warm Facebook ad audiences.
- Exit the Facebook ads learning phase quicker.
Attention Agency Owners, Brand Marketers, and Consultants

Introducing the Marketing Agency Show–our newest podcast designed to explore the struggles of agency marketers.
Join show host and agency owner, Brooke Sellas, as she interviews agency marketers and digs deep into their biggest challenges. Explore topics like navigating rough economic times, leveraging AI, service diversification, client acquisition, and much more.
Just pull up your favorite podcast app, search for Marketing Agency Show and start listening. Or click the button below for more information.

