 Want a better way to evaluate your website's performance? Wondering how to set goals to mark key points in your customer's journey?
In this article, you'll learn how to assess the effectiveness of the customer journey on your website using awareness, completion, and engagement goals.
#1: Define Goals Along the Customer Journey
Before you open Google Analytics, you need to choose which goals to track. In online marketing, the most obvious goal is an end result such as a purchase or sign-up. However, customers rarely head straight for your shopping cart or sign-up page. They take several steps along the customer journey to reach that final result.
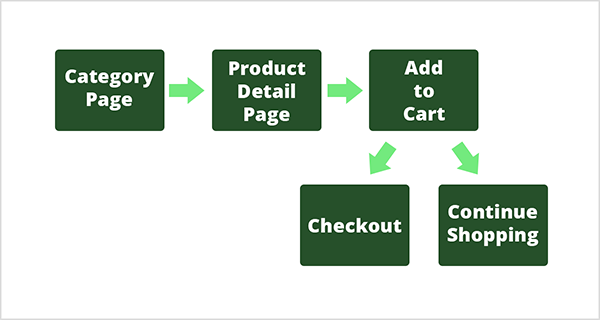
When you choose which goals to track, you need to identify these milestones as goals, too. To visualize, think about the customer journey for a product on an eCommerce site. Customers might come through a category page to the product detail page and then add the item to their cart. From there, they can check out or continue shopping.
In this case, the main goal is the checkout page, and the goals along the way might include visiting the product detail page and maybe even clicking the Add to Cart button.
As you choose the milestone goals along the customer journey, you need to be careful to avoid choosing the wrong goal for the wrong purpose. When you choose the wrong goals, measuring your marketing becomes more difficult than it needs to be.
To ensure you choose the right goals, think about whether a goal is a necessary milestone in the customer journey and whether you have goals for each stage in the journey.
You can easily determine whether a goal is necessary. In the eCommerce example, if a customer must see the product detail page to add that product to their cart, that's a necessary step. Similarly, customers must add the product to their cart to reach checkout. Because these milestones are necessary steps in the customer journey, the product detail page and cart page are good goals.
You also need to monitor three main types of goals: awareness, engagement, and completion.
Awareness Goals
An awareness goal reflects the first phase of the customer journey. In the checkout example, the awareness goal is viewing the product detail page. If you're trying to capture leads, your awareness goal might be someone on Facebook or LinkedIn clicking an ad or link to a blog post. In both cases, the customer becomes aware of your product or business.
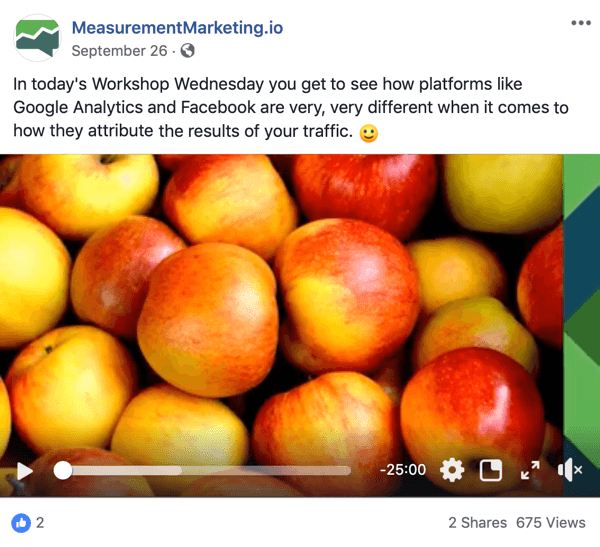
An awareness goal can also be more specific such as a customer seeing a particular offer you're making. In this case, the customer might land on an opt-in offer to become a lead or land on a sales page to purchase something. To illustrate, someone who watches or clicks this Facebook post that promotes a Workshop Wednesdays lead magnet from MeasurementMarketing.io might become aware of the lead magnet.
3 Days of World-Class Training—Zero Travel!

Couldn't make it to Social Media Marketing World and AI Business World this year? Get all of the great content at a fraction of the price with a Virtual ticket.
That’s full access to recordings of every keynote, workshop, and session—the ones people travel thousands of miles to see. Don't wait. Get your Virtual ticket and enjoy actionable content that you can watch anytime, anywhere.
If you need help figuring out whether a customer action is an awareness goal, try thinking about awareness from an offline perspective. In the offline world, awareness might happen when someone walks by and sees a shoe store. Seeing the store is an awareness goal because the person is now aware the shoe store exists. That's all the awareness goal is supposed to do.
Engagement Goals
Although engagement goals are often skipped, they're an important part of the customer journey because engagement is how a customer transitions from awareness to completion. In the offline world, engagement might be someone walking into the shoe store and trying on shoes. Similarly, online customers need to engage with the product you want them to buy or the action you want them to take.
In the checkout example, adding the product to the cart is the engagement goal. In Google Analytics, you can track when a customer clicks the Add to Cart button or when they see the actual cart page as an engagement goal.
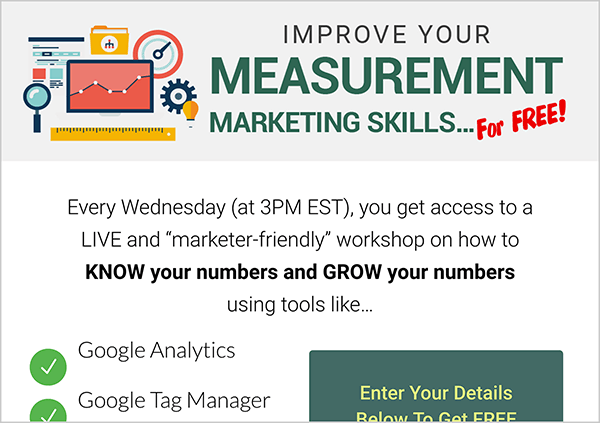
If you're trying to get a lead, look for an action prospects need to take in order to move from awareness to sharing their information with you. On a blog post page, maybe it's clicking a button to learn about your lead magnet such as a free white paper or free tool. In this example, you see the information page for the Workshop Wednesdays freebie:
Completion Goals
Completion goals are the ones marketers naturally think of as goals. In the offline world, completion is when the person buys a pair of shoes. In the online checkout example, someone reaches the checkout page. In the lead generation example, someone shares their email address or other contact information with you. Then they see a landing page, such as this one for people who sign up for Workshop Wednesdays:
#2: Set Up and View Goals in Google Analytics
Google Analytics is a fantastic tool that's built to track goals. To track your awareness, engagement, and completion goals for a customer journey, you create destination goals, which are based on the URLs customers visit.
For instance, Measurement Marketing Academy is my flagship product, and I've set up several goals in Google Analytics based on the customer journey. The awareness goal is the sales page. The engagement goal is the cart. The completion goal is the purchase, and in Google Analytics, this goal is based on the thank-you page customers see after they buy an Academy subscription.
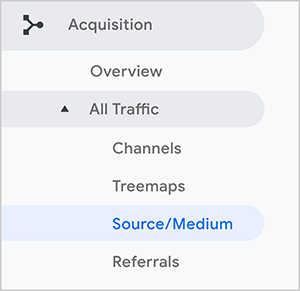
After these goals are set up, you can view your performance in the Google Analytics Source/Medium report (assuming you've set up the traffic sources correctly). Through this report, you can quickly discover what's working and what's not. To see this report, click Acquisition in the Google Analytics sidebar. Click All Traffic and then Source/Medium.
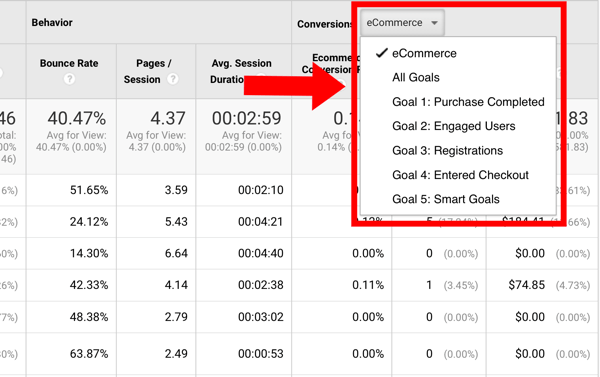
When the Source/Medium report is visible, you can see how well different traffic sources help you reach your goals. The traffic sources are listed on the left. On the right, in the Conversions area, you can select any of the goals you've set up from the drop-down list. Then, in the Conversion Rate column, you see how well traffic from a specific source converts for the selected goal.
#3: Forecast Traffic and Optimize Your Marketing for Each Goal
At this point, you can begin tracking how your customer journey is going. With the right goals set up in Google Analytics, the Source/Medium report will help you start forecasting how you can reach your goals and measure actual traffic against these forecasts.
The ability to see how different traffic sources perform is powerful because you'll discover which traffic sources are good for achieving certain types of goals. You'll see that certain traffic sources are better at achieving awareness goals, engagement goals, or completion goals. From there, you can determine how to invest or adjust your marketing to meet each goal along the customer journey.
Two examples illustrate how the report can help you reach your goals. The first uses the Source/Medium report for the Google Merchandise Store demo account. The second example uses the Source/Medium report for Measurement Marketing Academy. If you use the demo account, you can navigate to the reports shown in this article to see the data yourself.
Want to Unlock AI Marketing Breakthroughs?
If you’re like most of us, you are trying to figure out how to use AI in your marketing. Here's the solution: The AI Business Society—from your friends at Social Media Examiner.The AI Business Society is the place to discover how to apply AI in your work. When you join, you'll boost your productivity, unlock your creativity, and make connections with other marketers on a similar journey.
I'M READY TO BECOME AN AI-POWERED MARKETERGoogle Merchandise Store Example
In the Google Merchandise Store demo account, you can find each type of goal if you focus only on the checkout process. The awareness goal is when the customer enters checkout. Because the customer has to register for an account before making a purchase, the registration is a necessary engagement goal. The completion goal is when customers make a purchase.
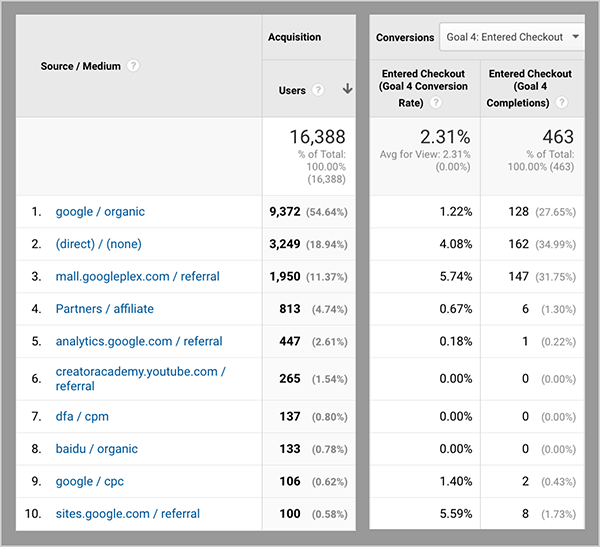
Awareness: To focus on the awareness goal, choose Goal 4: Entered Checkout from the Conversions drop-down list in the Source/Medium report. For the current date range, about 1% of the people who become aware of checkout come from the google/organic source. However, the mall.googleplex.com traffic has a 5% conversion rate, meaning it's about five times more effective.
Because google/organic brings in more users than mall.googleplex.com, the number of actual completions is about the same.
From this data, you can make several inferences about how to achieve your goals. Because the mall.googleplex.com traffic source does a good job of making people aware of the checkout process, you'd likely want to choose that traffic source over google/organic if you want to scale up traffic for the awareness goal.
In your forecast, you might expect the mall.googleplex.com traffic to maintain a conversion rate of about 5%. Then, over time, you can measure whether that traffic source actually maintains the conversion rate you forecasted.
Because google/organic sends more traffic to your goal, you can still use that source to scale up awareness. Although the google/organic conversion rates are low, you might still net the same or more goal completions. The mall.googleplex.com traffic will simply work harder because it has a higher conversion rate.
Engagement: To focus on the engagement goal, choose Goal 3: Registrations from the Conversions drop-down list. On this report, you can see that the traffic sources that performed well for awareness don't necessarily work as well for the engagement goal. For this date range, no one from the mall.googleplex.com source registered, but people from the google/organic source did.
Based on this data, you might infer that people coming from google/organic are engaged in the registration process because they're searching for this product or coming back to the store by searching for it.
The direct/none traffic, which is the second highest traffic source, is also worth a look. Often, email traffic appears as direct/none in the Source/Medium report, especially if you're not using UTMs and tagging your traffic properly. You might also have cart-abandonment sequences or something similar that brings people back to your site and they then engage.
However, the mall.googleplex.com traffic doesn't move anyone to the registration goal even though it brings lots of people to the registrations goal page. The lack of conversions may indicate there's an issue with the goal's setup. Or this traffic might be people who are already registered.
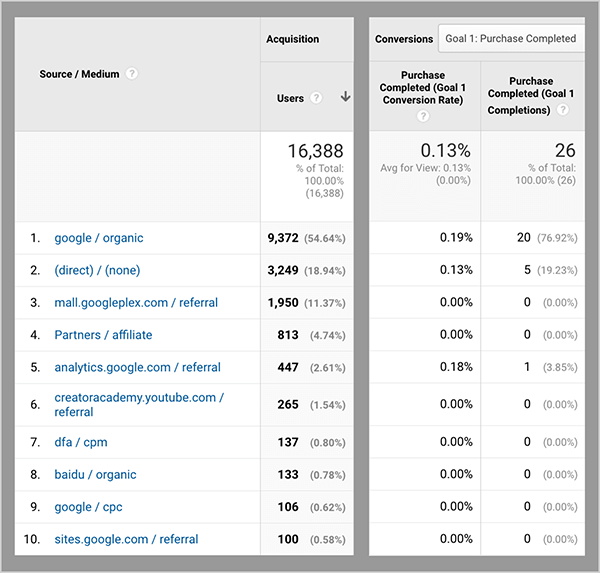
Completion: To focus on the completion goal, select Goal 1: Purchase Completed from the Conversions drop-down list. Once again, google/organic has a low conversion rate but brings in the most completions. The second highest traffic and purchase source is direct/none, which again could be email traffic that's not tagged.
Measurement Marketing Academy Example
Measurement Marketing Academy has less traffic than Google Analytics and is another good way to see the process of analyzing your goals. In this example, the goals follow the customer journey for purchasing the product. The awareness goal is the sales page, the engagement goal is the cart, and the completion goal is a purchase page.
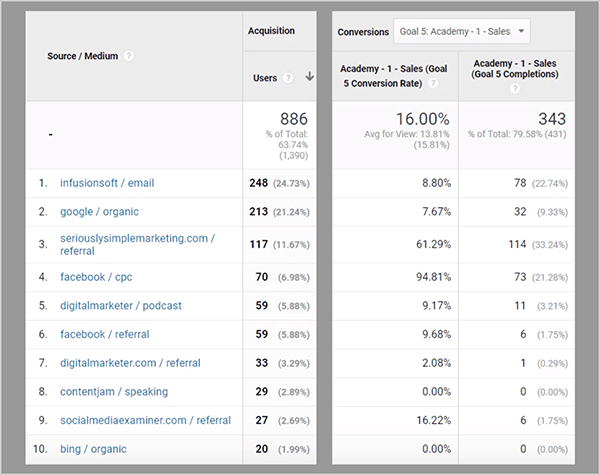
Awareness: The awareness goal is the sales page, or Goal 5: Academy-1-Sales. In the Source/Medium report, you can see the infusionsoft/email traffic makes people aware of the page, with an 8.8% conversion rate and 78 completions.
However, the best source for awareness is facebook/cpc, a paid Facebook campaign that pushes people to the Academy sales page, which is why the conversion rate (94.81%) is so high.
You can also see that a few other traffic sources help people become aware of Measurement Marketing Academy. These sources include referral traffic from the Serious and Simple Marketing website, which is a sister site for the Academy and has a conversion rate of 61.29% and 114 completions. Social Media Examiner also helps awareness with a conversion rate of 16.22% and 6 completions.
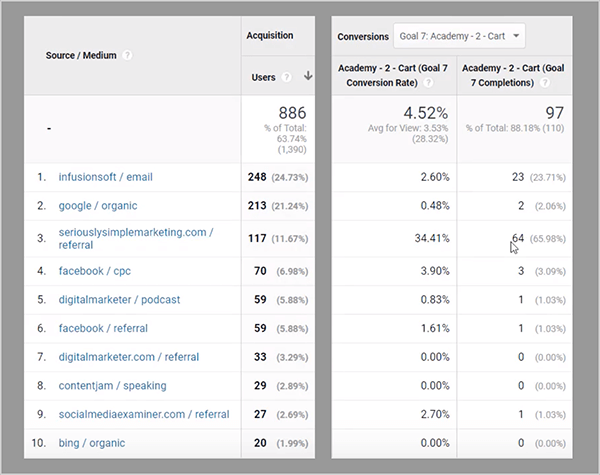
Engagement: When you examine the engagement goal conversions, the number of people moving to the cart is lower than the awareness conversions. Also, the traffic sources that drive engagement are a little different than those that create awareness.
The Serious and Simple Marketing website (with a 34.41% conversion rate and 64 completions) still does a great job of getting people interested in the cart. The second best source is the infusionsoft/email traffic, which has a 2.6% conversion rate and 23 completions. Social Media Examiner is also still converting at 2.7% and 1 completion.
However, the facebook/cpc traffic drops off significantly with a conversion rate of 3.9% and 3 completions.
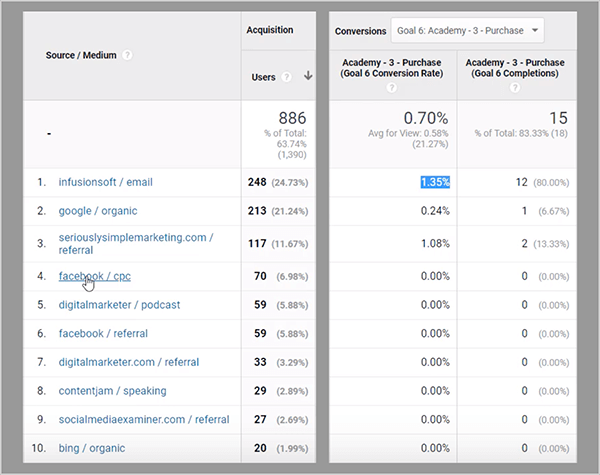
Completion: When you look at the completion goal, which is the purchase page, email continues to convert well and generates the most sales (1.35% conversion rate and 12 completions). The Serious and Simple Marketing website is the other main traffic source driving sales (1.08% conversion rate and 2 completions). The only other source, which made 1 sale, is google/organic (0.24% conversion rate).
Although the Facebook campaign did an excellent job of making people aware of the Measurement Marketing Academy, this audience dropped off at the engagement goal, and no one who visited the cart made a purchase. Based on this data, you might determine that this audience needs more education about the product's value before they'll consider a purchase.
To improve this campaign, you might change the funnel so that Facebook generates email leads instead of sales. This way, the Facebook campaign can continue to do a great job of creating awareness. Then, the email list can provide the bigger story the Facebook audience seems to need because email is a slower, more one-on-one process of building value.
Because the email list does the best job of generating sales, the hope is that email will turn people from the Facebook audience into buyers.
Watch the video:
Conclusion
By tracking awareness, engagement, and completion goals in Google Analytics, you have a framework for gathering insights and making data-informed changes to your marketing funnels. With these changes in your marketing, you can improve your ability to reach your goals.
What do you think? Have you tried tracking different types of goals in Google Analytics? How did it work for you? Please share your thoughts in the comments.

Curious About How to Use AI?
Our newest show, AI Explored, might be just what you're looking for. It's for marketers, creators, and entrepreneurs who want to understand how to use AI in their business.
It's hosted by Michael Stelzner and explores this exciting new frontier in easy-to-understand terms.
Pull up your favorite podcast app and search for AI Explored. Or click the button below for more information.
