 Do you manage multiple social media profiles for your business?
Looking for an easier way to keep an eye on key social media metrics?
Setting up a customized dashboard lets you monitor and report on the performance of your social media platforms in one convenient place.
In this article, you'll discover how to set up a dashboard to track key social media metrics for your business.
#1: Choose a Dashboard Tool
There are a number of dashboard tools available. To select the right one for your business, you'll want to consider cost, make sure the tool integrates with the platforms you use, and explore the interface for ease of use.
Here are four for you to consider:
Dasheroo
Dasheroo lets you create customized dashboards to view everything from Facebook and Twitter to Google Analytics and your email marketing metrics, all in one place. It integrates with more than 27 applications like Facebook, Twitter, Instagram, PayPal, SurveyMonkey, Google Analytics, and more.
If you're on a large marketing team, your group can access the same dashboards and add comments and notes on different metrics you're viewing. It's a great way to improve team collaboration.
With Dasheroo's free plan, you can monitor up to 12 metrics (also known as insights). One of the cool things about Dasheroo is the ability to monitor individual insights. You can also use any of the tool's popular templates or data mashups to compare channels.
If you want more dashboards and insights, upgrade to a paid plan starting at $19 per month.
Cyfe
Cyfe goes beyond social media to connect all of your marketing channels in one robust platform. Cyfe lets you use pre-built widgets for advertising, blogging, email, social media, SEO, and more. It natively integrates with 68 applications.
3 Days of World-Class Training—Zero Travel!

Couldn't make it to Social Media Marketing World and AI Business World this year? Get all of the great content at a fraction of the price with a Virtual ticket.
That’s full access to recordings of every keynote, workshop, and session—the ones people travel thousands of miles to see. Don't wait. Get your Virtual ticket and enjoy actionable content that you can watch anytime, anywhere.
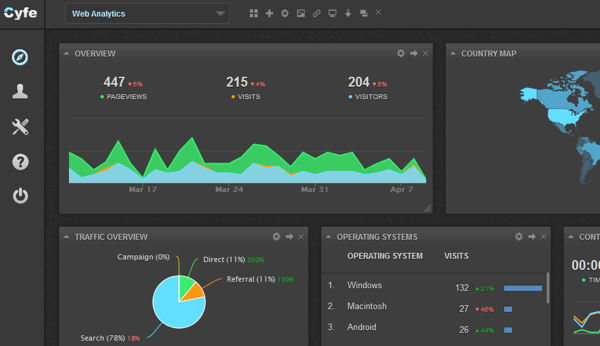
Cyfe's free plan includes up to five widgets. It's perfect for individuals or small businesses that need to track only basic analytics. There's also a premium version that gives you access to unlimited widgets starting at $19 per month.
Klipfolio
With Klipfolio you get real-time access to your business metrics and analytics and can connect to all of the services you use every day. Starting at $24 per month for up to five users, it's a great option for small- to medium-sized businesses.
Raven Tools
A great option for small- to medium-sized businesses, Raven Tools lets teams collaborate seamlessly on SEO, social, PPC, and content marketing campaigns all in one place. Reporting is easy and automated. With prices starting at $99 per month, it's an affordable and effective option for campaign managing and reporting.
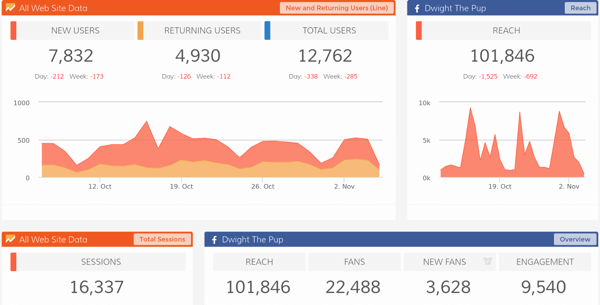
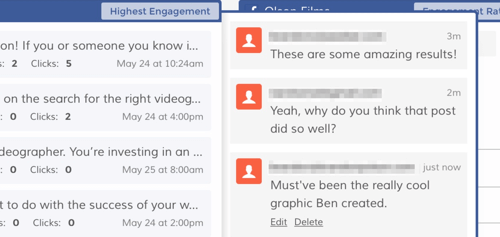
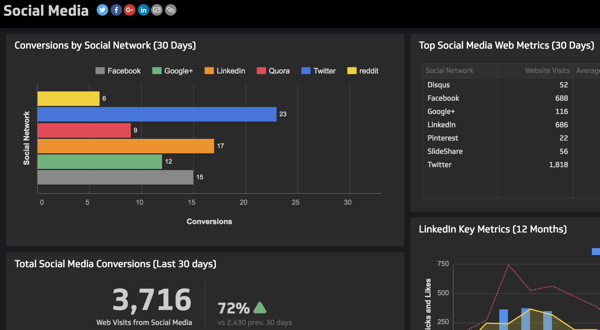
#2: Tie in Facebook Metrics
With Facebook, monitor your page impressions, fan count, new fans, and overall clicks, shares, likes, and comments. Also look at your average daily engagement rate and your most engaging posts.
Add these Facebook insights to your dashboard: overview, engagement rate, and highest engagement. Here's an example of what your Facebook dashboard might look like:
Want to Unlock AI Marketing Breakthroughs?
If you’re like most of us, you are trying to figure out how to use AI in your marketing. Here's the solution: The AI Business Society—from your friends at Social Media Examiner.The AI Business Society is the place to discover how to apply AI in your work. When you join, you'll boost your productivity, unlock your creativity, and make connections with other marketers on a similar journey.
I'M READY TO BECOME AN AI-POWERED MARKETER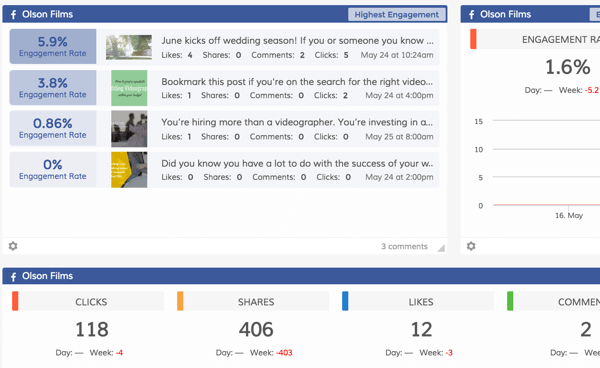
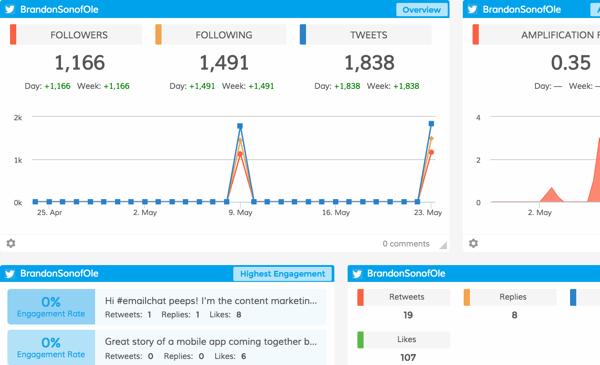
#3: Include Twitter Metrics
If you're using Twitter, be sure to monitor your total number of followers, following, and tweets. Also track your average daily retweets, replies, mentions, and likes, and your most engaging tweets.
Add these Twitter insights to your dashboard: overview, engagement, and highest engagement. Here's an example of what your Twitter dashboard might look like:
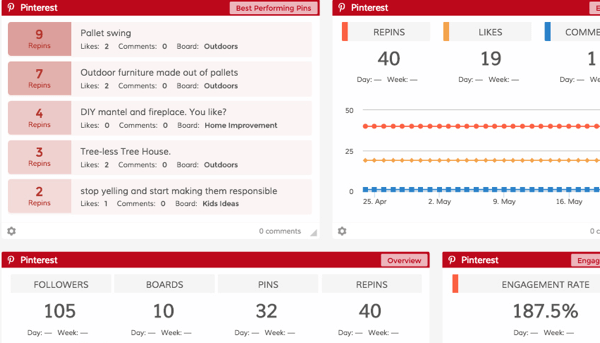
#4: Set Up Pinterest Metrics
For Pinterest performance, you'll want to monitor engagement rate by board, best-performing pins, and overall engagement rate. Also track total repins, likes, and comments, and the total number of followers, boards, pins, repins, likes, and comments.
Add these Pinterest insights to your dashboard: overview, engagement, engagement rate, best-performing pins, and engagement rate by board. Here's an example of what your Pinterest dashboard might look like:
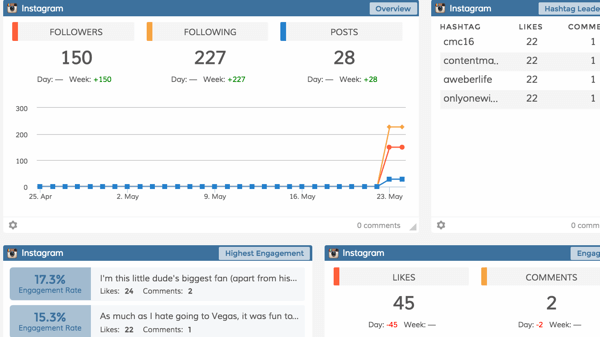
#5: Connect Instagram Metrics
For Instagram performance, monitor your total number of followers, following, and posts. Also track your total number of likes and comments, most engaging grams, and (potentially) your most engaging hashtags.
Add these Instagram insights to your dashboard: overview, engagement, highest engagement, and hashtag leaderboard. Here's an example of what your Instagram dashboard might look like:
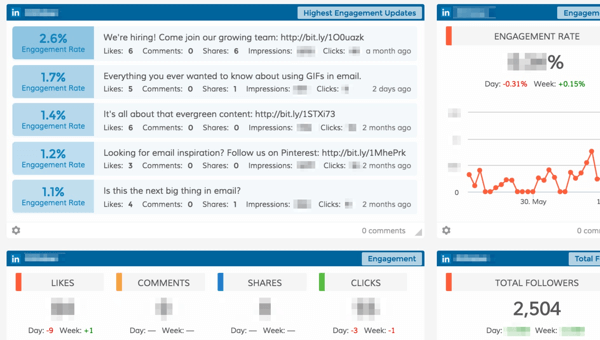
#6: Incorporate LinkedIn Metrics
For LinkedIn performance, keep these metrics on your radar: your overall engagement rate, most engaging posts, and total likes, comments, shares, and clicks.
Add these LinkedIn insights to your dashboard: total followers, engagement, engagement rate, and updates with the highest engagement. Here's an example of what your LinkedIn dashboard might look like:
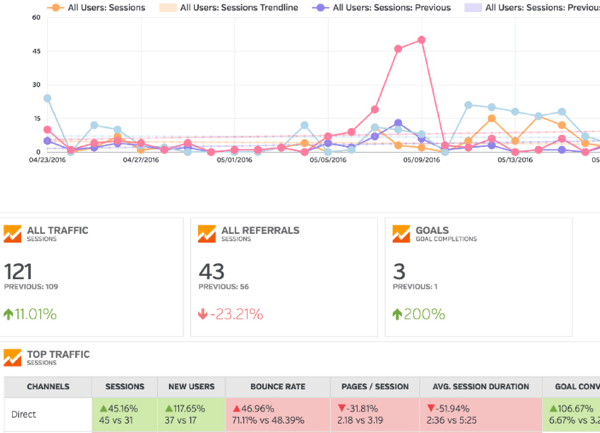
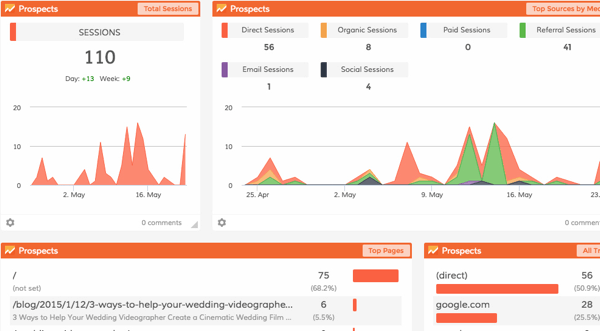
#7: Integrate Google Analytics
With Google Analytics, keep an eye on your total sessions, top pages by sessions, top sources by medium, and top referrers. If you're more advanced and have set up goals within Google Analytics, track goal performance as well.
Add these Google Analytics insights to your dashboard: total sessions, top sources by medium, top pages, all traffic, goals comparison, and goal performance. Here's an example of what your Google Analytics dashboard might look like:
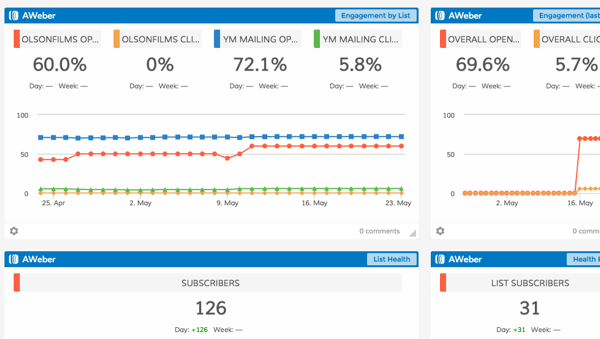
#8: Integrate Email Marketing Metrics
If you're measuring your email marketing performance, keep an eye on your email open and click rates, as well as the health of your email list(s).
Add these email marketing insights to your dashboard: engagement (last 30 emails), engagement by list, list health, and health by list. Here's an example of what your email marketing dashboard might look like:
Conclusion
Dashboards come in many shapes and sizes, which makes them perfect for marketers under time pressure who need to manage multiple accounts. Plus, dashboards are a great way to keep a finger on the pulse of your marketing channels.
Whether you're working alone or as part of a larger marketing team, dashboards help you get more done and improve your marketing efforts. It's all about finding the right tool for the job.
What do you think? Are you using a dashboard? What tools do you like for measuring social media marketing performance? Please share your thoughts in the comments below!

Curious About How to Use AI?
Our newest show, AI Explored, might be just what you're looking for. It's for marketers, creators, and entrepreneurs who want to understand how to use AI in their business.
It's hosted by Michael Stelzner and explores this exciting new frontier in easy-to-understand terms.
Pull up your favorite podcast app and search for AI Explored. Or click the button below for more information.
