 Do you have a content strategy for your Facebook Page?
Want to know which types of content work best?
A deep dive into Facebook Insights helps you identify which content drives people to engage.
In this article I'll share how to find your best content using Facebook Insights.
Why Use Facebook Insights?
Many people are frustrated about the decline in Facebook reach these days. However, when you dive into your Insights, you'll receive a bounty of information about how your content is performing. You may even find that your content is resonating better than you originally thought.
Use Facebook Insights to maximize your sharing strategy. This data helps you stay in touch with the content that's best for your brand, while avoiding the things that don't work.
You can gather some initial information from your basic page Insights. Then dive deeper into your downloaded Insights to see more detailed data about what content is working for you long-term.
Here's how to use Facebook Insights to get the information you need.
#1: Review Basic Insights
If you're seeking your best content, and want a quick and easy way to find it, look at the basic Insights for your Facebook page. To access this data, go to your page and click on Insights at the top.
There are a few key areas to review: Reach, Benchmarks and Engagement.
First, go to the Reach area and take a look at the spikes on the graph, which are the posts with a wide reach. Make a note of them, since these are the ones you'll want to reshare or replicate.
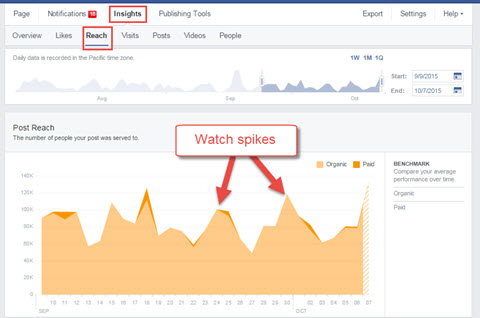
While Reach is a source of irritation to many people, it's not a very important stat. The reason it's so bothersome is that Facebook shows what reach each post gets, and it's out of your control.
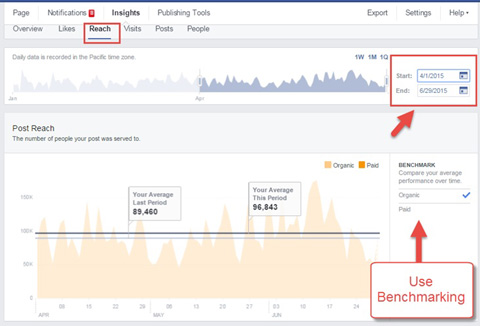
More important than current reach is running experiments to try to improve your engagement. You can then benchmark your results to the previous period to see if your strategy is working.
Get World-Class Marketing Training — All Year Long!
Are you facing doubt, uncertainty, or overwhelm? The Social Media Marketing Society can help.
Each month, you’ll receive training from trusted marketing experts, covering everything from AI to organic social marketing. When you join, you’ll also get immediate access to:
- A library of 100+ marketing trainings
- A community of like-minded marketers
- Monthly online community meetups
- Relevant news and trends updates
When you're ready to do a comparison, search for a specific time period under Reach. That's the best way to see if your new techniques are making a difference for you.
Remember, posts that get a lot of reach are likely also getting a lot of engagement.
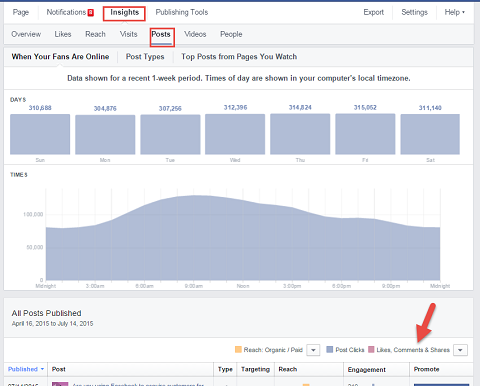
Click on Posts (also under Insights) to check your engagement rate. This is one of the most important stats to monitor.
With basic Insights, you can get a fairly good idea of what articles get the most engagement. However, you'll only be able to look at your posts from the last 90 days, so it's not the big picture. Regardless, it's an easy thing that you can (and should) do regularly.
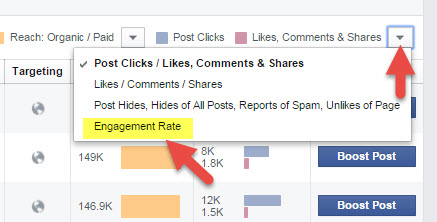
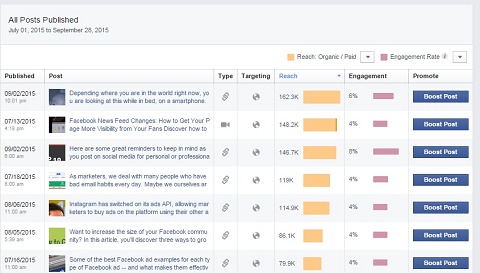
Scroll down to All Posts Published. Then click on Reach.
Switch your view to Engagement Rate. This measures percentage of how many people interacted with your post, based on the people who saw your post. This way you can compare your posts on a more level playing field.
Engagement rate is a truer measure of your audience's interest in your content.
Now compare which of your top posts were more engaging.
Click on the posts with the most reach for more details on clicks, likes, comments and shares. Choose the ones with the most engagement to reshare. Also, use that content as a guide for creating similar posts for your page.
For example, this article by Kim Garst on Social Media Examiner's Facebook page received more than 10,000 link clicks.
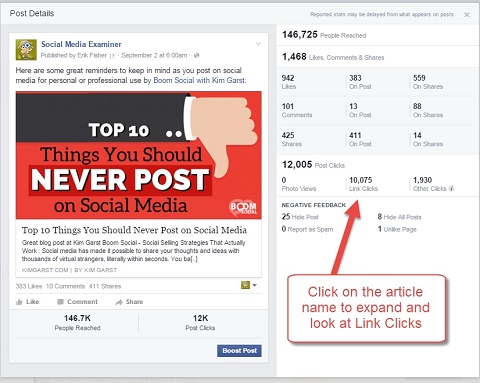
When you see things that are doing well, it's a jumping-off point. When stats reveal that an article is interesting to your audience, it's a message to reshare it and publish similar content.

Discover Proven Marketing Strategies and Tips
Want to go even deeper with your marketing? Check out the Social Media Marketing Podcast! Publishing weekly since 2012, the Social Media Marketing Podcast helps you navigate the constantly changing marketing jungle, with expert interviews from marketing pros.
But don’t let the name fool you. This show is about a lot more than just social media marketing. With over 600 episodes and millions of downloads each year, this show has been a trusted source for marketers for well over a decade.
If you do nothing else with Facebook Insights, monitor the engagement rate of your Facebook posts so you can see what types of content actually drive engagement.
#2: Download Insights Data
If you want to dig a little deeper into Facebook's valuable analytics, download your page's Insights. Then sort and manipulate the data so you can see the information that's most important to you. This is especially relevant if your goal is website clicks, rather than likes, shares and comments, since you can't get that from basic Insights.
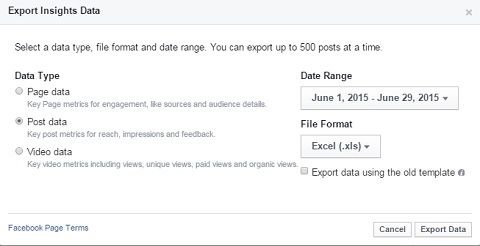
To download your data, go to Insights and click on Export. Select Post Data and choose a date range. The maximum range you can export is 180 days of content or 500 posts, whichever number you reach first. Therefore, if you post several times a day, keep an eye on your numbers. Note where you left off and download the data more often.
When you download the data, you'll get a large Excel spreadsheet with lots of individual tabs on it. This spreadsheet provides the data you need to study your content and improve future posts. You'll want to focus on the Lifetime Talking About This and Lifetime Post Consumers tabs.
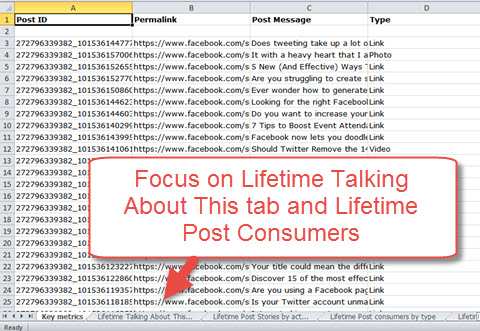
On the Lifetime Talking About This tab you'll see visible interaction, such as comments, likes and shares. On the Lifetime Post Consumers tab you'll see “invisible” interaction, such as link clicks, other clicks, photo views and video views. Don't be discouraged when your posts don't get a lot of likes, comments or shares. Watch the clicks to know if your audience is there.
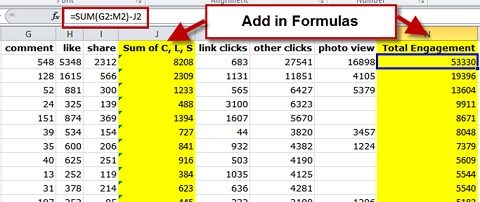
Cut and paste the Post Consumption columns (link clicks, other clicks, photo views and video views) into the Lifetime Talking About This worksheet. Then insert two columns with formulas to get total engagement.
First, insert a column after the comments, likes and shares and enter the formula to add the columns together. For example, if the columns (like the ones below) are G for comments, H for likes and I for shares, the formula would be =SUM(G2:I2). Copy and paste the formula in all of the rows in column J for totals.
Next, add a column with the formula for total engagement, which also includes link clicks, other clicks and photo views. Assuming the rest of columns (as also shown below) are K for link clicks, L for other clicks and I for photo views, the formula, which would go in column N, would be =SUM(G2:M2)-J2. Then copy and paste the formula in all of the rows in column N to get all totals.
Note these formulas are just suggestions. Feel free to adapt them to best find the information you need.
Once you incorporate all of your post engagement on the same spreadsheet, you can see an overview of all of your data and sort it in different ways. For example, sort by link clicks to see which content drives the most traffic back to your website.
You also may want to add notes for your top 50 engaged posts. You can mark if something is from your website or from a third party. You may also mark what type of post it is: image, video, humor, quote, how–to, etc.
Now you have a comprehensive list of traffic generators, as well as what types of posts get a lot of link clicks. Sort by whatever is important to you.
Look at the data and reshare top articles, since you know they got a lot of engagement to begin with. Share the same article at different times the first week. Then, if the content is evergreen, share it every other week or every couple of weeks on your Facebook page.
The other thing you can do is look at popular posts and use them as a starting point for what content to create.
Focus on the Goal
Before you study any of your Facebook Insights, determine what your goals are and then rank them in order of importance. Goals include engagement (comments, likes, shares), website clicks and traffic, email, sales and others.
When you understand your best content and what moves you toward your goal, you can grow faster and go farther. Reshare the articles that are driving traffic or find similar content that gets more engagement overall.
What do you think? Do you use Facebook Insights to improve your sharing strategy? Do you study the basic or downloaded information? What have you learned from your own Facebook Insights? Please share your thoughts in the comments.
Attention Agency Owners, Brand Marketers, and Consultants

Introducing the Marketing Agency Show–our newest podcast designed to explore the struggles of agency marketers.
Join show host and agency owner, Brooke Sellas, as she interviews agency marketers and digs deep into their biggest challenges. Explore topics like navigating rough economic times, leveraging AI, service diversification, client acquisition, and much more.
Just pull up your favorite podcast app, search for Marketing Agency Show and start listening. Or click the button below for more information.
