 Do you need better results from your Twitter marketing?
Want to use Twitter Analytics to guide your efforts?
The data in Twitter Analytics reports can help you identify the content that resonates with your audience, so you can build a more active following.
In this article you'll discover four ways to use Twitter Analytics reports to boost replies, retweets, and other engagement metrics.
Listen to this article:
Where to subscribe: Apple Podcasts | Spotify | YouTube Music | YouTube | Amazon Music | RSS
#1: Tailor Your Content to Audience Interests
Tweeting content that appeals to your audience's interests can draw people to your feed and encourage them to click and share your content.
To get to know your audience, go to your Twitter Analytics and click the Audiences tab at the top of the page. By default, you'll see charts tracking follower growth and demographics. There are five tabs that you can click to see data about your audience, such as what devices and wireless carriers they use.
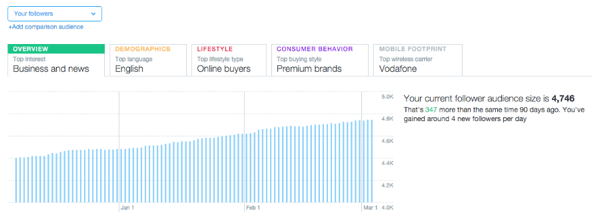
The Interests bar graph, which is available on the Overview and Lifestyle tabs, ranks popular topics and indicates what percentage of your audience is interested in those topics.
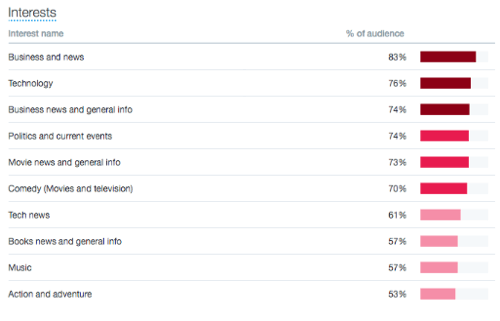
You can find out the interests of users who took part in your campaigns, viewed or interacted with your tweets, and converted on your website. You can also see this data for different personas, such as parents, Millennials, and users with annual incomes greater than $100,000.
Once you understand more about your audience's interests, you can create and curate content that will appeal to them. For example, suppose you're a digital marketer for a social analytics company. When you look at your Twitter analytics, you discover your audience has an affinity for cars. With this information, you create content that breaks down the social profiles of different car brands to identify the best industry practices.
You'll also want to retweet influencers, share articles from niche publications, and develop multimedia posts that relate to topics your audience enjoys. Regularly tweeting content your audience is interested in will not only boost engagement, but also help you grab your followers' attention when they're scrolling the news feed.
#2: Schedule Tweets Based on Your Audience's Location
You can increase clicks, retweets, and comments if you schedule your posts when your target audiences are online and most active.
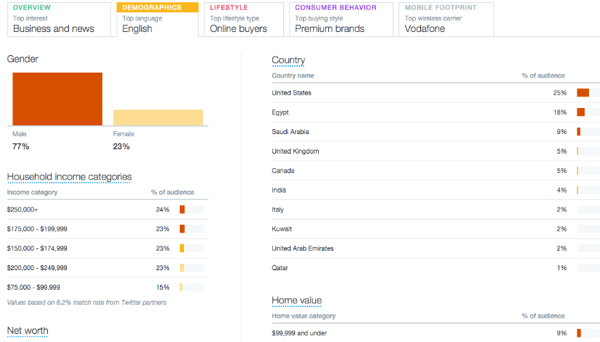
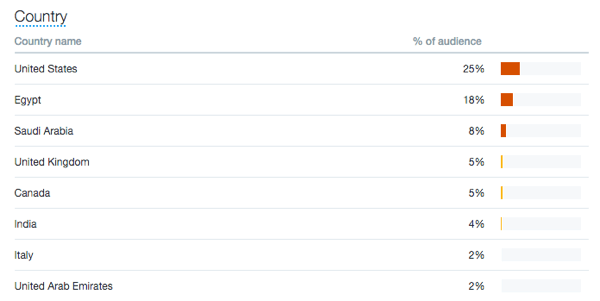
To find out the best times to tweet, click the Demographics tab in the Audiences section of your Twitter analytics. The Demographics report gives you a snapshot of your audience's gender, location, net worth, and more. You'll want to focus on your followers' Country and Region stats. You can also examine this data for audiences you want to pursue.
Have you ever earned higher-than-normal engagement by tweeting in the early morning or late at night? Your location data may reveal you were tweeting during a foreign audience's peak hours. Using this information, you can adjust your schedule to better reach those followers and prospects based on a time zone.
For example, suppose the chart below shows the countries where your followers live. You can see a significant portion of them (18%) live in Egypt, so you may decide to post more often during the country's workday and in the evenings to better connect with that audience.
Which AI Moves Actually Matter?
That's what every marketer is wrestling with now. New AI strategies, new tools, new takes every week — but no clarity. Most marketers and business owners are trying to figure out AI alone.The AI Business Society is your trusted guide. Get expert-led training you can put to work immediately. Plus a community of marketers sharing what's actually working.
I'M READY FOR REAL AI RESULTS3 Days of World-Class Training—Zero Travel!

Couldn't make it to Social Media Marketing World and AI Business World this year? Get all of the great content at a fraction of the price with a Virtual ticket.
That’s full access to recordings of every keynote, workshop, and session—the ones people travel thousands of miles to see. Don't wait. Get your Virtual ticket and enjoy actionable content that you can watch anytime, anywhere.
Experiment with sharing relevant news from a particular region and articles from a region's influencers. If one of your content pieces starts earning a high number of clicks and shares, schedule it throughout the day to reach users in other countries.
Scheduling content based on user location can help you increase engagement numbers and potentially connect with an audience you never knew about.
#3: Tweet Around Events
Share content that relates to holidays, conferences, and anticipated trends to add variety to your Twitter feed. Click the Events tab at the top of your analytics dashboard to see an expanding list of events.
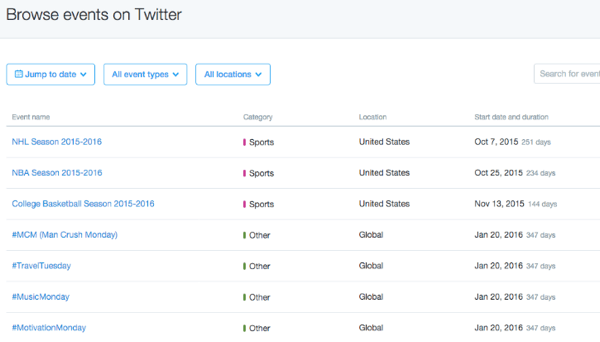
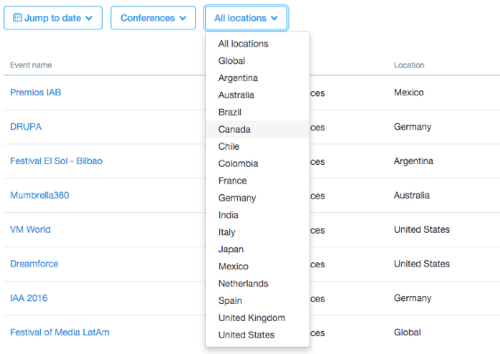
The sheer volume of events on Twitter may seem daunting. Fortunately, you can filter the list by date, event type, and location. Apply filters to determine which events you should tweet about, keeping in mind your target audience's location and interests.
Keep in mind that Twitter is still adding content to this section of its analytics. You should be able to find information about events in large countries and recurring hashtag trends such as #MotivationMonday.
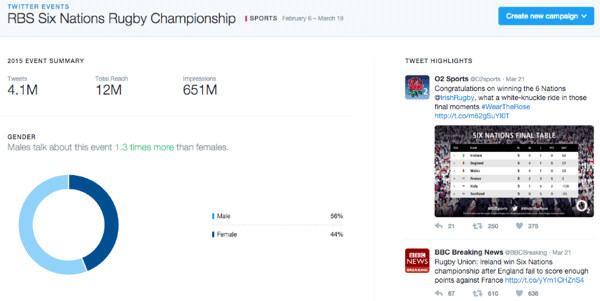
To inspire post ideas, click an event's name to load data about users and high-performing tweets. Depending on the event and audience, the type of content that garners the most interaction will vary. It can range from graphics celebrating holidays to news pieces and topical opinion articles. Be sure to look at the Tweet Highlights to discover popular hashtags to use.
Tip: Capitalize on the hype surrounding annual events by repurposing your tweets and longer-form material from past years.
#4: Replicate Key Characteristics of Popular Tweets
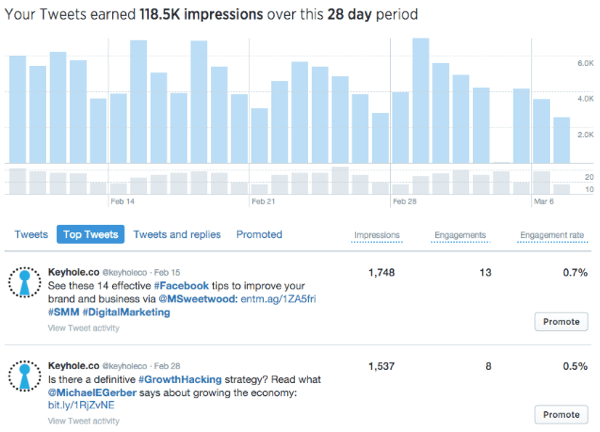
Study tweets with high impression and interaction stats to identify and replicate common qualities that fuel engagement. To access your top tweets, click the Tweets tab at the top of your analytics dashboard.
You'll see a Tweet Activity overview listing impressions, engagements, and engagement rate (engagements divided by impressions) for each tweet. Click the Top Tweets tab to rank tweets by impressions.
Next, you want to assess your best tweets and look for common characteristics. Ask yourself these questions about each tweet:
- What tone does the tweet use?
- What hashtags are included?
- Are there videos or images?
- What is the call to action?
- If there's a link, is it at the beginning or end of the tweet?
- When was the tweet posted? (Click View Tweet Activity.)
Create and schedule tweets that use some of the common themes you notice about your top tweets. Wait 24 hours and then check your Twitter analytics to see how the tweets performed. Repeat the process until you pinpoint qualities that consistently encourage follower interaction.
The goal of this analysis is to hit home runs with your tweets, rather than blindly swing at the ball.
Conclusion
Using Twitter analytics to inform your social strategy will help build a more engaged following. Event, audience, and top tweet data can offer ideas for click- and share-worthy content.
The free analytics dashboard is easy to use, allowing you to quickly locate and study important data. Click through the dashboard to see which metrics you can use!
What do you think? Do you regularly review your Twitter analytics? Have any insights helped you boost engagement? Do you use other analytics tools? Let us know in the comments below!


Curious About How to Use AI?
Our newest show, AI Explored, might be just what you're looking for. It's for marketers, creators, and entrepreneurs who want to understand how to use AI in their business.
It's hosted by Michael Stelzner and explores this exciting new frontier in easy-to-understand terms.
Pull up your favorite podcast app and search for AI Explored. Or click the button below for more information.
