Are your Instagram stories helping you reach your business goals? Wondering how to dig deeper into your Instagram stories' performance?
In this article, you'll learn how to combine Instagram Insights and Google Analytics to better report the ROI from your Instagram stories.
Why Combine Instagram Insights With Google Analytics Data?
From a social media marketing standpoint, it's important to know whether the time you put into your Instagram stories is helping you reach your business goals. However, proving the return on investment (ROI) of your efforts may seem like a daunting task.
Instagram and other social media apps offer detailed insights or analytics that measure in-app activities such as reach, impressions, and engagement. And while this data is helpful, individual platforms tend to measure the impact of your presence on their channel and how your audience responds to you on that channel.
For Instagram, website clicks and swipe-ups are important metrics to track to assess your audience's behavior on the platform, but what happens when those people swipe up and get to your website? How many will make a purchase or sign up for your email list?
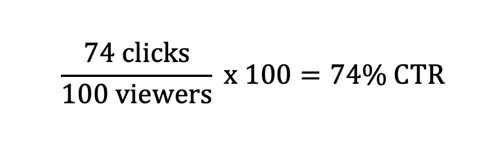
For either metric, you want to pay close attention to the click-through rate (CTR), which is the percentage of viewers who followed through on your call to action to click or tap on a link. For instance, if 100 people viewed your Instagram story and 74 of them swiped up to the corresponding website, your story would have a 74% CTR.
CTR is essential for measuring the effectiveness of your copy, and engagement is crucial for measuring growth on a channel. But neither the CTR nor the engagement rate will help you measure the overall impact a channel has on your marketing goals. That's where Google Analytics comes in.
Combining your Instagram Insights data with Google Analytics can give you a clearer picture of your Instagram Stories ROI. Use the native insights to measure your impact on your audience, and use Google Analytics to measure the impact of strategy on your goals. Here's how to get started.
#1: Analyze Preliminary Story Performance With Instagram Insights
Instagram Insights provides detailed information about how your audience interacts with your stories. Use this information to monitor engagement and growth as you shape your Instagram strategy.
Note: To access insights for your stories, you need to have an Instagram business account. If you haven't already converted your Instagram account into a business account, you need to do that first.
You can access your stories insights two ways: through the Insights option from your business profile and through the stories themselves.
Access Stories Insights From Your Profile
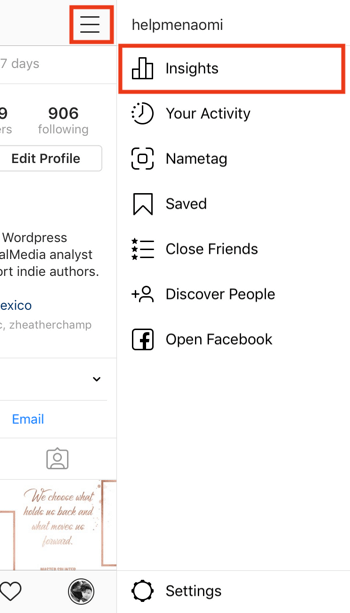
To access insights from your profile, tap the menu icon at the top right of your screen. Then tap the Insights option.
Which AI Moves Actually Matter?
That's what every marketer is wrestling with now. New AI strategies, new tools, new takes every week — but no clarity. Most marketers and business owners are trying to figure out AI alone.The AI Business Society is your trusted guide. Get expert-led training you can put to work immediately. Plus a community of marketers sharing what's actually working.
I'M READY FOR REAL AI RESULTSWhen the Insights screen opens, tap the Content tab.
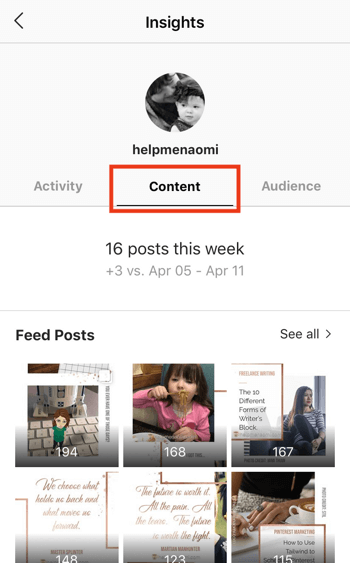
Here you see an overview of individual post performance. Scroll down to look at your most recent stories.
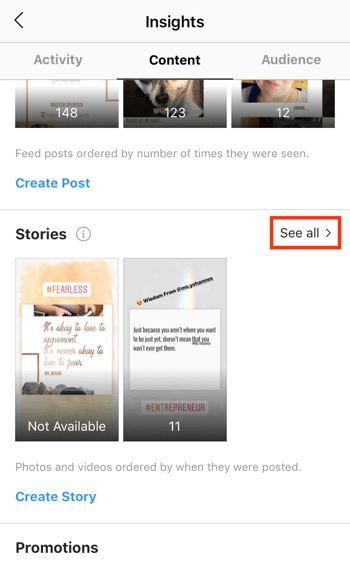
Tap on See All to see an overview of all of your stories and the impressions they've received. This screen shows the Impressions at a Glance view by default.
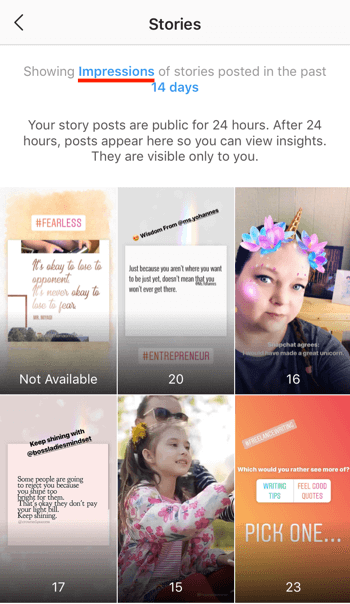
To filter the stories data you see, tap on the Impressions link and choose a different metric from the pop-up. You can also change the timeframe to view information from the past 24 hours, 7 days, or 14 days.
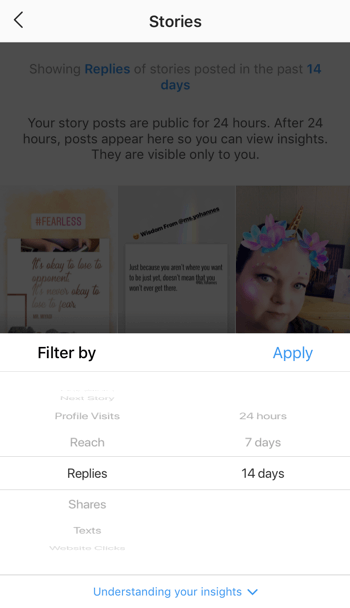
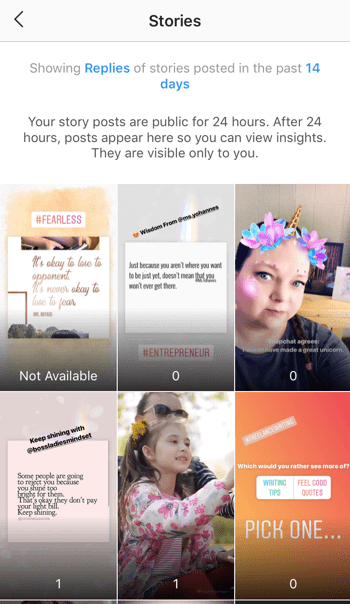
After you tap Apply, you see stories data for the new metric.
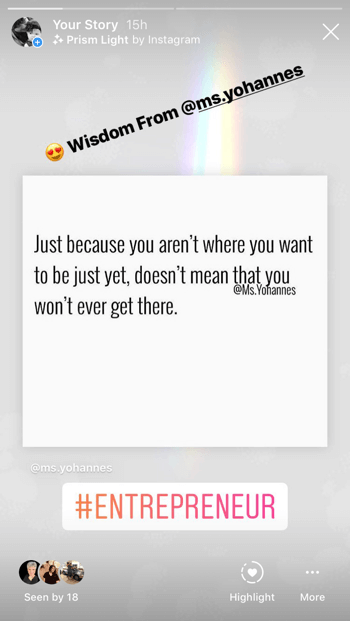
Get Detailed Insights for Individual Stories
You may have noticed that accessing stories insights from your profile doesn't include a lot of detail. To get a more comprehensive look at how a specific Instagram story is performing, open the story. Sometime within that 15-second window, swipe up to see the available Insights for that story.
Note: If the story has already been archived, you'll need to access it through your archives instead of through your profile. To do this, tap the clock icon in the top left of the screen.

On the insights screen, the Interactions section shows data about which actions your audience is taking when engaging with your story. Here's a rundown of these metrics:
- Replies: The number of direct messages sent to your inbox through your story
- Sticker Taps: The number of times someone tapped on the hashtag, mention, or location sticker from your story
- Profile Visits: The number of people who have visited your profile from your story
- Swipe-Ups: The number of people who swiped up on your story to follow the included call to action (available only to business accounts with more than 10,000 followers)
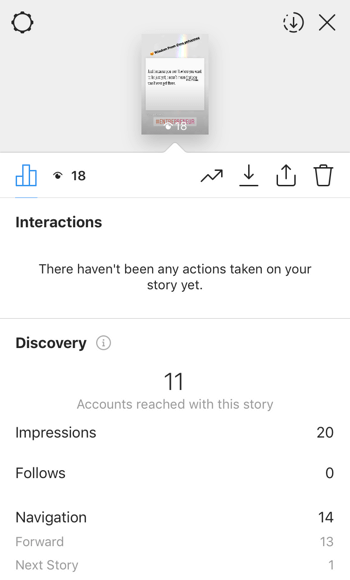
In the Discovery section, you'll find insights about how many people viewed your content and from where:
- Impressions: The number of times your story has been viewed
- Reach: The number of unique accounts that have viewed your story
- Follows: The number of non-followers who followed you from your story
- Next Story: The number of people who tapped to view the next person's story
- Taps Forward: The number of people who tapped to view your next story
- Taps Back: The number of people who tapped back to your previous stories
- Exited: The number of times people left the Stories feed from your story
Instagram also offers suggestions for how you can use the information provided to better understand your audience.
Calculate Your Instagram Story Completion Rate
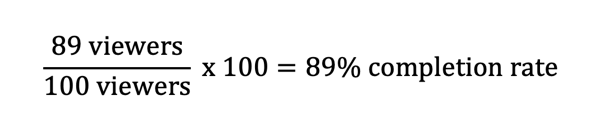
Determining the overall completion rate of your Instagram story will tell you how many people have viewed it in its entirety. It's a fairly simple calculation: Divide the total number of people who viewed the last segment in your story by the total number of people who viewed the first segment. Then multiply that result by 100 to turn it into a percentage.
For example, if 100 viewers watched the first segment and 89 viewers watched the last segment, the overall completion rate is 89%.
By calculating how many people have watched every segment of your story, you can measure your ability to connect with your audience and keep them engaged with you.
#2: Use Google Analytics Goals to Assign Value to Your Website Landing Pages
All of the above Instagram Insights data is important for understanding the impact of your stories on the platform, but if you want to see the impact Instagram has on your overall marketing strategy, you have to use Google Analytics.
3 Days of World-Class Training—Zero Travel!

Couldn't make it to Social Media Marketing World and AI Business World this year? Get all of the great content at a fraction of the price with a Virtual ticket.
That’s full access to recordings of every keynote, workshop, and session—the ones people travel thousands of miles to see. Don't wait. Get your Virtual ticket and enjoy actionable content that you can watch anytime, anywhere.
Log into your Google Analytics account and then navigate to Acquisition > Social to view the different reports available to you.
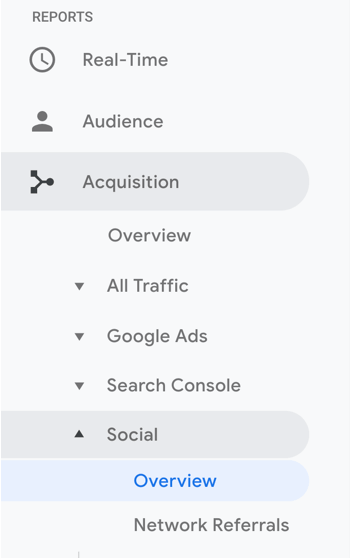
The Social Overview report measures the overall value of the referrals your site receives from social media, which is essential to determining your ROI. However, Google can't start reporting on those values until you set up at least one goal. The goal can be any action you want your audience to perform, such as a newsletter signup, purchase, or webinar registration.
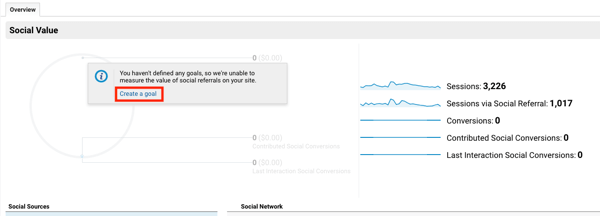
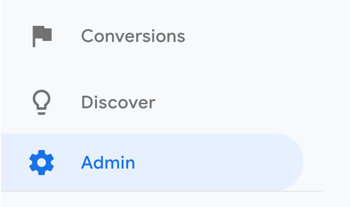
To set up a new Google Analytics goal, click the Create a Goal link (shown above) or click the Admin tab in the left navigation.
On the Admin page, click the Goals tab under All Web Site Data and then click New Goal to create your first goal.

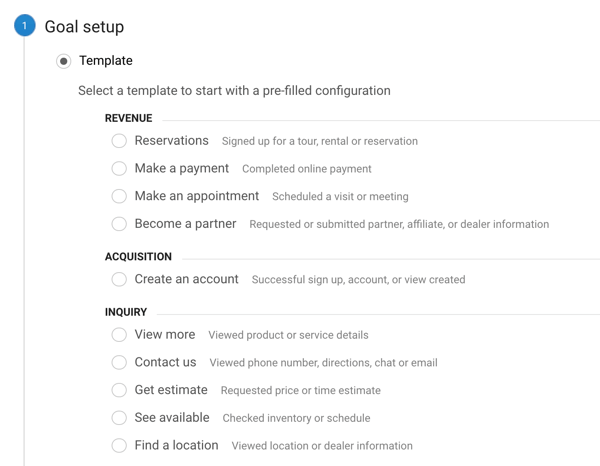
On the next page, follow the onscreen instructions for creating a goal. First, decide whether you want to use a pre-built template (which I recommend if you're new to setting up goals in Google Analytics) or create a custom goal.
After you click Continue, fill in the information about your goal and give it a name. To measure ROI specifically, make sure you choose the Destination type.
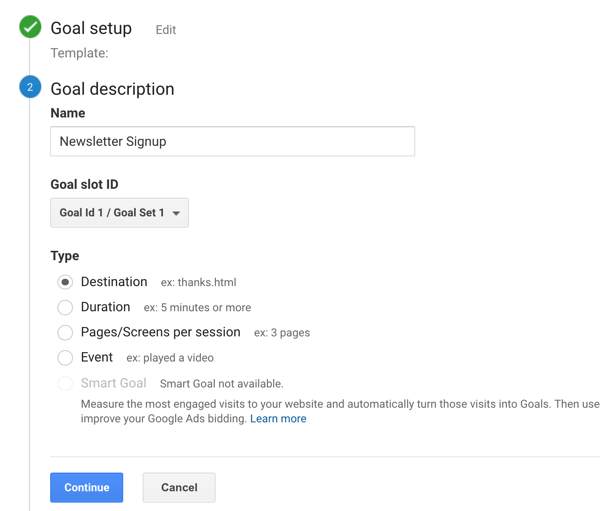
The goal details you provide will help Google know how to track your ROI. For a purchase or newsletter or course signup, enter the URL for the thank-you page (where your audience is redirected after they sign up).
Make sure the criterion for the Destination URL is set to Begins With and not set to Equals To. This setting is important for parameter tracking or for when certain channels add their own tracking codes to links. If you have the Destination set to Equals To, Google will only track results with the exact URL, no parameter tracking.
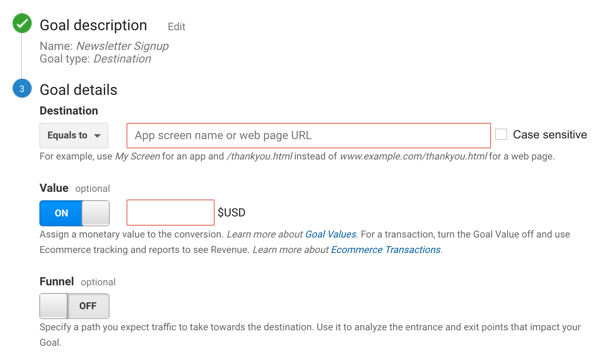
If the purchase or course registration has its own dedicated thank-you page, you can also enter an amount in the Value box. However, enter a value only if the purchase has a dedicated thank-you page. If all of your courses or products go to the same thank-you page after purchase, don't add a value (unless they all cost the same).
Once you've saved your goal, you can return to the previous screen and you'll see that Google Analytics is ready to start tracking your social value.
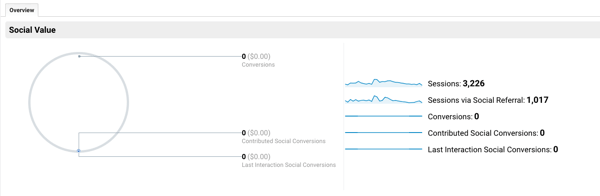
As people follow your calls to action on social media through your online funnel, Google will now begin reporting these conversions on the Social Overview tab.
By setting up your goal, you've also opened up the Social Conversions report, which provides a more in-depth look at how the traffic from your social channels is converting into subscribers, clients, and customers. To open this report, go to Acquisition > Social > Conversions in the left navigation.
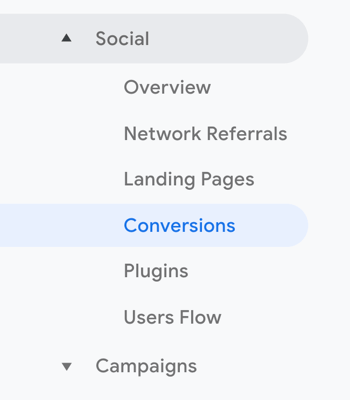
Of course, this report will be empty for now because the information isn't available retroactively. But moving forward, as you drive traffic to your offers, you'll see conversions reports start to populate.
#3: Use Unique UTM Parameters to Reveal Instagram Story Campaign Revenue
If you follow the steps above, you'll have a good idea of how your audience on a specific social channel is interacting with the offers on your site. But you can get even more detailed reports about your traffic with Urchin Traffic Monitor (UTM) tracking codes.
Adding UTM parameters to the URLs you share in your Instagram stories will allow you to track data about a referring campaign. To illustrate, this URL contains five parameters:
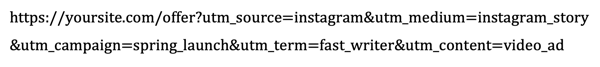
The five parameters are as follows:
- Source: instagram
- Medium: instagram_story
- Campaign: spring_launch
- Term: fast_writer
- Content: video_ad
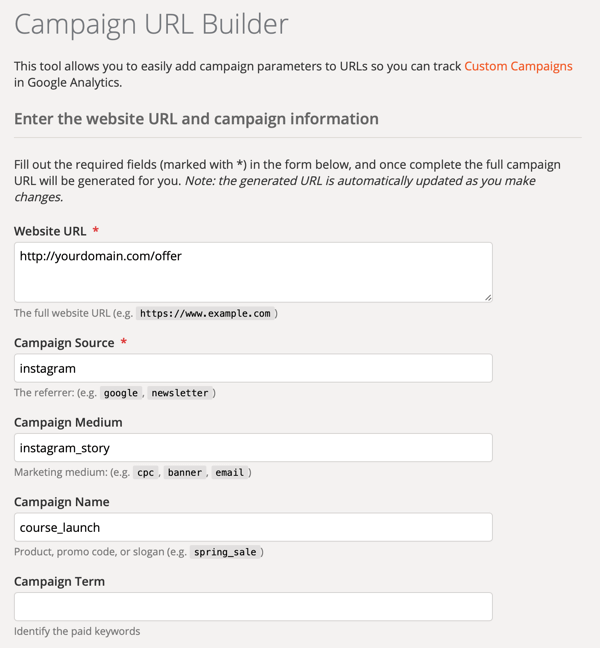
That's a lot of information to pack into one URL, right? Don't worry, you don't have to create UTM codes manually. Google's Campaign URL Builder will do the work for you. When you open this tool, you'll see a form you can fill out to add campaign parameters to your URLs.
First, type in the website URL and campaign source, which are both required fields. Then add as many metrics as are applicable to your needs. The Campaign URL Builder gives you a good breakdown of what each UTM parameter is for and how to use it for your marketing.
Because you're setting up tracking codes to share in your Instagram stories, fill in instagram as the campaign source and instagram_story as the medium, at a minimum. Then depending on what you're doing in your business, add other metrics as needed.
Here are a few ways you might use UTM parameters with links you share via your Instagram story:
- If you're split testing different story types such as live video versus quote graphics, create one link with one type of content and another with the other content parameters.
- If you're offering an exclusive code to viewers via your Instagram story, create a link with a campaign name embedded.
- If you want to test whether promotions run through Instagram Stories convert better on different days of the week, create a link using the Term metric to add in the different days.
After you fill out the form, Campaign URL Builder will generate a campaign URL you can share. If you have an account with the Bit.ly link shortening service, you can shorten the link right there. Use that link in your Instagram story as you create your content.
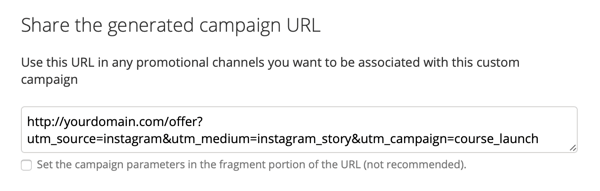
To view the traffic and conversions driven by this URL, go to Acquisition > Campaigns > All Campaigns in Google Analytics. Click the campaign name (course_launch, for example) to reveal the Source/Medium report. Then click instagram/instagram_story.
Conclusion
The real value of your Instagram story isn't how many people replied to it, shared it, or even followed your account after viewing your content. Sure, these interactions are indicative of how well you're connecting with your audience. But ultimately, the real value of your Instagram story is whether viewers follow the link from your story to your website and choose to stay connected with you.
And with the magic of tracking codes, you'll be able to better quantify that value for your social media marketing efforts.
What do you think? Do you plan to use both Instagram Insights and Google Analytics to report on your Instagram Stories ROI? Share your thoughts in the comments below.
More articles on Instagram Stories:
- Discover seven ways to improve Instagram story engagement.
- Find out how to create Instagram stories people love to watch.
- Learn how to use Instagram Stories stickers in your marketing.

Curious About How to Use AI?
Our newest show, AI Explored, might be just what you're looking for. It's for marketers, creators, and entrepreneurs who want to understand how to use AI in their business.
It's hosted by Michael Stelzner and explores this exciting new frontier in easy-to-understand terms.
Pull up your favorite podcast app and search for AI Explored. Or click the button below for more information.
