 Want to increase engagement, longevity, and exposure of your Facebook videos?
Have you explored the data in your Facebook Video Insights?
Whether you're streaming live or recording videos, Facebook provides insights that can help you refine your future videos.
In this article, you'll discover three ways to evaluate and improve your Facebook video performance.
Access Video Insights From Your Facebook Page
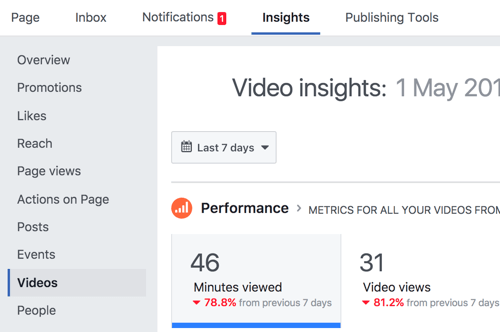
To view and analyze your video metrics in Facebook Page Insights, log into Facebook, head to your page, and click the Insights tab at the top of the page. Then select Videos on the left.
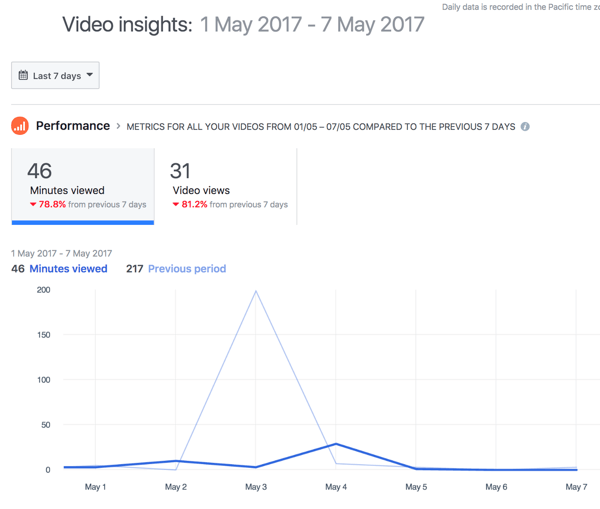
At the top of your video insights, you'll see a performance graph showing minutes viewed and video views for all of your page's videos. By default, the graph shows a comparison of the stats from the past 7 days to the previous 7-day period.
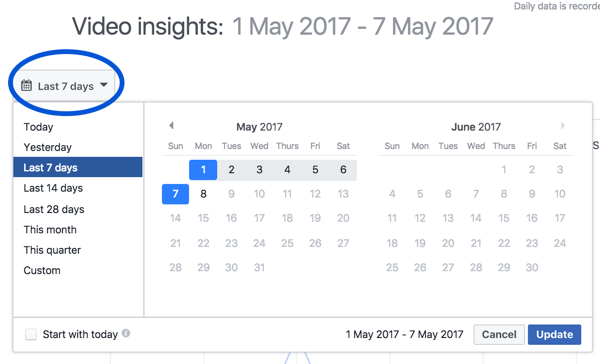
If you want to choose a different time frame, click the calendar drop-down list and select your desired dates. Click Update to apply your changes.
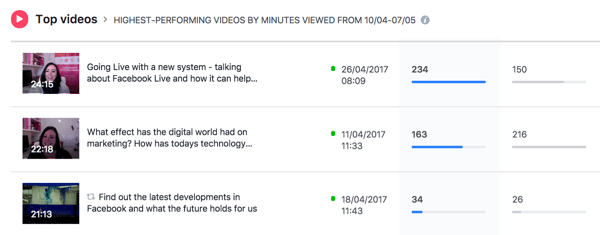
Beneath the chart, you'll see a list of your highest-performing videos for the selected data range.
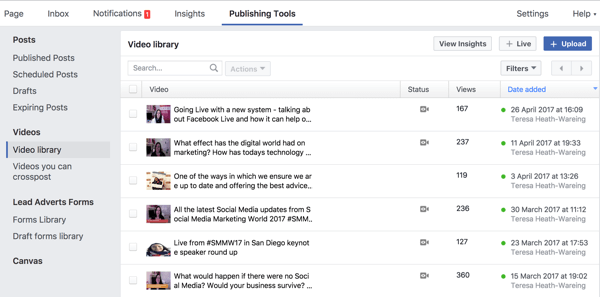
If you click the Publishing Tools tab at the top of the page, you can access your complete video library, which includes all of your videos along with viewer counts. You can also manage and edit your video posts from here. Use the search field at the top to find a specific video.
Now that you know how to access your Facebook video metrics and library, let's look at what you can learn from this data to improve your video content going forward.
#1: Examine View and Watch Time Metrics to Gauge Overall Performance
While getting an overview of video performance as a whole is helpful, you'll also get valuable insights by analyzing the impact of each video individually.
In your video library, click on a video to see performance data for it.
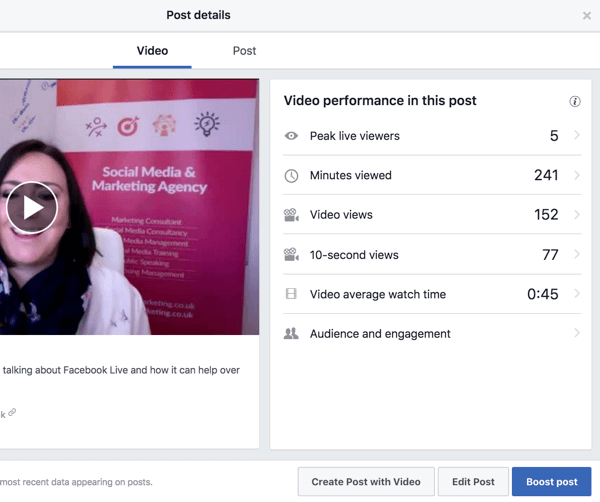
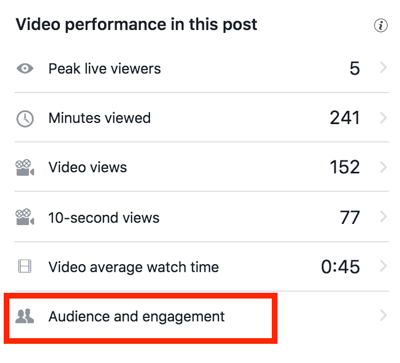
The Video tab shows you these metrics for your video:
Get World-Class Marketing Training — All Year Long!
Are you facing doubt, uncertainty, or overwhelm? The Social Media Marketing Society can help.
Each month, you’ll receive training from trusted marketing experts, covering everything from AI to organic social marketing. When you join, you’ll also get immediate access to:
- A library of 100+ marketing trainings
- A community of like-minded marketers
- Monthly online community meetups
- Relevant news and trends updates
- Peak Live Viewers is the maximum number of concurrent viewers who viewed your live broadcast for at least 3 seconds. This metric helps you gauge how many people are showing up for your live broadcasts.
- Minutes Viewed is the total number of minutes your video was watched, including replays and views less than 3 seconds.
- Video Views is the number of times your video was watched for an aggregate of at least 3 seconds, or for nearly its total length, whichever happened first.
- 10-Second Views is the number of times your video was watched for at least 10 seconds.
- Video Average Watch Time is the average amount of time viewers spent watching your video. Use this metric to assess how long your audience is watching your videos.
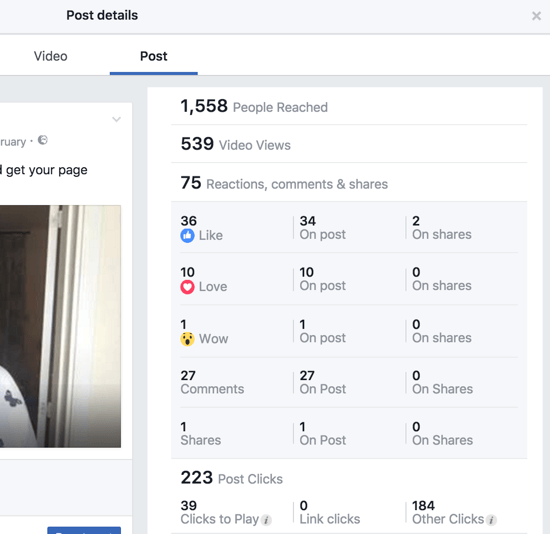
Click the Post tab to see data about interactions with the post itself (i.e., reactions, shares, and clicks).

Discover Proven Marketing Strategies and Tips
Want to go even deeper with your marketing? Check out the Social Media Marketing Podcast! Publishing weekly since 2012, the Social Media Marketing Podcast helps you navigate the constantly changing marketing jungle, with expert interviews from marketing pros.
But don’t let the name fool you. This show is about a lot more than just social media marketing. With over 600 episodes and millions of downloads each year, this show has been a trusted source for marketers for well over a decade.
#2: Delve Into Audience and Engagement Metrics to Learn More About Viewers
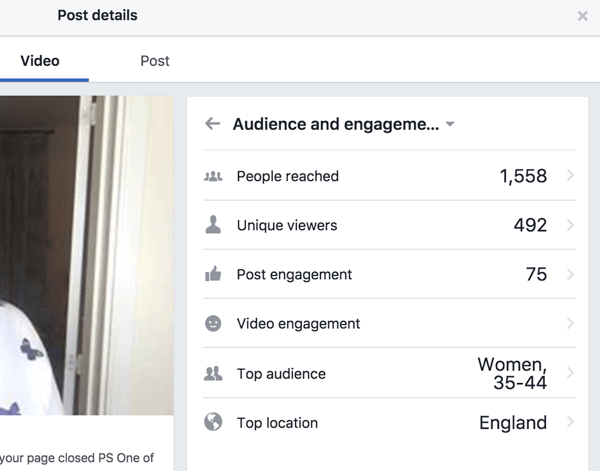
To examine more metrics about viewers and engagement, open Post Details for the video and click Audience and Engagement.
These metrics tell you:
- How many people you reached with your video.
- How many unique viewers watched your video.
- How many viewers engaged with your video.
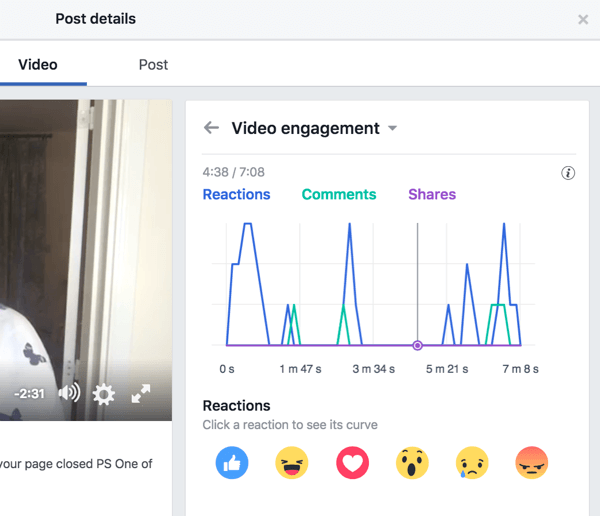
You'll notice engagement is separated into two parts: Post Engagement and Video Engagement. Click Video Engagement to see which reactions your video received and when those reactions occurred during the video.
At what point were viewers compelled to react? What was on screen at that time or what were you saying? Is this a topic you should talk about again?
To see a detailed analysis of which demographic was most engaged with your video, click Top Audience. Facebook breaks down this data by gender and age.
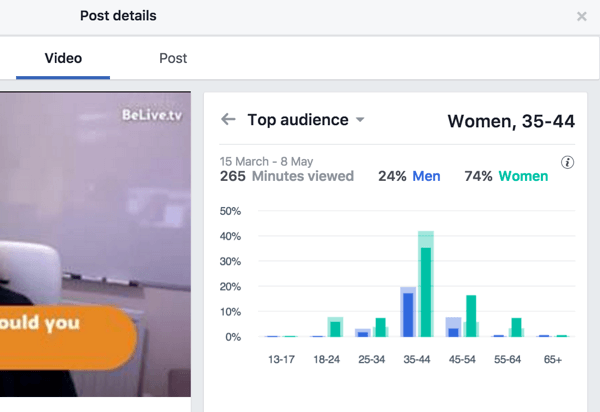
Examining audience and engagement data for your video helps you determine if you're attracting the right audience and gaining worthwhile interactions. There's no point in having thousands of views if you're reaching the wrong people!
#3: Test Organic Video Tactics to Inform Paid Content Strategies
To find out which tactics are working with your Facebook video strategy, do some testing. Start by producing (but not promoting) live videos based on what you already know about your target audience.
Once you've published a few videos, look at your video metrics. Compare the performance of different videos to help determine what's resonating with your audience and the best approach for your paid video content strategies.
Here are a few key areas to focus on:
- Spikes in your stats
- Percentage of viewers who watched with the sound on versus the sound off
- Positive engagement points
- Negative pull-out points
- Feedback via comments, reactions, and shares
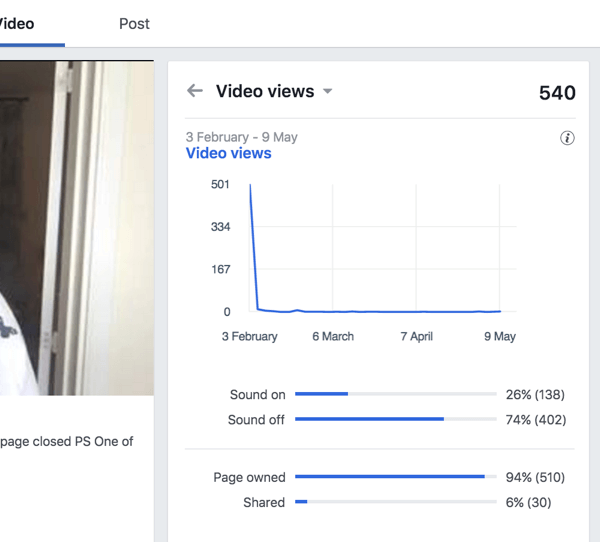
Based on this data, answer the following questions:
- At what point were people most engaged and why?
- When did viewers lose interest and stop watching? What caused them to leave?
- If more people are watching with the sound off, should you be adding subtitles?
- Are there any noticeable negative patterns?
- What similarities do your top videos have?
- Are you doing everything you can to optimize posts, including editing them afterward?
By rolling out your videos to an established audience before attempting to engage a new one, you'll gain valuable feedback without deterring prospective customers and fans.
Your fans are more likely to be forgiving if, say, your sound needs tweaking on-air. But new viewers who don't know you will be quicker to lose interest and unlikely to press Play again.
Conclusion
Facebook Page Insights provides hundreds of valuable stats to assess your video performance. With so much information available, it can be overwhelming and a little difficult to digest it all at first so it helps to look at it in bite-sized chunks.
With time, the most valuable insights will pop right out of the screen and you can use the data to inform your future video marketing efforts.
What do you think? Have you analyzed your Facebook video insights to discover what's working and what's not? Which metric do you find most useful? Please share your thoughts in the comments below.
Attention Agency Owners, Brand Marketers, and Consultants

Introducing the Marketing Agency Show–our newest podcast designed to explore the struggles of agency marketers.
Join show host and agency owner, Brooke Sellas, as she interviews agency marketers and digs deep into their biggest challenges. Explore topics like navigating rough economic times, leveraging AI, service diversification, client acquisition, and much more.
Just pull up your favorite podcast app, search for Marketing Agency Show and start listening. Or click the button below for more information.

