 Is video part of your Facebook marketing strategy?
Wondering how video is working for you on Facebook?
To make informed decisions about using video on Facebook, you need to have a good understanding of how your fans consume it.
In this article you’ll discover three ways to analyze video posts on Facebook.
Listen to this article:
Where to subscribe: Apple Podcasts | Spotify | YouTube Music | YouTube | Amazon Music | RSS
#1: Compare Native Facebook Video Posts to YouTube Video Posts
Let's start by comparing how videos posted natively to Facebook compare with YouTube videos shared on Facebook. You want to see if you get a performance boost by posting natively to Facebook, and if so, how much.
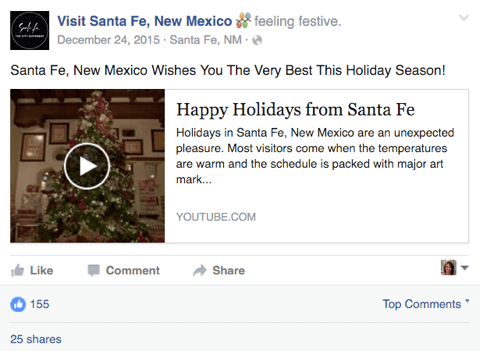
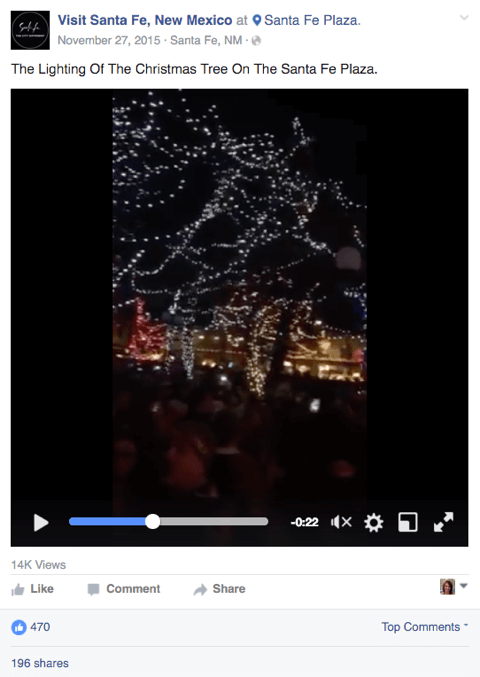
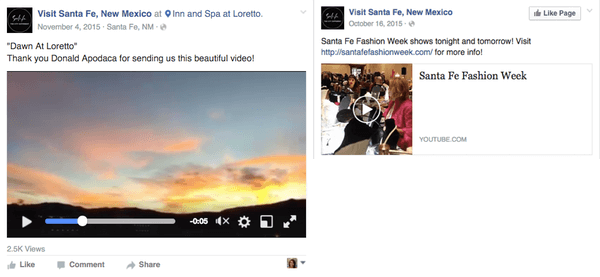
To do this analysis, look at sample data provided by the Santa Fe tourism office for posts from October 1, 2015 through January 3, 2016. They posted a total of 23 videos on their Facebook page during that time. Eight of the videos were uploaded to Facebook natively, and 15 were shared from YouTube.
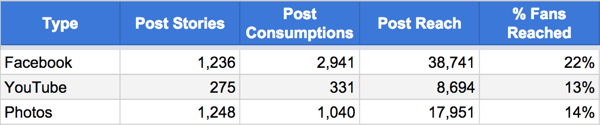
You'll want to compare Post Stories, Post Consumptions, Post Reach, and % of Fans Reached. You can download these metrics from Facebook Insights, and you'll look at the averages of the Facebook and YouTube video posts.
In the chart below, you can see the performance metrics for both the Facebook and YouTube videos.
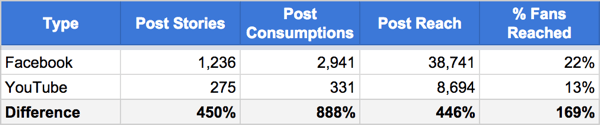
There's a clear, sizable difference in performance between the two video formats. Native Facebook videos performed much better than videos shared from YouTube. While there was some variance in the data for each platform, the Facebook posts beat the average about 50% of the time, while the YouTube posts beat the average only 10% of the time.
There are several possible explanations for performance difference:
- Facebook videos autoplay by default, so they grab viewers' attention in the news feed and result in better performance. The videos may rank higher in the Facebook algorithm, and therefore get more impressions and better reach.
- Facebook gives preference to its own videos in the news feed algorithm. Indeed, Facebook videos include view data while YouTube videos don't. If views are a key metric in Facebook's news feed algorithm, it would be an obvious advantage for the platform.
- Facebook shows the view count for its native videos, which may motivate users to view the video. Video plays are a big indicator on YouTube, and have always been a big part of the user experience.
- Facebook native videos have larger and more impactful thumbnail images than YouTube videos. That can make a big difference in grabbing viewers' attention and convincing them to play the video. Note the high number of Consumptions (video plays, primarily) for Facebook native videos, which suggests more eye-catching images encourage more people to play the videos.
From these metrics, you can conclude that sharing a YouTube video rather than uploading native video to Facebook would cost the organization some engagement and reach.
To see if your business should upload videos natively to Facebook instead of YouTube to maximize their performance, compare your own numbers.

Discover Proven Marketing Strategies and Tips
Want to go even deeper with your marketing? Check out the Social Media Marketing Podcast! Publishing weekly since 2012, the Social Media Marketing Podcast helps you navigate the constantly changing marketing jungle, with expert interviews from marketing pros.
But don’t let the name fool you. This show is about a lot more than just social media marketing. With over 600 episodes and millions of downloads each year, this show has been a trusted source for marketers for well over a decade.
#2: Look at Video Posts vs. Photo Posts
Videos are generally more time-consuming and expensive to produce than photos, so are they worth the investment?
To find out, look at the same video posts you used in the analysis above. Along with those video posts, I also included data for 71 photos posted during the same time period (excluding photos posted to galleries, because the engagement metrics are heavily skewed on those).
Get World-Class Marketing Training — All Year Long!
Are you facing doubt, uncertainty, or overwhelm? The Social Media Marketing Society can help.
Each month, you’ll receive training from trusted marketing experts, covering everything from AI to organic social marketing. When you join, you’ll also get immediate access to:
- A library of 100+ marketing trainings
- A community of like-minded marketers
- Monthly online community meetups
- Relevant news and trends updates
This comparison analyzes the performance of video versus photo content. You'll evaluate the same performance metrics you looked at previously: Stories, Reach, and Fan Reach. These metrics are as relevant for photos as they are for video content. Again, the rows represent the averages for each post type.
If you look at the Post Stories engagement metric, photos performed similarly to Facebook native videos. However, when you get to the reach metrics, Facebook's video platform outperformed photos by a large margin. Keep in mind that the additional reach from video is not only individuals, but also fans of the organization (the people they most likely want to reach).
So what are some possible explanations for the wider reach of video? Far fewer videos are posted on Facebook than photos, so the platform is placing more value on video content due its uniqueness and pushing more impressions that way. Another potential reason is that fans tend to respond better to video content. Videos take more time to consume, so Facebook sends them more impressions.
Do your own comparison to see if your video content produces significantly better reach than other media types such as photos.
#3: Evaluate Long and Short Video
Social media is often considered tailored to those with short attention spans, so how would you expect videos with short and long play times to compare?
To find out, look only at the videos posted natively to Facebook. This allows you to see play-time data, in addition to the Consumption, Stories, and Reach data, as well as to find out how much of the videos people watched, on average.
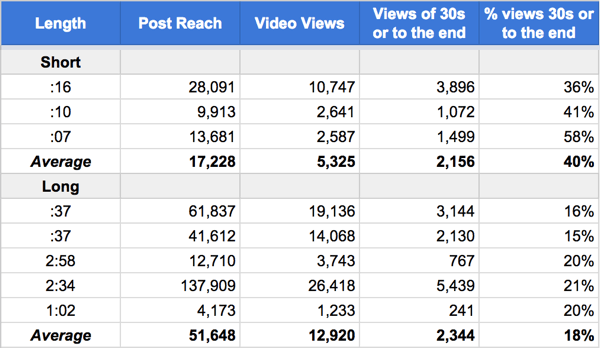
Of these eight videos, five are longer than 30 seconds, and three are shorter. In the chart above, they're broken down into two groups: Short and Long. The sample size is a bit small, so the individual data is also included so you can get a sense of the variance.
First, look at the reach and impressions to see if your audience favors the longer video content or the shorter. Again, Facebook may consider longer video content to be rarer, and thus those videos get more impressions and reach to create more content balance and variety. If you want to get more reach and impressions, Facebook seems to provide that to longer videos.
Next, find out how much of the videos people watch. The data says even for short videos (under 20 seconds), only 40% of viewers made it all the way to end. For the longer videos, it's only 18%. So if you're posting videos and you have an important call to action, make sure you include it at the beginning of the video or cover the offer in the surrounding text.
Then, look at engagement. Again, the longer videos have considerably higher average engagement levels. Keep in mind that the longer videos also received higher levels of impressions and reach. The good news is that if you want to maximize your reach and impressions (something that has been declining for organic content), Facebook seems to reward longer video content with more impressions and reach.
Again, different types of video content generate different levels of activity up and down the spectrum of metrics. If you pay attention to these metrics, you should be able to get more impact where you want it.
Summary
Businesses are using more video content on Facebook, and with that comes new metrics you need to pay attention to. By looking closely at the performance of your video content on Facebook, you should be able to maximize your results.
What do you think? How do you evaluate the performance of your video posts? How do metrics impact your Facebook video strategy? Share your thoughts in the comments.
Attention Agency Owners, Brand Marketers, and Consultants

Introducing the Marketing Agency Show–our newest podcast designed to explore the struggles of agency marketers.
Join show host and agency owner, Brooke Sellas, as she interviews agency marketers and digs deep into their biggest challenges. Explore topics like navigating rough economic times, leveraging AI, service diversification, client acquisition, and much more.
Just pull up your favorite podcast app, search for Marketing Agency Show and start listening. Or click the button below for more information.
