Are you running LinkedIn ads? Wondering how your ads are performing against industry standards?
In this article, you'll discover how to assess your LinkedIn ad campaigns.
4 Important LinkedIn Ad Metrics Explained
One of the biggest challenges with running LinkedIn ads is knowing whether your performance measures up. Competent marketers ask me all the time, “Hey, I'm running LinkedIn ads but I don't know if I'm doing it well.”
This can be a real challenge because LinkedIn ads are expensive. And if you're investing a lot of money in something that's not working for you, that's an expensive mistake you'll need to fix early on.
With any sort of LinkedIn ad campaign, there are a few metrics you want to keep an eye on. Below you'll find explanations for four key advertising metrics:
Click-Through Rate
The first metric to monitor is your click-through rate, or CTR. It's the number of people who took action on your LinkedIn ad (the number of clicks) divided by the number of impressions (the number of times the ad was seen).
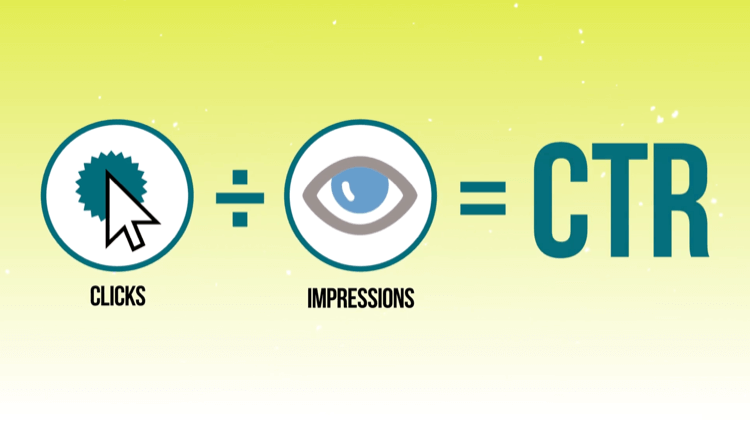
Your CTR tells you how interesting your ads are. If you have a high CTR or a high engagement rate, it means people like your message and are willing to click in on it. Of course, if the CTR is low, you may be missing the mark in how you're attracting or engaging with your audience.
Cost per Click
The next metric is cost per click, or CPC. Certainly how much you pay for a click is not the most important factor but it's a great measurement for understanding how much you have to pay to access a certain audience on LinkedIn.
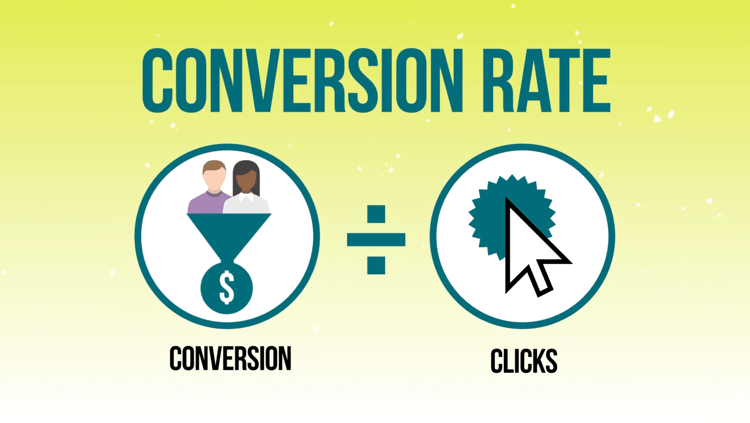
Conversion Rate
The third metric to pay attention to is your conversion rate. A conversion is anytime someone takes the action you want them to. In lead generation, a conversion is usually when someone fills out a form; in eCommerce, it's when they buy something.
So your conversion rate is the number of times that someone has taken the desired action divided by the total number of people who have clicked on that ad.
Cost per Conversion
The last metric to monitor is your cost per conversion. The acronyms you might have heard would be things like CPA (cost per acquisition) or CPL (cost per lead). Each company measures these a little differently. What cost per conversion really means is how much you have to spend in advertising to get someone to take the desired action.
Which AI Moves Actually Matter?
That's what every marketer is wrestling with now. New AI strategies, new tools, new takes every week — but no clarity. Most marketers and business owners are trying to figure out AI alone.The AI Business Society is your trusted guide. Get expert-led training you can put to work immediately. Plus a community of marketers sharing what's actually working.
I'M READY FOR REAL AI RESULTSNow that you understand what the metrics mean, I'll share some average performance metrics you can use to benchmark your own LinkedIn campaign performance.
#1: Performance Benchmarks for LinkedIn Sponsored Content
The most important LinkedIn ad format I use is sponsored content. This is the ad that shows up right inside the news feed. It's a great starter ad format and will probably be the majority of ads you'll want to run on LinkedIn.
The average CTR across all of LinkedIn sponsored content ads is about 0.39% and you can expect to pay around $7 to $11 per click, especially in North America. In locations where LinkedIn isn't as heavily used, your CPC can come down significantly.
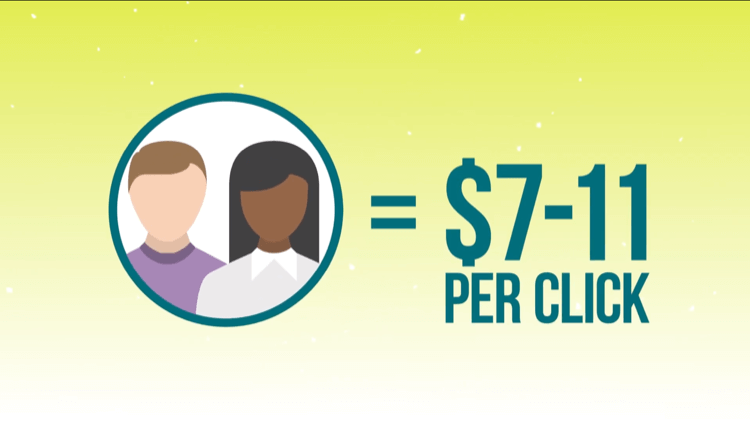
The reasons you might be okay with exceeding this average CPC would be if you're going after a very high-level audience, like CEOs of Fortune 500 companies. You might expect to pay $15 or $20 per click for that. But for the most part, you should be in that $7 to $11 range.
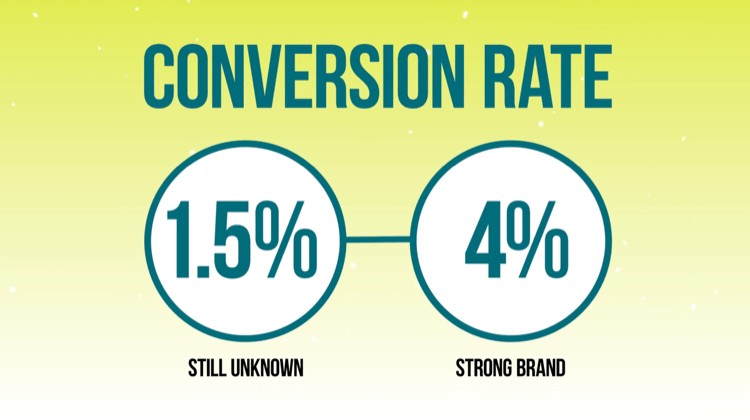
Now let's talk conversion rates for LinkedIn sponsored content. If you're going “right for the kill,” as I call it—right to the bottom of the funnel and asking someone to talk to your sales rep or buy something—this is a cold audience and you're really asking a lot from them. You'll probably have a CTR between 1.5% and 4%—1.5% if no one's ever heard of you before and 4% if you have a really strong brand people are already familiar with.
The approach I generally recommend for cold audiences on LinkedIn is to provide value first through a lead magnet or gated content asset and then ask people for their personal information in exchange.
If I'm offering something of real value, I'm probably going to get in excess of 15% conversion rates. So if my conversion rate is 8% to 14%, I'm probably not providing enough value or haven't effectively pitched the value of my offer on the landing page or inside the ad.
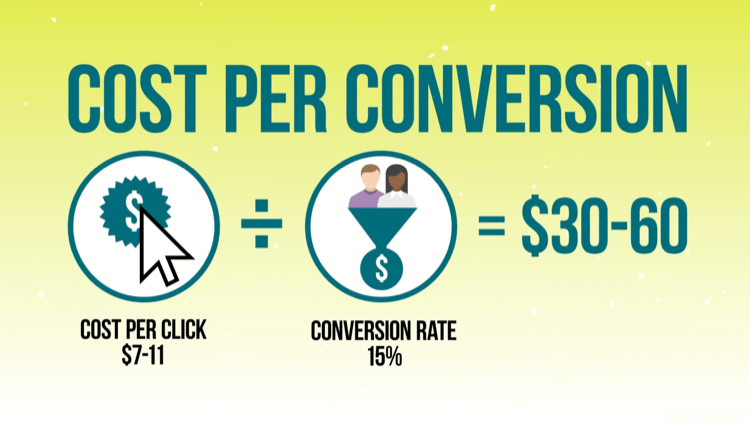
If you're paying $7 to $11 per click and getting conversion rates in this range, your cost per conversion will probably be around $30 to $60. So if you're getting in the $20 to $35 range, you're doing great; keep doing what you're doing. If you're above $75 per conversion, you probably need to tighten some things up.
#2: Performance Benchmarks for LinkedIn Text Ads
Text ads are one of my favorite LinkedIn ad types and they're often overlooked. The reason why they're so great is that they're LinkedIn's cheapest ad format. So if you're looking for really low cost per conversion, this is a great place to start.
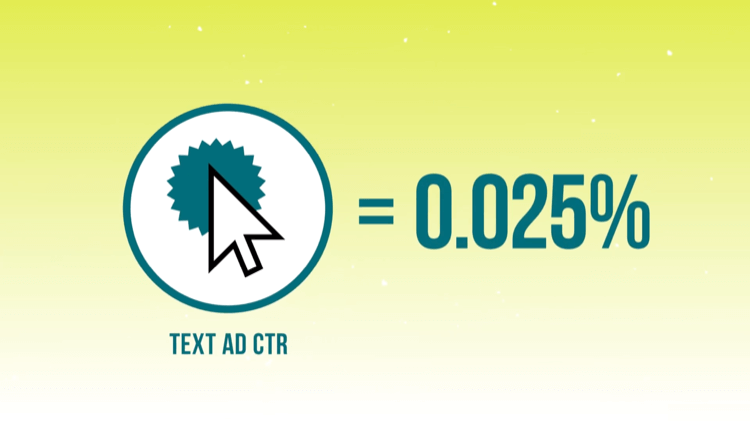
Text ads are challenging simply because they have a really low CTR of 0.025% on average. This means they get 2.5 clicks out of every 10,000 times they're shown. It's really hard to spend a lot of money on an audience unless it's quite large but the clicks you do get from text ads will be fantastic.
It's difficult to significantly outperform using LinkedIn text ads so if you have anything over a 0.03% CTR, you're doing amazingly well. If you fall below 0.025%, pause those ads and try something different.
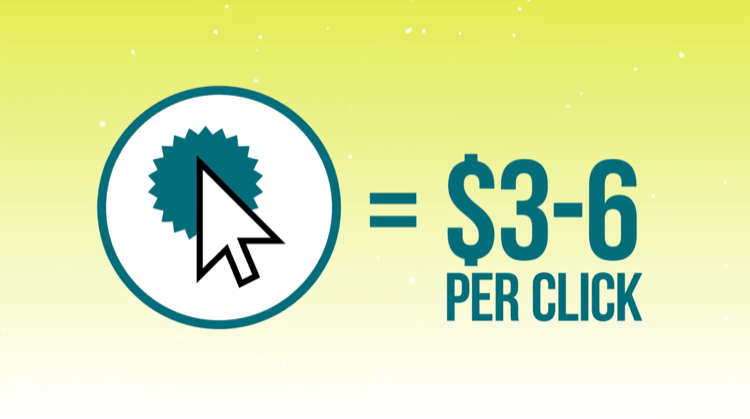
The average CPC on text ads should be $3 to $6. Expect conversion rates on LinkedIn text ads to be slightly higher than the conversion rates I shared for sponsored content because you're targeting people who are sitting at a computer. LinkedIn text ads aren't served on mobile devices.
#3: Performance Benchmarks for LinkedIn Sponsored InMail
Sponsored InMail is different from the LinkedIn ad types above because it adds an extra step. Instead of paying only by the click, you pay just to send your ad to someone with no guarantee they'll see, open, or click on it.
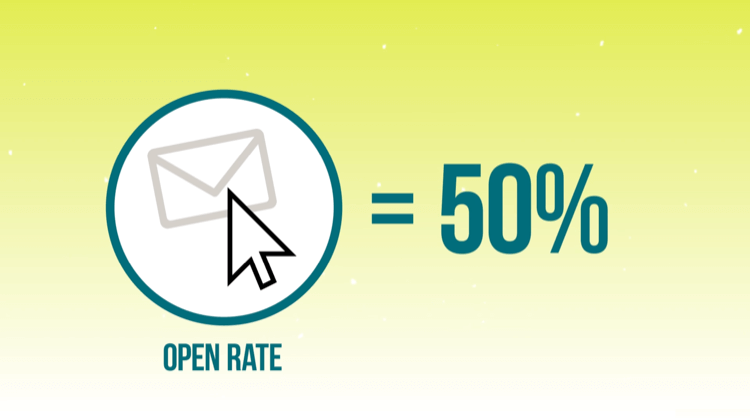
The average open rate of a sponsored InMail is about 50%. So if you pay $0.35 to $0.80 to send it to someone, only about 50% of recipients will open it. And of those who open it, an average of 3% to 4% will end up clicking on the offer inside.
If you do the math, sponsored InMail is LinkedIn's most expensive ad format at an average of about $23 to $58 per click. What makes this ad format so exciting is that you paid to send it to someone anyway so if a large percentage of people take action on it, you can actually get your costs way down. We have clients that are paying less than $2 per click for these ads.
#4: Find and Evaluate LinkedIn Ad Campaign Metrics With LinkedIn Campaign Manager
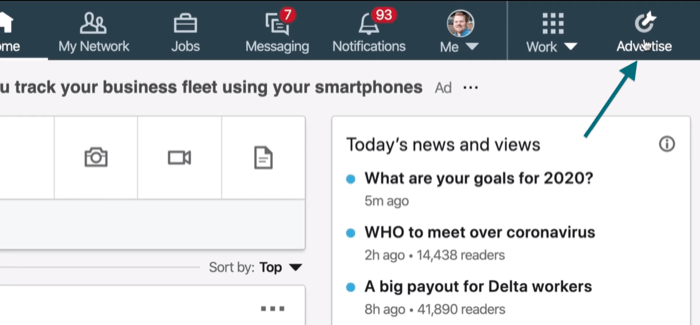
To see all of these metrics for your LinkedIn campaigns, click Advertise in the upper-right corner of the screen. This will take you to linkedin.com/campaignmanager/accounts. From here, click on your account.
3 Days of World-Class Training—Zero Travel!

Couldn't make it to Social Media Marketing World and AI Business World this year? Get all of the great content at a fraction of the price with a Virtual ticket.
That’s full access to recordings of every keynote, workshop, and session—the ones people travel thousands of miles to see. Don't wait. Get your Virtual ticket and enjoy actionable content that you can watch anytime, anywhere.
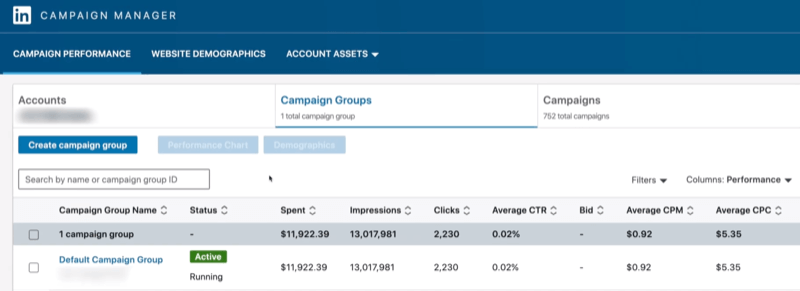
Once you're in the Campaign Manager dashboard, you'll see your default campaign group plus anything else you might have already created.
Text Ad Results
Let's start by looking at the key metrics for a group of text ads.
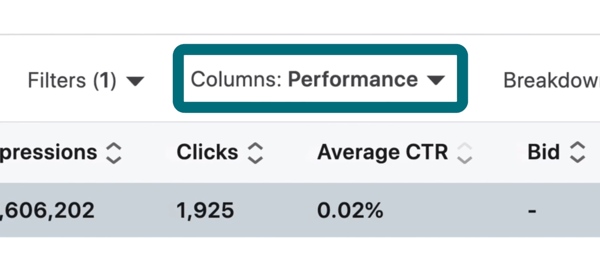
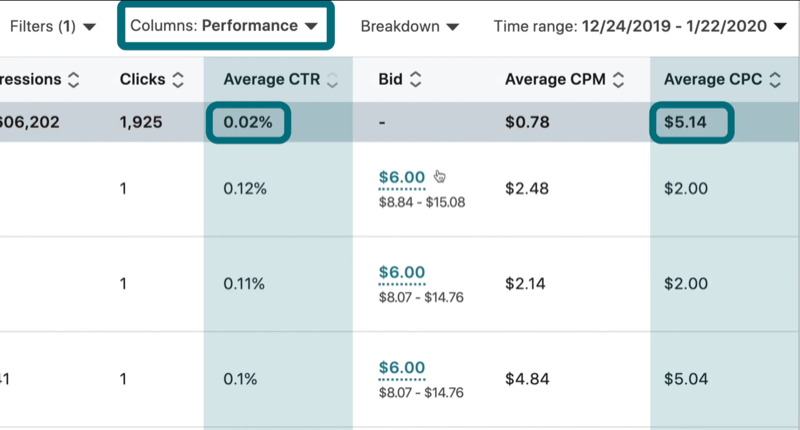
When you're in the dashboard, the default column is called Performance. This is a great place to start because it will show your average CTR and average CPC.
In this example, the average CTR is 0.02% and the average CPC is $5.14. So this account is well within the benchmarks for text ads—0.025% and $3 to $6, respectively.
Sponsored Content Results
Now let's look at key metrics for sponsored content.
The average CTR below is 0.37% across the board. As mentioned above, the CTR benchmark for sponsored content is 0.39%.
Two of these sponsored content campaigns are doing pretty well at 0.45% and 0.41%, but the other two are low performers at 0.34% and 0.22%.
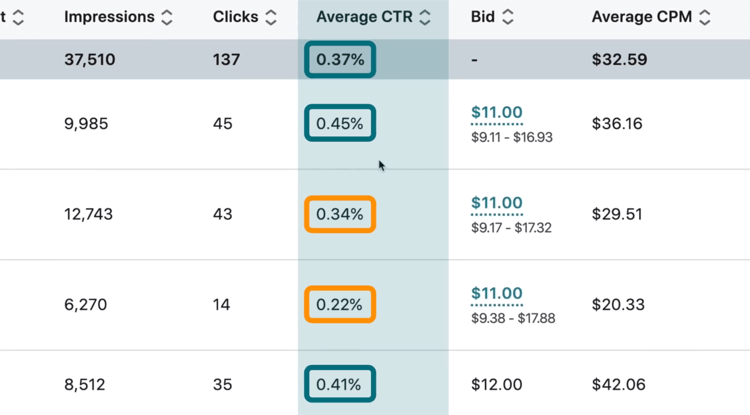
Also look at what your average CPC is. I told you to expect anywhere between $8 and $11, so $8.92 is right within the average.
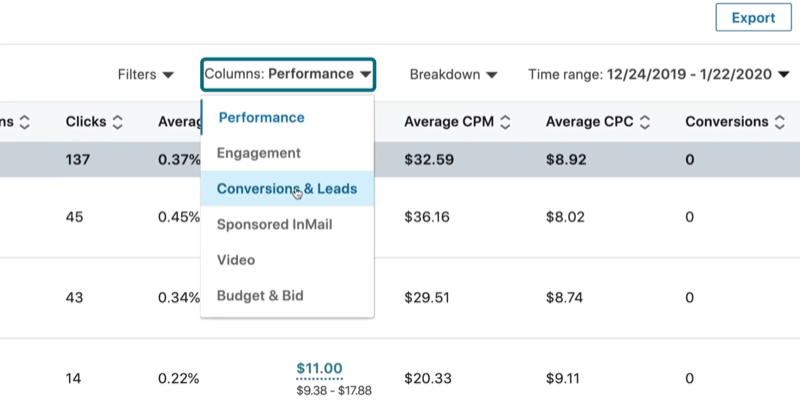
This particular account doesn't actually track conversions within, but if it were tracking conversions, you'd see it in the Conversions column below.

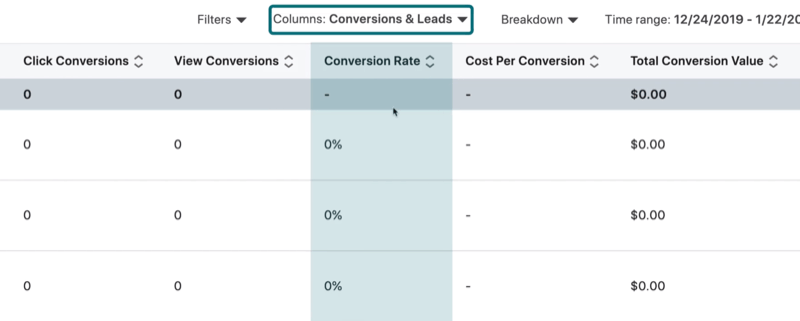
If you want to see your conversion rate, click on Columns and select Conversions & Leads.
Now you can see your conversion rate.
Sponsored InMail Results
With sponsored InMail, it's a little tougher to see what's going on because the metrics feel a bit like they're lying to you.
This time you want to click on Sponsored InMail as the column layout.
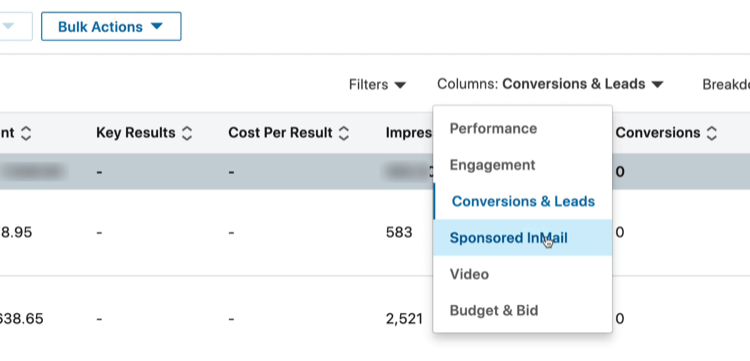
Again, you want to pay attention to your open rate, CTR, and CPC.
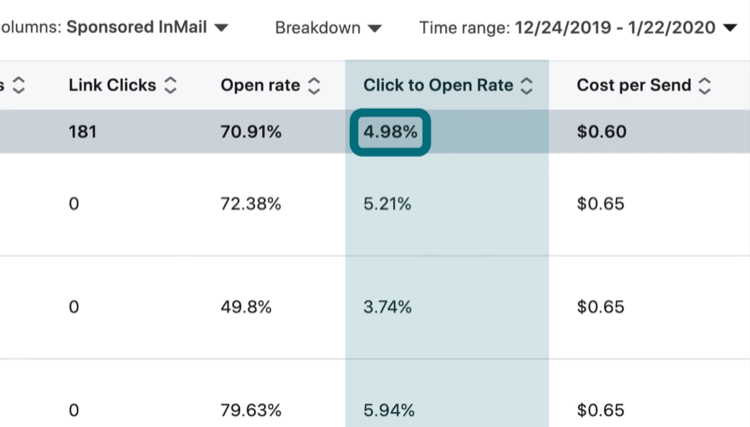
This open rate of 70% is really good. I mentioned earlier that you should expect somewhere around 50%.
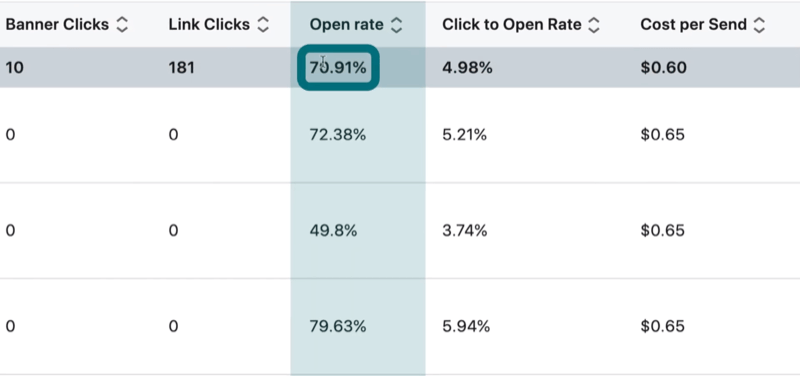
Next, look at your click to open rate. You're looking for 3% to 4% CTR so 4.98% is really good.
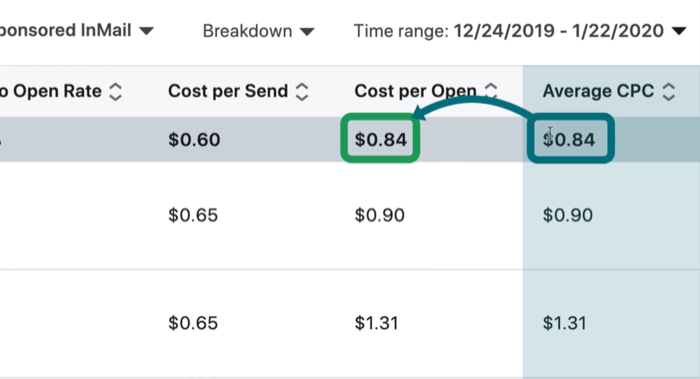
As I mentioned earlier, you pay on a cost per send basis with sponsored InMail so it's helpful to know how much you're paying to access this audience. This cost per send of $0.60 is about where you'd expect.
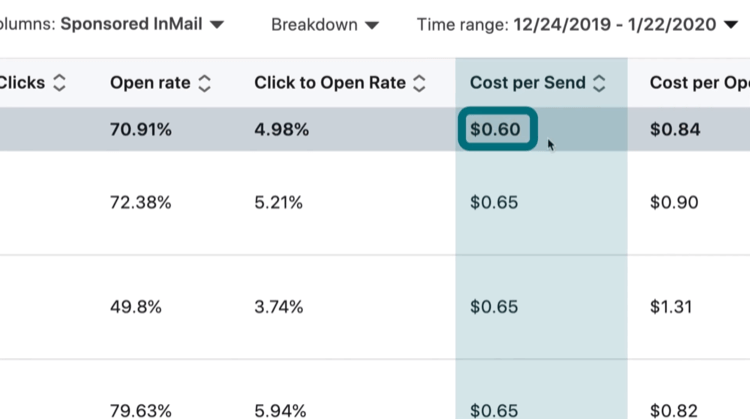
Below LinkedIn is reporting an average CPC of $0.84 but this is overtly wrong; $0.84 is actually your cost per open, as you can see in the column next to it. LinkedIn isn't going to tell you how much your CPC actually is. I assume that's because it's usually really high.
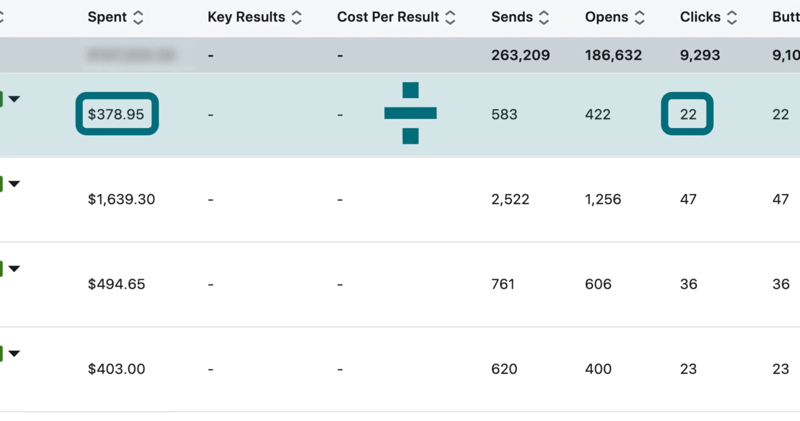
So you have to do the math yourself. For the campaign below, take the total spend ($378.95) and divide that by the number of clicks you got (22). This comes out to a little more than $17, which is really high on a CPC basis. It's helpful to know this calculation so you can see how you're performing compared to your other LinkedIn ad formats.
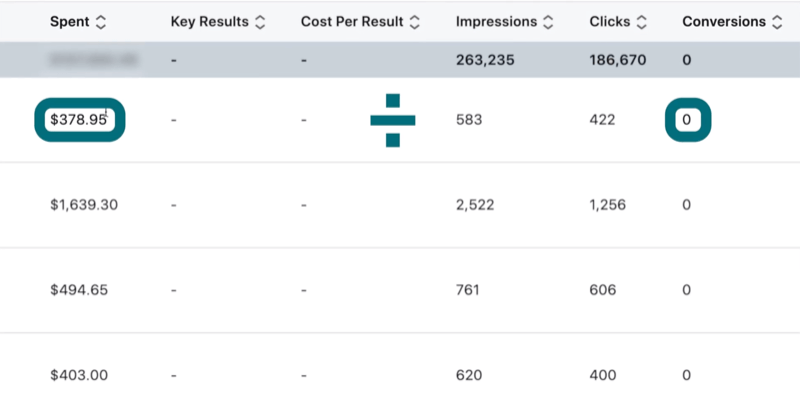
If you're looking at sponsored InMail, you're not going to see conversion data. To see what your cost per conversion actually is, click on Columns and go back to Conversions & Leads.

Now take your total spend divided by the number of conversions to determine your cost per conversion.
Evaluating LinkedIn Ad Performance Over Time
Now let's look at how to use the dashboard to see how your campaign performance changes over time.
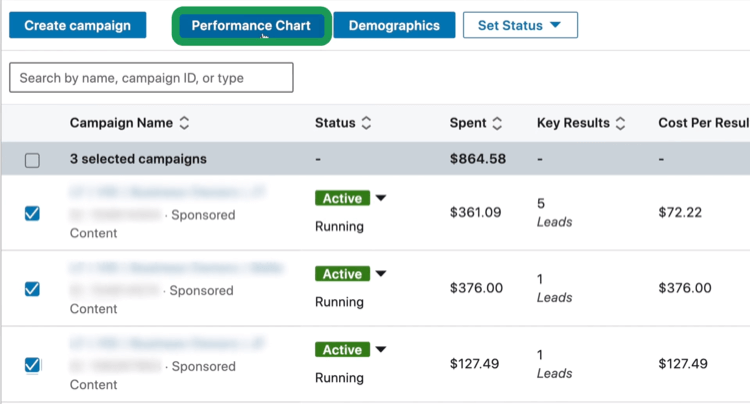
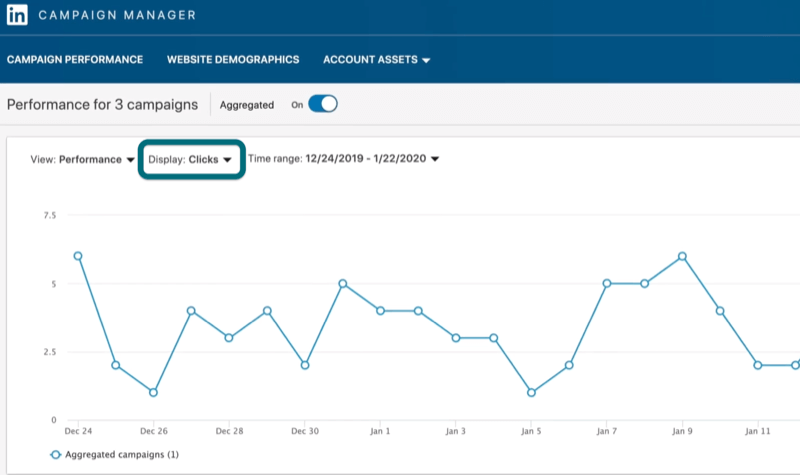
Start by selecting the checkboxes next to the LinkedIn campaigns for which you want to analyze performance. Then click the Performance Chart button.
The performance chart shows how a certain metric changes over the course of the selected time period. The default view shows this data for clicks.
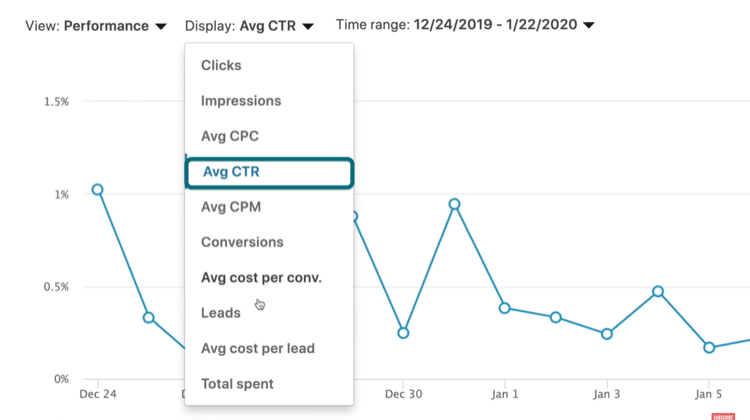
If you select Avg CTR from the Display drop-down menu, you'll see CTR for that time period.
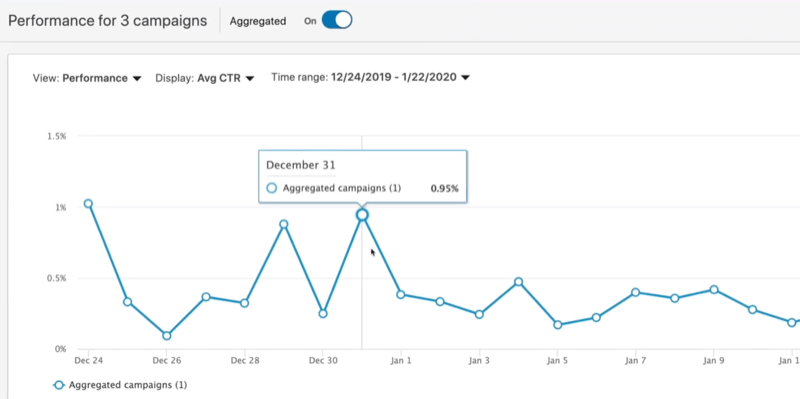
As you review this chart, you may see days where your CTR was very high and others where it's very low. If you see a downward trend happening over time, that might indicate your ads are saturating that audience and it's time for you to change things up.
Also look at Avg Cost per Lead if you're using lead gen forms, or Avg CPC if not. If your account doesn't get many conversions, seeing how this data changes over time may not be very helpful; however, with a lot of conversions, it will become much more interesting.
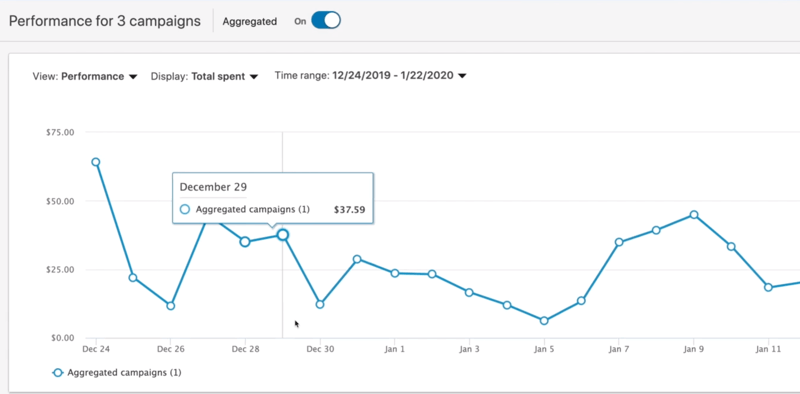
If you select Total Spent from the drop-down menu, you can see how much you're spending each day. This can help you figure out what your budget will look like by the end of the month.
Finally, select Avg CPC to see what happens to your CPC over time. It may rise if you have more competition coming into the market. Or maybe your ads are just getting a lower CTR. Watch this metric to see in what direction your CPC is heading.
Watch the Video:
Conclusion
Now you know the four key metrics you should measure to evaluate your LinkedIn campaigns. As you review this data in your dashboard, see how your CTR, CPC, conversion rate, and cost per conversion stack up to the average performance benchmarks for each LinkedIn ad type.
What do you think? How do your LinkedIn ads compare with these benchmarks? Share your thoughts in the comments below.
More articles on LinkedIn advertising:
- Discover four LinkedIn advertising mistakes and learn how to avoid them.
- Find out how to plan and execute your first LinkedIn video ad campaign.
- Learn how to set up a LinkedIn dynamic ad campaign to deliver highly personalized offers.

Curious About How to Use AI?
Our newest show, AI Explored, might be just what you're looking for. It's for marketers, creators, and entrepreneurs who want to understand how to use AI in their business.
It's hosted by Michael Stelzner and explores this exciting new frontier in easy-to-understand terms.
Pull up your favorite podcast app and search for AI Explored. Or click the button below for more information.
