Do you know whether your Instagram Stories ads are working? Wondering which ad performance metrics to track and where to find the data?
In this article, you'll discover how to analyze Instagram Stories ads data so you can find out what's working and what isn't.
To learn how to analyze Instagram Stories ads, read the article below for an easy-to-follow walkthrough or watch this video:
Note: This article assumes you know how to set up an Instagram Stories ad. Read this article for step-by-step instructions.
Analyzing Instagram Stories Ads in Ads Manager
When you run Instagram Stories ads, you may be surprised to find that you don't have access to the same data that you do when you post stories organically. Everything shows up through Facebook Ads Manager and it's missing some of the key information you might be used to seeing.
You may also be wondering, “Well, there's a Facebook Ads app. Can I use that?” Technically, yes, you can see some of the ads data in that app, but if you really want to get maximum data, you need to look at it on desktop.
There are a lot of numbers in Ads Manager, most of which probably won't apply to you. However, I'm going to show you the data that matters for Instagram Stories ads.
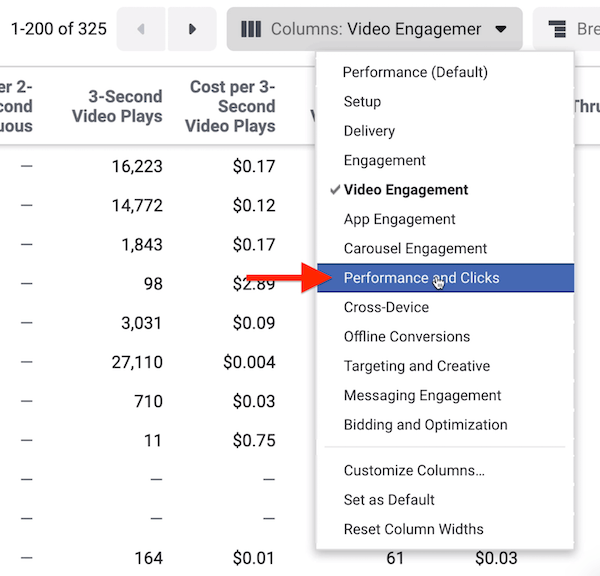
When you first open Ads Manager, you'll see the default view, which probably isn't what you'll want to use to analyze Instagram Stories ad performance. To change the view, click the Columns drop-down menu on the right side of the screen. You'll then see a variety of pre-made reports you can choose from.
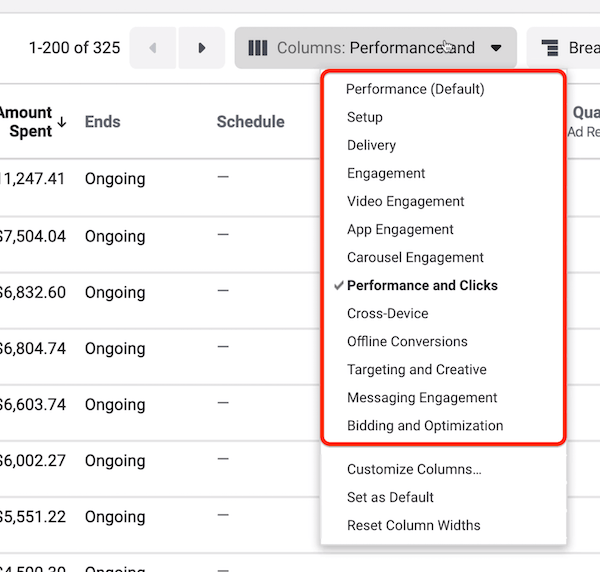
Some of these reports overlap. For instance, if you choose Engagement and then look at Video Engagement, you might see some of the same columns. We'll look at the reports that will be the most useful for analyzing Instagram Stories ads.
Note: The account used in the images in this article will have a lot of large numbers. It's okay if your account isn't this big. I picked it for an important reason, though. We've spent millions of dollars on Instagram Stories ads and the patterns we see also apply to small accounts. The issue is that when an account is small, there's not a lot of data so it can be hard to see those patterns.
#1: View Ad Performance Data by Placement
Assuming you're running your Instagram Stories ads bundled with other placements, all of that data shows up as a single line item, which won't help you see how your story ads are doing. Luckily, you can look at placements separately.
On the right side of the screen, you'll see a drop-down menu called Breakdown. Click it to see different ways you can segment your data to find out how certain pockets are performing.
Which AI Moves Actually Matter?
That's what every marketer is wrestling with now. New AI strategies, new tools, new takes every week — but no clarity. Most marketers and business owners are trying to figure out AI alone.The AI Business Society is your trusted guide. Get expert-led training you can put to work immediately. Plus a community of marketers sharing what's actually working.
I'M READY FOR REAL AI RESULTS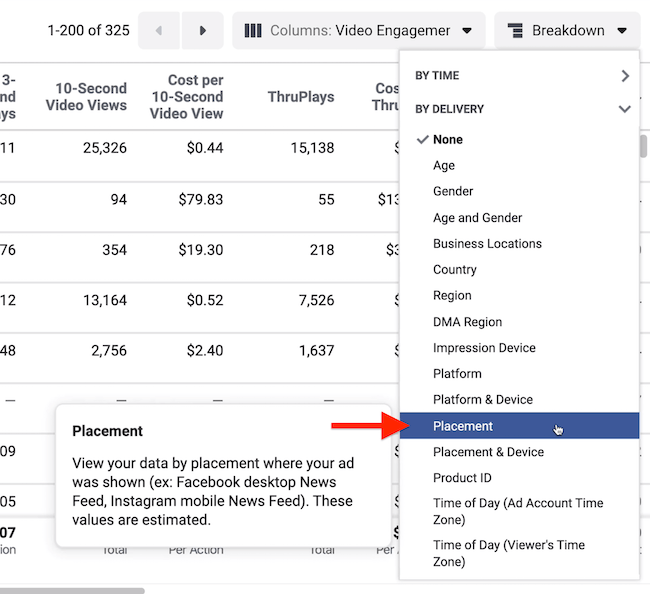
When you select the Placement option, you can see every Facebook and Instagram line item, including Stories. If you don't see Instagram Stories, it could be that you chose not to run there or maybe Facebook just opted out of Stories.
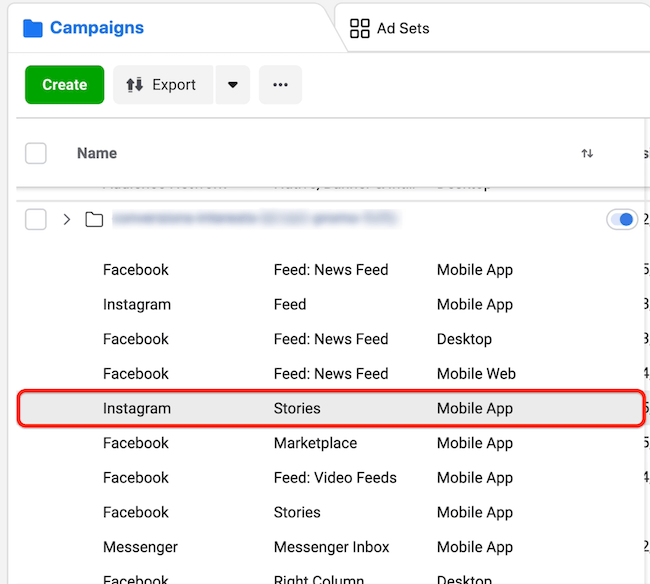
One of the challenges with Stories is that there's not a lot of inventory there. When Facebook is auto-optimizing, it may opt out of Stories because it isn't sure if you're going to perform there. In instances where Facebook isn't favoring you for that placement, you may want to consider running Stories ads separately to get more data.
When analyzing Instagram Stories ad performance, look at the Stories placement relative to what the other placements are doing and what it costs to achieve your objective. To visualize this, if your objective is to get people to watch or interact with your Instagram story ad and not necessarily buy, you don't want to evaluate the ad based on what it sold because that's not its job.
Now that you understand how to break down your ad data by placement, let's look at some reports you'll find useful for evaluating your Instagram Stories ads.
#2: View Engagement to Analyze Instagram Stories Ads for Top of Funnel
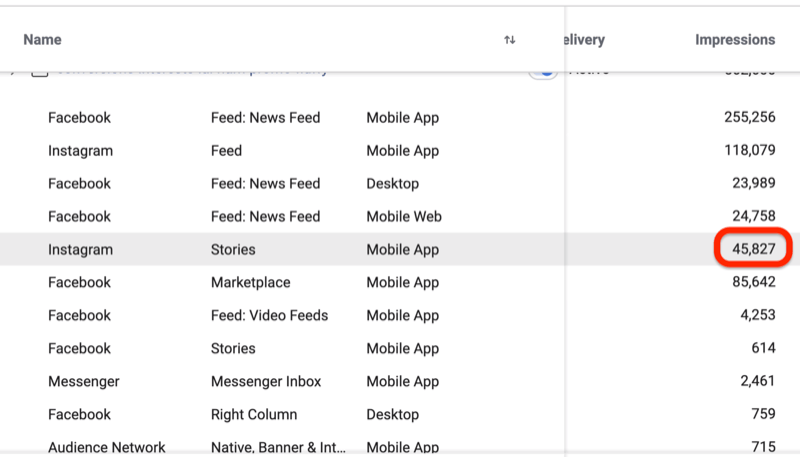
Let's say that you're analyzing Stories performance for the ad below, which you're running to the top of the funnel. Looking at the video engagement data, you can see that Stories has received 45,827 impressions.
How much is it costing you to get a 10-second view on Stories? $0.19. How many people are watching the ad all the way through? A little more than 1,000 people. How much is it costing you for people to watch all the way through? $0.25.
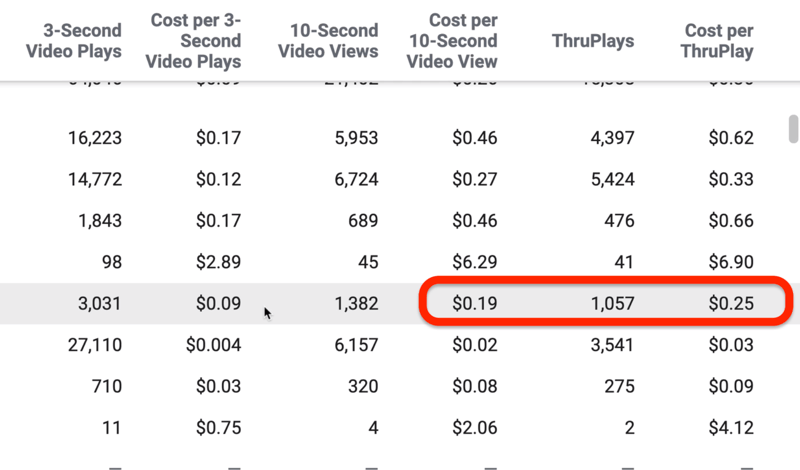
These stats help you understand where your money is going if you're not looking at conversions. Because you're running this ad to the top of the funnel, you care how much it's costing you to get people to notice your business, which is $0.19 in this case.
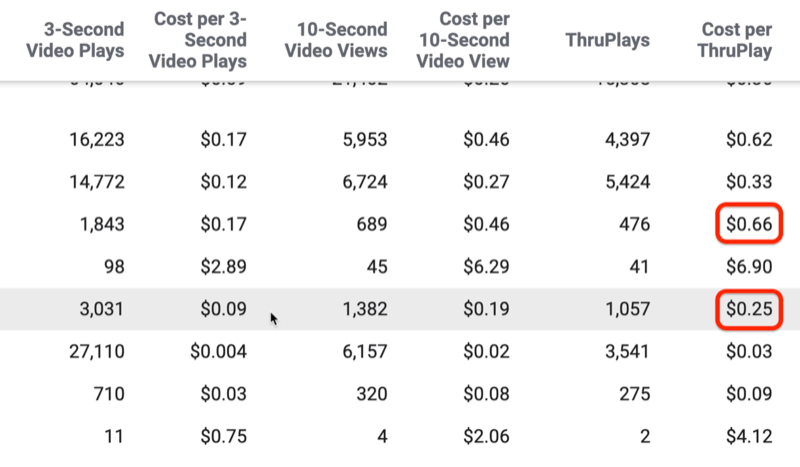
If you're running this video in a whole bunch of different places, you can say, “I know that on Facebook's desktop news feed, it's costing me $0.66 for someone to watch all the way through, but on Instagram Stories, it's only costing $0.25.”
These are the costs to keep in mind when you're building remarketing audiences. These costs are important because understanding how far you're going to take your budget based on your objective is how you're going to win. To learn more about building effective Instagram ad funnels, read this article.
Because there are so many numbers in this engagement report, you might be tempted to think that all of them matter. The truth is, they really don't.
If you're looking at Instagram Stories ad performance and you know that stories last 15 seconds, do you really care how much it's costing you to get someone to watch for 3 seconds? If you see the cost for a 10-second view is $5.00, and the rest of the placements are $2.00 at most, that's a good indicator people aren't watching to the 10-second mark and something might be wrong.
3 Days of World-Class Training—Zero Travel!

Couldn't make it to Social Media Marketing World and AI Business World this year? Get all of the great content at a fraction of the price with a Virtual ticket.
That’s full access to recordings of every keynote, workshop, and session—the ones people travel thousands of miles to see. Don't wait. Get your Virtual ticket and enjoy actionable content that you can watch anytime, anywhere.
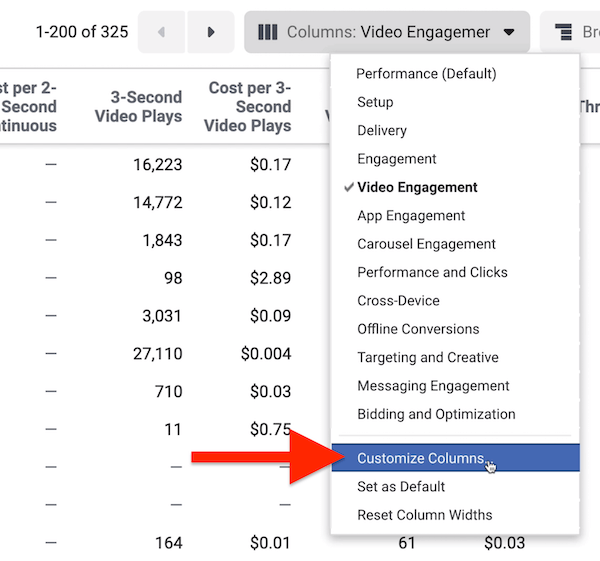
Pro Tip: To access even more data for your Instagram Stories ads, you can customize your reports. Select the Customize Columns option from the Columns drop-down menu and you'll get access to a bunch of other data that you can add or remove from your reports, depending on what you care about. I won't lie, it's a little overwhelming. If you're new at this, you might want to hold off until you get more comfortable.
#3: View Performance and Clicks to Analyze Instagram Stories Ads for Goal Conversion
Let's say you're running Instagram Stories ads and the goal is conversion. If you go to your pre-made columns, there's one for Performance and Clicks. Select that option and the data will look very different from what you see for Engagement.
Now you're looking at data like the results based on the goal of that ad set.
The goal for the ad below is purchases. Of the purchase conversion events, you can see how many happened, the frequency at which people saw the ad in the amount of time you've chosen, how much it cost to get that purchase, what the budget was, and so on.
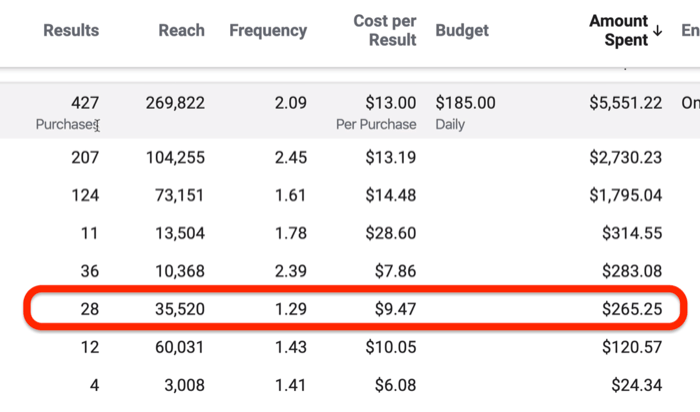
If you scroll over, you'll see the cost per click (CPC) and how many purchases these specific line items drove.
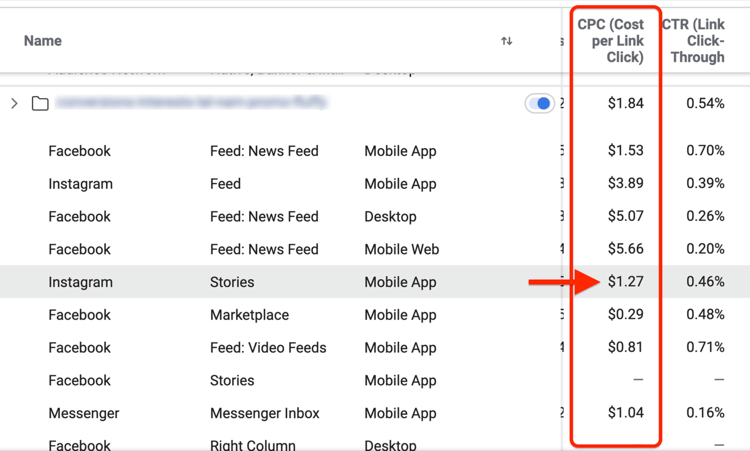
Let's look at the CPC for Instagram Stories. In this case, you paid $1.27 for someone to click through to your site. That's actually pretty cheap when you look at some of the other placements here.
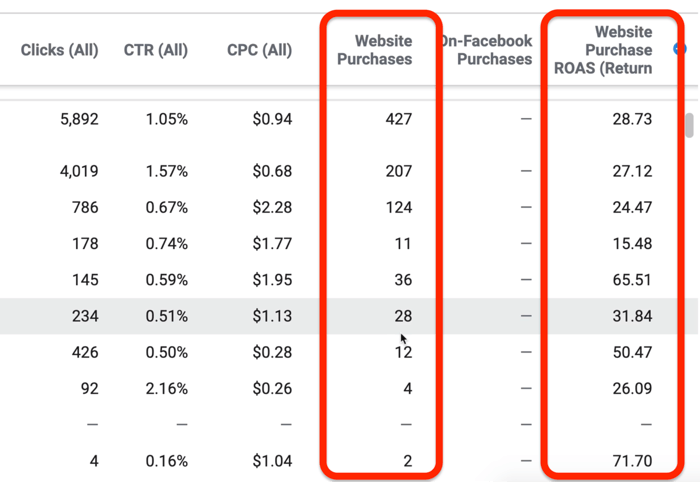
When you look at data about how many purchases happened, how much those purchases cost you, and the return on ad spend (ROAS), you'll start to see how your story ads are performing relative to the other placements. All of this data is important to consider.
Deciding When to Create a Separate Ad Set for Instagram Stories
One of the most frequently asked questions I get when people set up their accounts is, “Should I just set up Stories in its own ad set and run it separately from the Instagram feed or should I put them together?”
When you're first launching, you'll probably want to run them together. This gives you a place to start. See how often Facebook is showing your ad and if your creative is doing well. This allows you to get a feel for whether your ad is doing great or poorly before you allocate a lot of budget to something that might be inefficient.
If your ad is doing well, you'll want to maximize the budget. If the ad isn't doing well, that's an indicator you probably need to work on your creative and you may not want to do that in a separate ad set.
As I mentioned earlier, Facebook isn't great about making sure you show up frequently in Instagram Stories. They'll show you a fair amount but they'll often favor the feed because there's more data to go on. You'll probably have to combat that by saying, “I only want to run in Stories in this ad set” and put a lot of budget toward it.
Here's a great example of what can happen when you break things out separately. One is an interests campaign that's based on the Instagram feed and the other is running only on Stories. But they weren't always separated like this.
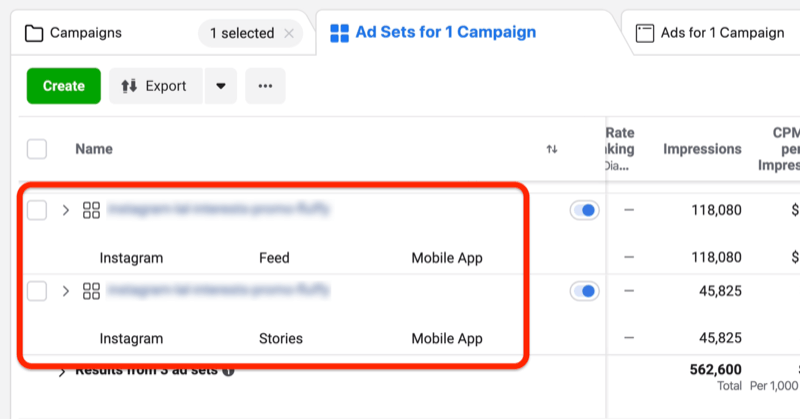
They used to be bundled with other placements. Over time, we saw that Instagram was doing better but we weren't maximizing budget. Then Stories started to pull ahead of the feed and we weren't able to maximize budget there.
This example shows what happens when this approach works really well. Story ads obviously are much cheaper than the feed. With the feed, we're paying $15.20 for every 1,000 ad impressions. In Stories, we're paying a third of that.
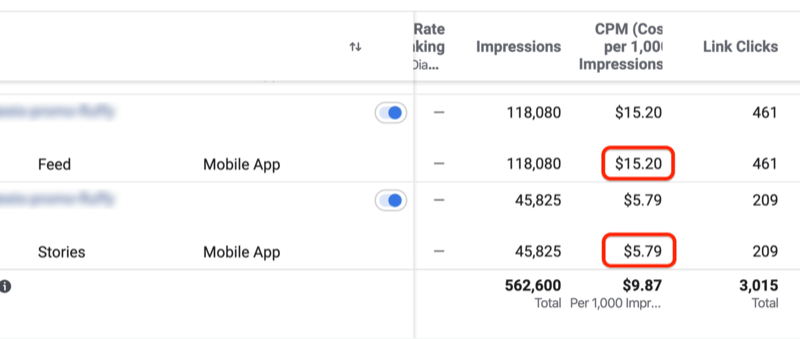
With Stories, there's less competition and it's much cheaper. This doesn't necessarily mean anything if it's not selling but it's interesting to note.
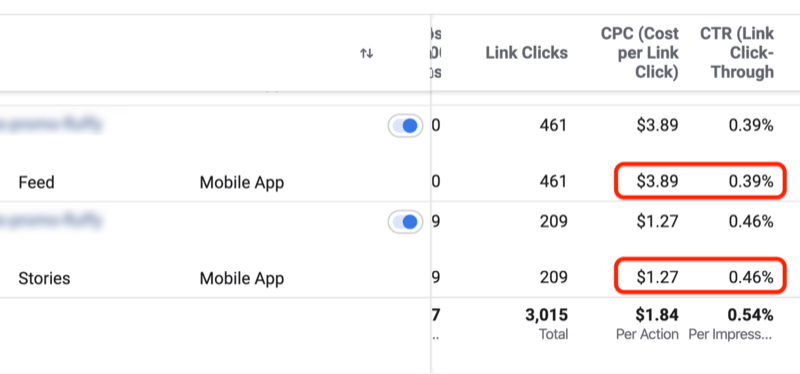
Now let's look at the CPC and click-through rate (CTR). The Instagram feed has a $3.89 CPC with a 0.39% CTR. Stories has a $1.27 CPC with a 0.46% CTR. Stories is still doing better.
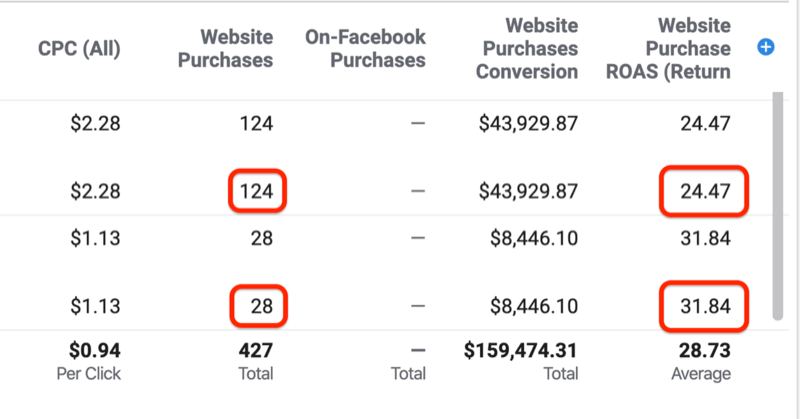
When you look at the quantity of website purchases, though, they're higher for the Instagram feed. This isn't a surprise because there are a lot more ads on the feed than there are on Stories so there's more opportunity to sell.
If you look at the ROAS, this brand is getting around 24.5% for the feed and 31% for Stories. That's an enormous return. Again, it's not necessarily normal. These are the types of patterns we see as we get these spends at scale.
When you take the time to make your Stories ads work and maximize your budget—no matter how big or small that budget is—many times, Stories will absolutely outperform the feed. That's when I strongly recommend that you break them out into their own placement because that's the only way you'll get all of the inventory that story ads have out. Knowing when it's time is a judgment call.
Conclusion
Chances are you're familiar with Facebook ads and you might even be familiar with the data that goes with them. But Instagram is different. When you look at Stories ads, those are kind of like an ad placement within a platform that's totally different than anything else that's running.
Instagram Stories ads present one of the biggest opportunities for advertisers online. Understanding how to do Stories ads well is what will separate you from the competition. But to create successful ads, you need to understand how to look at your data.
What do you think? Which ad performance metrics do you track for your Instagram Stories ads? Share your thoughts in the comments below.
More articles on Instagram ads:
- Learn how to build a successful Instagram ad campaign with only $5 a day.
- Find out how to create Instagram ads that convert.
- Discover how to create an Instagram Stories ad poll for the best engagement.

Curious About How to Use AI?
Our newest show, AI Explored, might be just what you're looking for. It's for marketers, creators, and entrepreneurs who want to understand how to use AI in their business.
It's hosted by Michael Stelzner and explores this exciting new frontier in easy-to-understand terms.
Pull up your favorite podcast app and search for AI Explored. Or click the button below for more information.
