Want to save time analyzing your Facebook ads results? Looking for an easy way to create custom reporting in Ads Manager?
In this article, you'll discover three custom reports in Ads Manager to help you quickly analyze your Facebook ad performance.
Why Create Custom Reports in Facebook Ads Manager
If you’re anything like me, you’re tired of clicking around in Facebook Ads Manager to find, filter, and sort the data to see how your Facebook ads are actually performing.
Yes, Facebook has a few easy-to-reference reports around—Delivery, Bidding and Optimization, Performance and Clicks, and Engagement, to name a few. However, as an advertiser, I find these reports clunky and ineffective at identifying how the audiences I’m targeting with Facebook ads are moving through my overall sales process.
An added benefit of creating your own custom reports is that you can quickly share them with your colleagues, manager, and clients so everyone on the team is on the same page.
Note: You need to have the Facebook pixel installed and tracking correctly. If you haven’t done that yet, don’t worry; this video walks you through how to set up your pixel.
Now let’s look at how to set up three custom reports in Facebook Ads Manager.
#1: ROI Snapshot Report
The ROI snapshot report is a Facebook advertiser’s best friend because it shows at a glance the profitability of your ads (i.e., how much you’re spending compared to how much revenue your ads are generating).
There are two rules for using this report:
- The ads must lead the user to buy something. This report will be useless if you’re simply boosting posts or running audience growth campaigns.
- The purchase conversion value must be used with the Facebook pixel. If you don’t communicate to Facebook that a purchase has been made by using the Purchase standard event pixel or a custom conversion on your purchase confirmation page, the results won’t populate.
By looking at this report, you can analyze which Facebook ads are having a direct impact on sales by observing the purchase conversion value, ROAS, and total ad spend of each campaign, ad set, and ad. These are some of the seven most important metrics for analyzing your Facebook ad results.
Create the ROI Snapshot Report
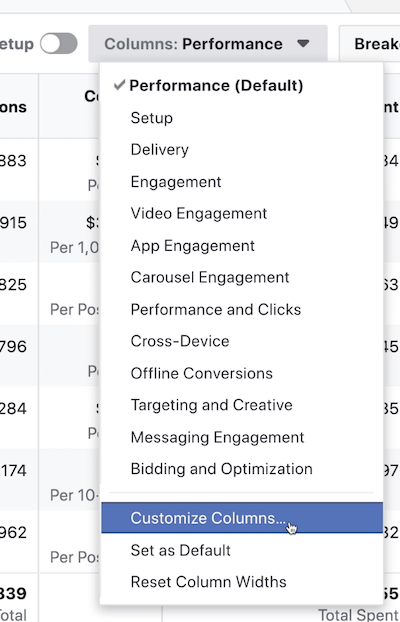
On the right-hand side of Ads Manager, there’s a button labeled Columns: Performance. Click it and scroll to the bottom of the drop-down menu to select Customize Columns.
In the pop-up window that appears, 18 columns are automatically selected for you on the right-hand side.
Which AI Moves Actually Matter?
That's what every marketer is wrestling with now. New AI strategies, new tools, new takes every week — but no clarity. Most marketers and business owners are trying to figure out AI alone.The AI Business Society is your trusted guide. Get expert-led training you can put to work immediately. Plus a community of marketers sharing what's actually working.
I'M READY FOR REAL AI RESULTS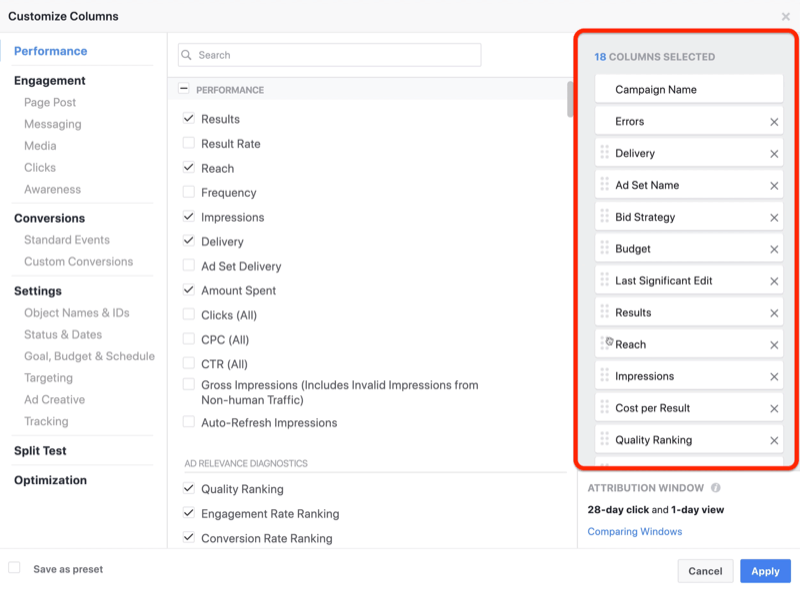
“Columns” are the rows of metrics you see when you first log into Ads Manager.
Because you’re creating a custom report, you’ll pick and choose which metrics to show. You’ll delete some of the metrics from the pre-selected list of 18 columns and also add new ones.
Start by clicking the X and removing the following metrics in the right-hand column:
- Errors
- Delivery
- Ad Set Name
- Bid Strategy
- Budget
- Last Significant Edit
- Reach
- Impressions
- Quality Ranking
- Engagement Rate Ranking
- Conversion Rate Ranking
- Ends
- Schedule
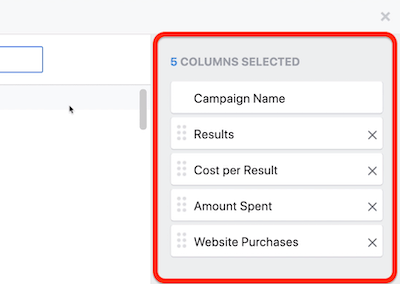
When you’re done, you’ll be left with five columns: Campaign Name, Results, Cost per Result, Amount Spent, and Website Purchases.
Now you’re ready to add new metrics to your custom report.
In the search bar, begin typing “checkout” to narrow your search. When you see the Checkouts Initiated metric, put a checkmark next to Total and Cost.
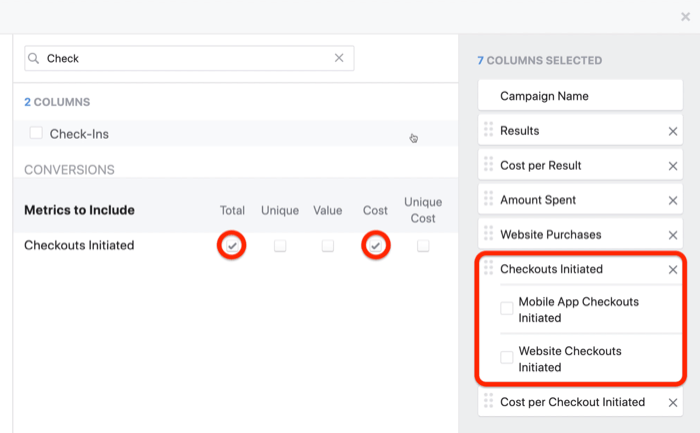
Note: On the right-hand side, Mobile App Checkouts Initiated and Website Checkouts Initiated will be pre-selected so deselect them.
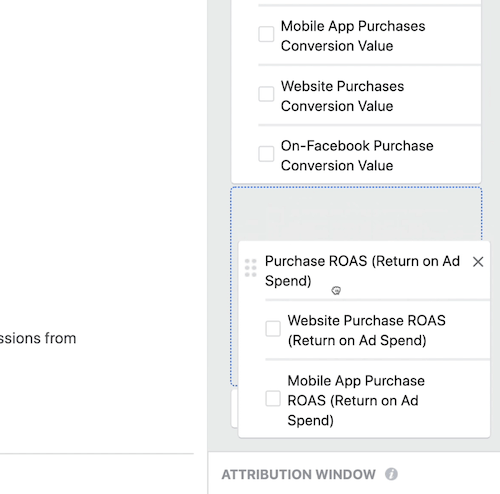
After you add the checkout metric, go back to the search bar and begin typing “purchase.” For the Purchase ROAS metric, select the Total checkbox, and for Purchases, select Value and Cost (for cost per purchase).
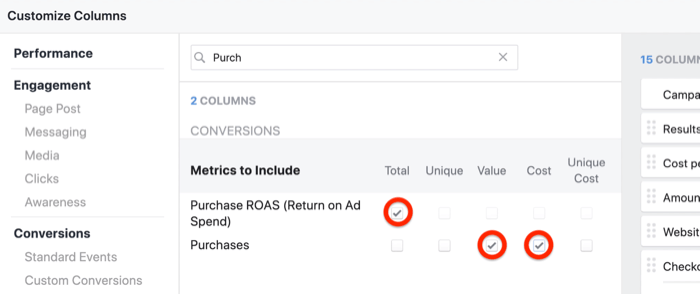
Make sure you deselect any checkboxes on the right-hand side of the window like you did with the initial checkout. When you’re done, you’ll have a total of 10 columns selected.
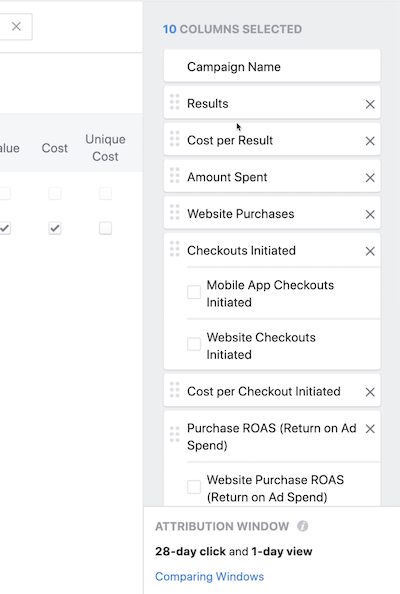
I like to organize the ROI snapshot report in a way that helps me understand how deep people are in the sales process, starting with initiate checkout and ending with purchase conversion.
To set up the report in this manner, simply drag the columns up or down to rearrange them. Start by dragging Purchase ROAS all the way to the bottom and making Purchase Conversion Value the second to last.
Then arrange the rest of the metrics in the following order, starting at the top:
- Campaign Name
- Results
- Cost per Result
- Amount Spent
- Checkouts Initiated
- Cost per Checkout Initiated
- Website Purchases
- Cost per Purchase
- Purchase Conversion Value
- Purchase ROAS (Return on Ad Spend)
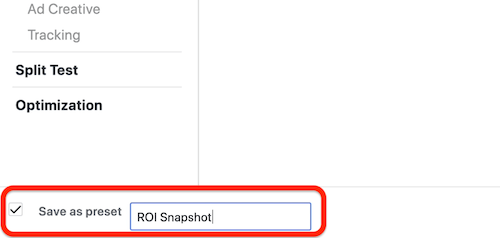
When you’re finished setting up the report, you’ll want to save it as a preset. In the bottom-left corner of the window, select the Save as Preset checkbox and type in “ROI Snapshot” as the name. Then click Apply to return to the regular Ads Manager screen.
Bravo! You’re ready to start using your first report.
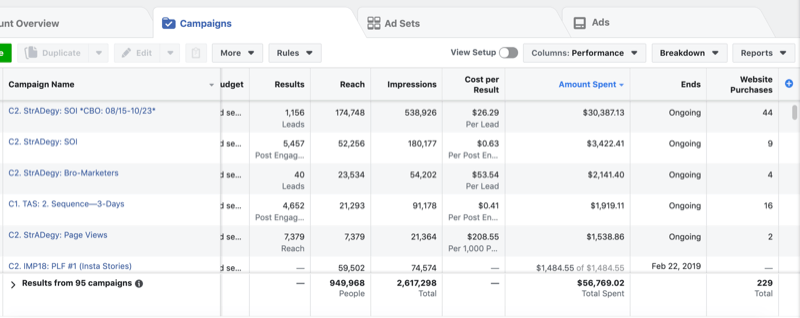
Review the ROI Snapshot Report
Let’s review how to read a snippet of this report:
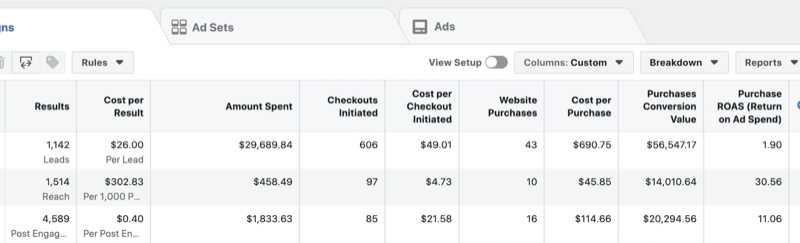
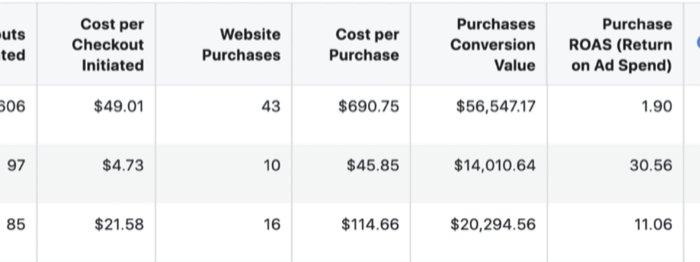
Checkouts Initiated is the number of people who visited your store or sales page and began the checkout process. It’s like when you stock up on Amazon and then head to your cart to see what’s inside. That’s a checkout initiated.
Cost per Checkout is what you paid to move someone along in your sales process to the point of checkout. This does not mean they’ve ultimately purchased your product. It’s helpful to understand what you’re paying to get them close to purchase. To visualize this, if you sell a $20 widget and it costs an average of $22 to get someone to your checkout page, you won’t be profitable once someone does purchase.
Website Purchases is simple. It’s the number of sales transactions you made.
Purchases Conversion Value is the total revenue generated from your website purchases.
The last column, ROAS, is the Holy Grail of your Facebook ad metrics. It tells how many dollars you’re earning from every dollar you spend on Facebook advertising.
#2: Lead Progress Report
The ROI snapshot report is great for an at-a-glance view of how profitable your Facebook ads are. This next report, the lead progress report, will build on that. It helps you understand your cost per lead and what percentage of those leads are turning into sales.
There are two rules for using this report:
- The ads must lead the user to opt into something. It could be a lead magnet, freebie, downloadable, discovery call, or an application—something that turns your user from a casual observer of your ads to an actual prospect. This report will also be useless if you’re simply boosting posts or running audience growth campaigns.
- A standard event, or customer conversion event, must be used with the Facebook pixel. A standard event or custom conversion tells Facebook that a new lead has entered your sales process.
By looking at the lead progress report, you can analyze which ads are being clicked, which ads are converting to new leads, the overall percentage of people who see your ads and then opt in, and the cost per lead.
3 Days of World-Class Training—Zero Travel!

Couldn't make it to Social Media Marketing World and AI Business World this year? Get all of the great content at a fraction of the price with a Virtual ticket.
That’s full access to recordings of every keynote, workshop, and session—the ones people travel thousands of miles to see. Don't wait. Get your Virtual ticket and enjoy actionable content that you can watch anytime, anywhere.
Create the Lead Progress Report
To create this report, select Customize Columns as you did above. As long as you’re creating these custom reports at the same time, you won’t be deleting any metrics to create this report, you’ll just be adding some. If you’ve previously created your ROI snapshot report, head to that first and then select Customize Columns.
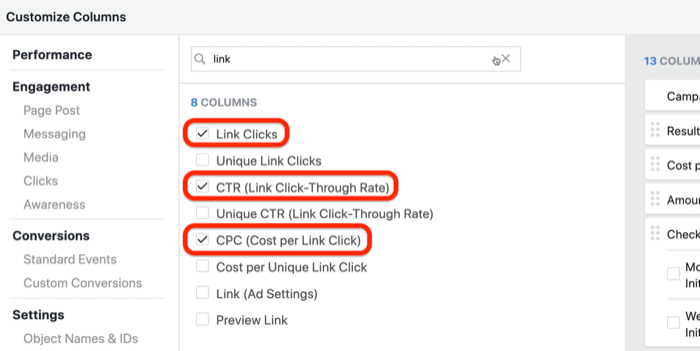
Start by typing “link” in the search bar. Select the checkboxes for Link Clicks, CTR (Link Click-Through Rate), and CPC (Cost per Link Click).
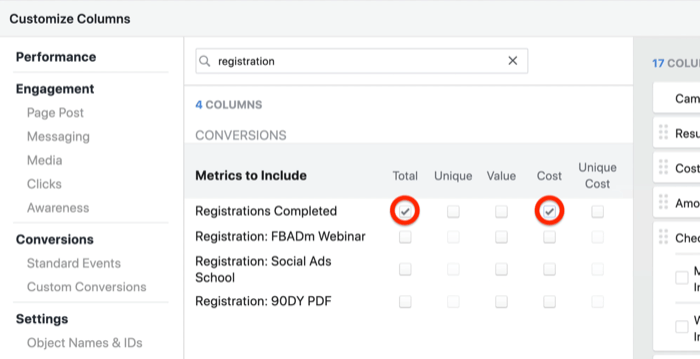
Next, in the search bar, type in “registrations” or “leads,” depending on which standard event you’re using with your Facebook pixel to track conversions. For either Registrations Completed or Leads, select the Total and Cost checkboxes.
As you did above, organize these columns by the sales stage, starting with leads entering your sales process going toward that checkout process and ultimately a sale.
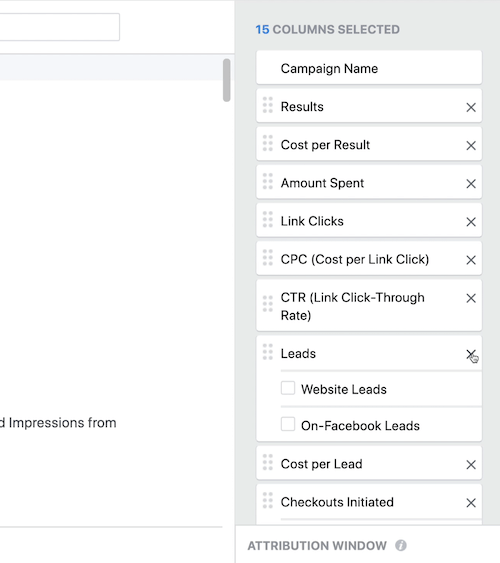
Rearrange the columns like this, starting from the top:
- Results
- Cost per Result
- Amount Spent
- Link Clicks
- CPC (Cost per Link Click)
- CTR (Link Click-Through)
- Leads
- Cost per Lead
Then arrange the remaining metrics like this:
- Checkouts Initiated
- Cost per Checkout Initiated
- Website Purchases
- Cost per Purchase
- Purchases Conversion Value
- ROAS
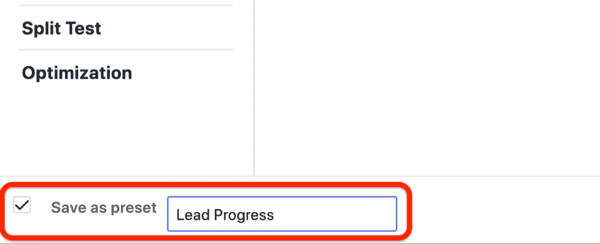
To save your report, click Save as Preset and type in “Lead Progress” for the name. Then click Apply.
Review the Lead Progress Report
Let’s review how to read a snippet of this report:
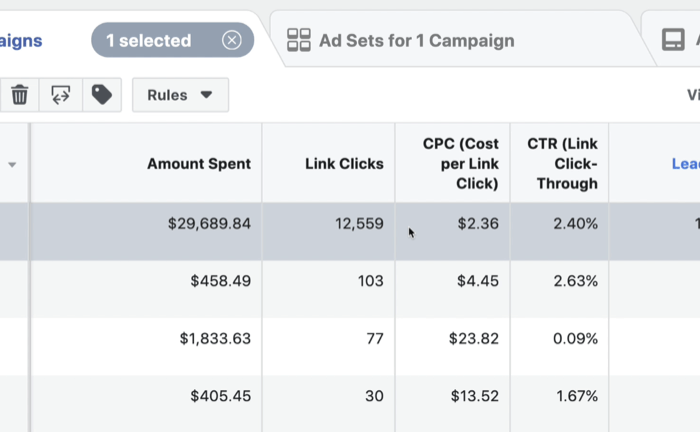
Suppose you’ve spent almost $30,000 to generate 12,559 link clicks, as in the example above. The cost per click—the CPC (Cost per Link Click) column—is simply the total ad spend divided by the number of link clicks ($30,000 ÷ 12,559).
The click-through rate (CTR) for your links tells you what percentage of people who saw your ads clicked them. This helps you understand whether you’re targeting the right audience. The higher the CTR, the more compatible your ad is with the audience you’re targeting.
The leads metric represents the total number of potential prospects (or opt-ins) you’ve generated from your ads. This number will be much smaller than the overall traffic because the number of people who opt in or subscribe to your email list is a fraction of the total amount of traffic you’ve sent there in the first place.
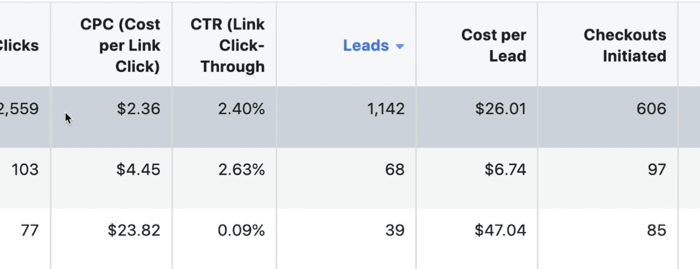
Cost per Lead (CPL) tells you how much you spent to acquire a new lead for your business. Compare that number to the total amount of revenue a new lead brings to your business.
#3: Post Engagement Report
While the lead progress report has everything to do with the sales process, the post engagement report is all about your ad-specific performance.
There are no rules for using this report. Each ad will populate these results.
By looking at this report, you can analyze the effectiveness of your targeting and ad creative. If your ads aren’t getting viewed, clicked, and consumed, it’s typically due to poor messaging or poor fit between your message and target market.
With this report, you’re not looking at how your Facebook page overall is performing but rather how the ads themselves are performing.
Create the Post Engagement Report
To create this report, we’ll keep it super-simple and build on the lead progress report you just created. Select Customize Columns.
First, you’ll remove some of the metrics from this report. Starting with leads, delete all of the metrics below it.
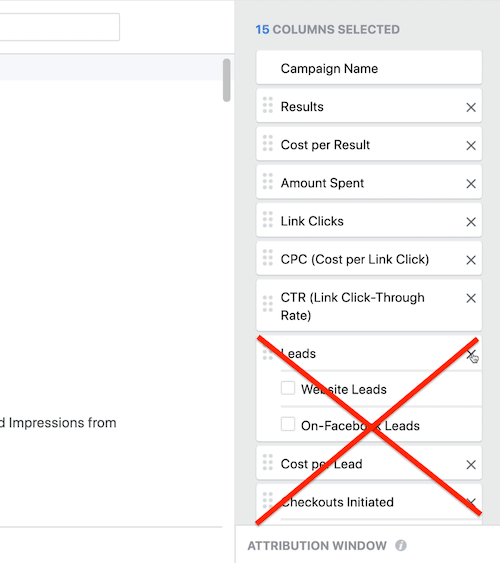
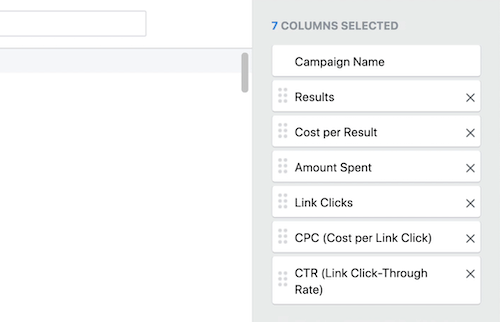
You should be left with seven columns: Campaign Name, Results, Cost per Result, Amount Spent, Link Clicks, CPC, and CTR.
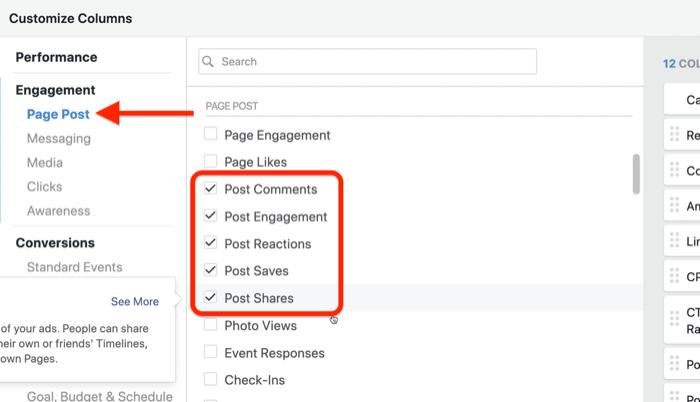
Now you’re ready to add new metrics. Navigate to the Page Post section on the left-hand side of the window.
In the middle of the window, select Post Comments, Post Engagement, Post Reactions, Post Saves, and Post Shares. Then scroll down and select Cost per Post Engagement, too. You want to understand what you’re paying to generate engagement on your ads, not just how much you’re paying per link click or per purchase.
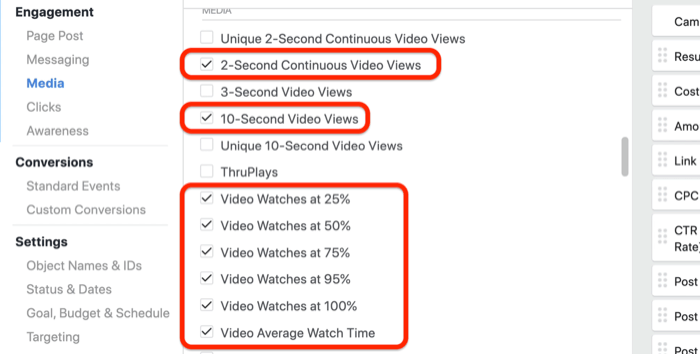
Next, scroll down and select 2-Second Continuous Video Views, 10-Second Video Views, and then all of the other video watch percentages—25, 50, 75, and 100. Finish this off with the Video Average Watch Time.
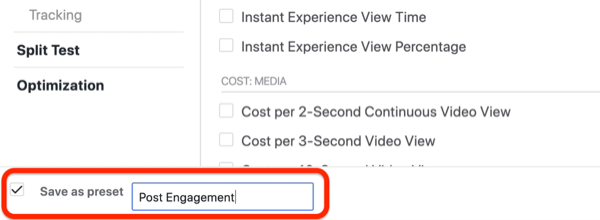
To save this report, click Save as Preset and type in “Post Engagement.” Click Apply.
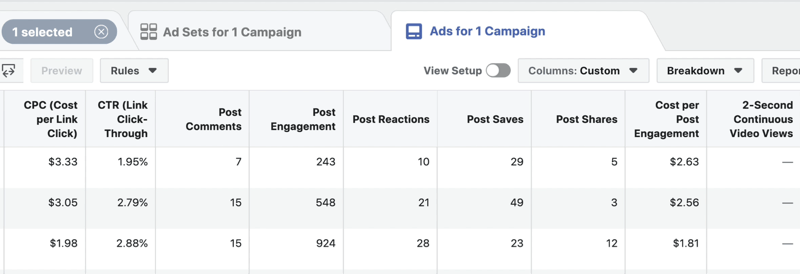
Review the Post Engagement Report
With the ROI snapshot and lead progress reports, you’re viewing the campaign level to see how your campaigns perform overall. With the post engagement report, it’s time to get into the nitty-gritty of how your individual Facebook ads are performing.
I recommend that you use the post engagement report as a discovery tool to understand what type of content your audience is engaging with.
Navigate to the ad level of your campaign to see how people are interacting with each ad for each audience, from the comments people leave to the likes they drop. This data will help you better understand whether your posts resonate with your audience.
If you have zero comments on your ads, maybe your audience isn’t connecting with how you’re sharing your message. That could be an indicator to go back and work on your copywriting skills.
On the flipside, if your audience is sharing your ad like crazy, you might be onto something. I highly recommend continuing to use that type of ad content for your community.
How to Access These Custom Reports in Ads Manager
The beautiful part about accessing these custom reports is that you’re already a pro at it! Remember at the start of this article where you clicked Columns: Performance and then decided to level up your reporting game?
Once you’ve created custom reports, you’ll see them in the list with the rest of the reports.
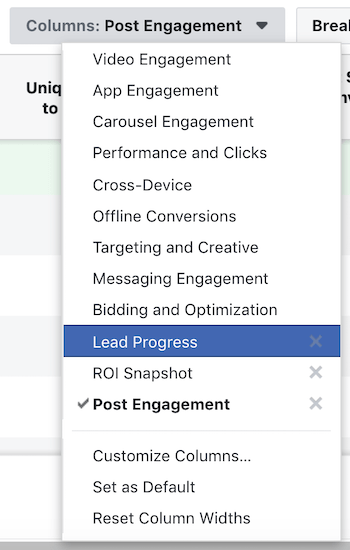
If they don’t work for your particular business needs, feel free to experiment by updating them with brand-specific KPIs. Either way, you’ll be so much more efficient at reading your Facebook ad results.
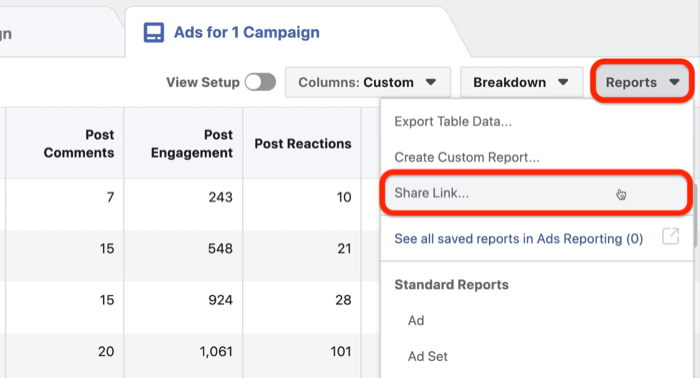
Pro Tip: If you’re not the only decision-maker who needs to see these reports, it’s easy to share this information with your team members, manager, and clients. Simply click the Reports button on the right-hand side of the screen and select Share Link from the drop-down menu. This report is only available to people with access to your ad account so be sure to share it only with the people who have the appropriate permission.
Watch the Video:
Conclusion
There’s no right or wrong way to use these custom reports to track Facebook ad performance. I recommend that you start to get familiar with all of the different metrics in these reports so you can use the data to make better ad-buying decisions.
What do you think? Which of these custom reports will you create in Ads Manager? Share your thoughts in the comments below.
More articles on Facebook ads:
- Learn how to create a Facebook marketing plan that models your customer journey.
- Discover how to improve your Facebook ads with customer research.
- Find out how to customize Facebook ads based on customer awareness principles.

Curious About How to Use AI?
Our newest show, AI Explored, might be just what you're looking for. It's for marketers, creators, and entrepreneurs who want to understand how to use AI in their business.
It's hosted by Michael Stelzner and explores this exciting new frontier in easy-to-understand terms.
Pull up your favorite podcast app and search for AI Explored. Or click the button below for more information.
