Do you know if your Facebook ads are working? Wondering which key metrics you should be tracking?
In this article, you'll discover seven important Facebook ad metrics you need to know, where to find them in Ads Manager, and what to do when you're not getting the results you want.
#1: Return on Ad Spend
Return on ad spend (ROAS) is the amount of revenue generated for every dollar spent on advertising. And, in a nutshell, it's the metric to use to instantly understand your Facebook and Instagram advertising results. I think of it as the Holy Grail of ad metrics—making sure that every dollar you invest in your advertising efforts is returning you (at minimum) a dollar back in revenue.
The formula for calculating ROAS is simple: Revenue ÷ Ad Spend = ROAS.
You determine your total revenue generated according to the Facebook pixel (under the purchase conversion value column in Ads Manager) and divide it by the total ad spend it took to generate that revenue.
Let me illustrate: You sold 10 units of a $27 product from your Facebook ad sequences last week, bringing in $270 of revenue. To make those sales, you spent $54 on Facebook ads.
Revenue ÷ Ad Spend = ROAS
$270 ÷ $54 =5x
The x is a multiple of 1. In this case, every time you gave the Facebook ATM a dollar, it spits back $5 in revenue—or 5 times $1.
If you're anything like me, you'd love to have a bank machine that spits out $5 bills each time you made a $1 deposit but that's not always the case in the Facebook advertising world. Pay attention to your ROAS to make sure your ads are profitable.
When your ROAS is positive (a multiple greater than 1), your advertising dollars are earning more revenue than the amount spent on advertising.
Otherwise stated: You're making money.
Which AI Moves Actually Matter?
That's what every marketer is wrestling with now. New AI strategies, new tools, new takes every week — but no clarity. Most marketers and business owners are trying to figure out AI alone.The AI Business Society is your trusted guide. Get expert-led training you can put to work immediately. Plus a community of marketers sharing what's actually working.
I'M READY FOR REAL AI RESULTSWhen your ROAS is negative (a multiple less than 1), you're spending more on advertising than the amount of revenue generated.
Otherwise stated: You're losing money.
Notice the above calculation didn't factor in other costs of doing business like your team expenses, tools and software, and storefront (whether a physical location or a digital storefront like a website). I recommend that you factor in the rest of your variable expenses when calculating your ROAS to get an overall return on investment (ROI).
To do that, take the total amount of Facebook ad spend plus the rest of your expenses and divide that into your total revenue:
Revenue ÷ (Ad Spend + Expenses) = ROI
It's easiest to break down your ad spend costs and expenses in a monthly cadence; to visualize this, calculating January's revenue and then dividing that by the sum of January's ad spend and the rest of the expenses for that month.
Going back to the earlier example, you spent $54 on ads last week to generate $270 in revenue. And you also incurred $73 of other variable costs. If you plug those numbers into the formula above, your ROI is 2.13x.
$270 ÷ ($54 + $73) = 2.13x
For every dollar you spent, you earned $2.13.
#2: Purchase Conversion Value
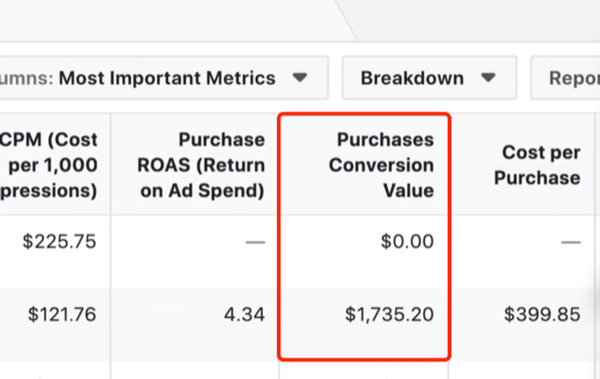
Facebook's purchase conversion metric tracks the total value of purchases made from your advertising efforts.
In fact, Facebook makes it crazy easy to understand the total revenue generated from your ads by showing the purchase conversion value inside Ads Manager.
You can manually calculate this number by going into your PayPal account or even your cash register and determining that the revenue came from this ad. However, the simplest way to calculate purchase conversion value is by having the Facebook pixel installed.
Installing the pixel involves adding a small snippet of code to your website that lets Facebook know that this ad resulted in that revenue. If you don't already have your Facebook pixel installed, don't worry! This video walks you through the process:
To manually calculate your purchase conversion value, take the number of items sold and multiply that by their purchase price.
# of Items Sold x Item Cost = Purchase Conversion Value
In the previous example, you sold 10 items that cost $27 each so the purchase conversion value is $270:
10 x $27 = $270
The purchase conversion value is then used to calculate ROAS along with your ad spend.
Everything might be fine and dandy if your purchase conversion value is positive but what if it's a big fat zero? That means your Facebook ads aren't working.
If your Facebook ads are working and you're making sales, the purchase conversion value will be a positive number. But if you see zero, it typically means there's something wrong with your Facebook ads or with the sales process overall.
The next metrics we cover will help you identify where the bottlenecks might be.
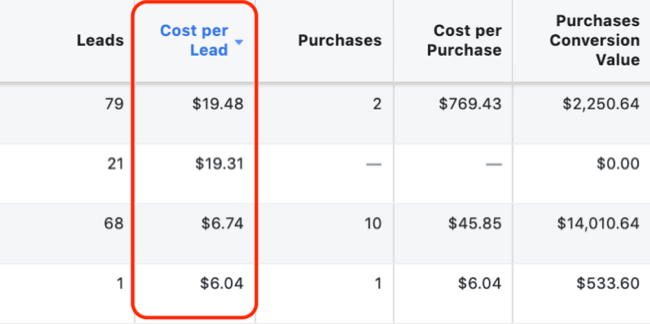
#3: Cost per Purchase
I love looking at the cost per purchase, which is also commonly referred to as the cost per acquisition (CPA). Both phrases can be used interchangeably.
Cost per purchase is a quick way to gauge whether you're selling individual products at a profit or a loss after taking into account your ad spend expense. It tells you the total ad spend required to sell a single unit of product. It can also be used to quickly calculate your profit margin on individual items.
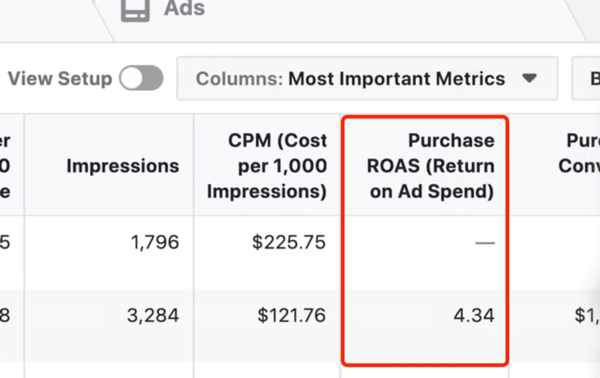
With the Facebook pixel installed, Facebook automatically calculates this for you under the Cost per Purchase column in Ads Manager.
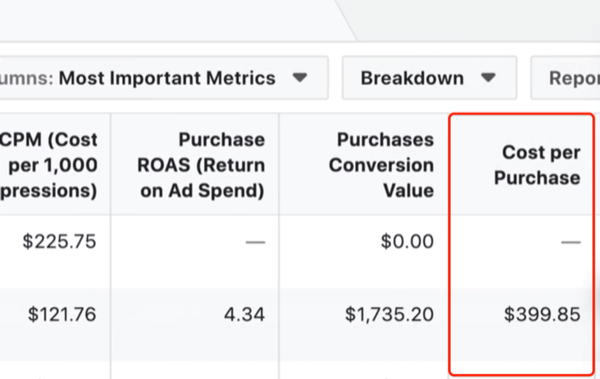
You can use this number and the purchase conversion value we covered above as an alternative way to determine your ROAS.
Let's illustrate using the numbers in the screenshot above.
Purchase Conversion Value ÷ Cost per Purchase = ROAS
$1,735.20 ÷ 399.85 = 4.34
Additionally, by subtracting the cost per purchase from the product price, you can determine your profit margin:
Product Price – Cost per Purchase = Profit Margin
In this example, you spent $54 on Facebook ads last week to sell 10 units. That means your ad spend per unit would be $5.40:
$54 ÷ 10 = $5.40
With a product selling for $27 that cost you $5.40 in ad spend, you have a profit margin of $21.60.
$27 – $5.40 = $21.60
Remember to take into account your variable expenses so you can understand at a glance if your cost per purchase—what you're spending to acquire a new customer—is relevant for your business.
When your profit margin is a positive number (greater than $0), your advertising dollars are earning more revenue than the amount spent on advertising.
Otherwise stated: You're making money.
When your profit margin is a negative number (less than $0), you're spending more on advertising than the amount of revenue generated.
Otherwise stated: You're losing money.
#4: Leads
A lead is a person who shows interest in your brand's products or services—typically defined as someone who subscribes or opts in with their email address to receive further marketing- and sales-related correspondence.
Every new email subscriber would count as a lead.
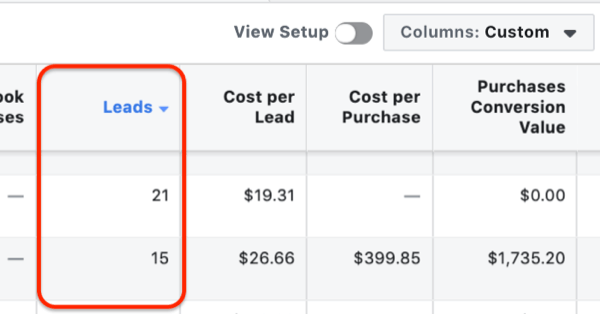
On the flip side, if you're an eCommerce business that sends people directly to your sales page or online store, you might not have email subscribers.
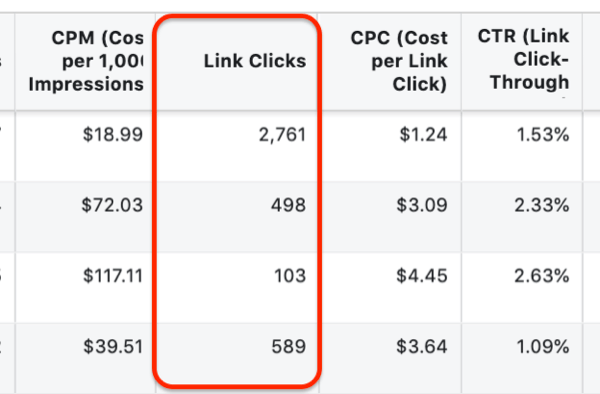
Every new visitor to your online store would count as a link click.
#5: Earnings per Lead
Depending on which side of the equation you fall on, calculate either your earnings per lead (EPL) or earnings per click (EPC).
EPL is the amount of revenue generated divided by the total number of leads it took to generate that revenue. If your business generates leads (or subscribers or opt-ins of some sort) where your sales process naturally happens via email, you'd use EPL.
EPC is the amount of revenue generated divided by the total number of website clicks it took to generate that revenue. If you send people directly to your sales page or online store (not selling via email), you'd use EPC.
To calculate your EPL or EPC, you need two things:
- Your purchase conversion value (metric #2 above)
- The number of leads (or clicks) (metric #4 above)
Now take the purchase conversion value and divide it by the total number of leads (or clicks) to get your EPL or EPC:
Purchase Conversion Value ÷ Number of Leads (or Clicks) = Earnings per Lead (or Click)
This dollar amount tells you how much every new subscriber who signs up for your email list or enters into your sales process is worth to your business. You can then use this information to estimate how much you'd be willing to spend to acquire a new lead (or click) since you now understand its value to your business.
3 Days of World-Class Training—Zero Travel!

Couldn't make it to Social Media Marketing World and AI Business World this year? Get all of the great content at a fraction of the price with a Virtual ticket.
That’s full access to recordings of every keynote, workshop, and session—the ones people travel thousands of miles to see. Don't wait. Get your Virtual ticket and enjoy actionable content that you can watch anytime, anywhere.
#6: Cost per Lead
On the flipside is cost per lead (CPL). As in the above equation, if your business doesn't generate leads, replace “lead” with “click” in your calculation.
CPL is the amount you spend to acquire a single new lead for your business.
To calculate CPL, take the total amount of Facebook ad spend and divide it by the number of leads that ad spend generated:
Ad Spend ÷ Number of Leads = Cost per Lead
For instance, if you spend $130 to generate 100 leads, your CPL is $1.30:
$130 ÷ 100 = $1.30
If your EPL is $2.70 and your CPL is $1.30, you're earning $1.40 for each new lead who comes into your pipeline. Taking into account your variable expenses, you can determine how many leads you'd need to generate in a given period to hit your revenue and profitability goals.
When you use Facebook pixel conversion events, Ads Manager will report this number to you automatically under the Cost per Lead column.
#7: Click-Through Rate
The metrics we've discussed to this point are based on the overall results of your Facebook advertising combined with the efficacy of your sales process. The way to effectively manipulate and optimize your overall advertising results and metrics is to have a strong Facebook advertising strategy in effect that helps you turn attention into revenue (on autopilot).
Regardless of your overall sales process, your click-through rate (CTR) is an indicator of how engaging your ad copy and creative are to the audience you're targeting with your Facebook ads.
Facebook has two different CTR metrics:
- CTR (Link Click-Through) is the number of link clicks by people who have viewed your ad.
- CTR (All) is the number of people who have interacted with your ad in general. That could be through liking it, commenting on it, sharing it, swiping the carousel, or clicking the links. It's an amalgam of all of the engagements on that ad.

When running feed ads, I typically aim for a CTR of greater than 1.5%. If the link CTR is less than 1.5%, I'd typically recommend you go back and edit the ad copy and creative.
Right-hand column ads, on the other hand, typically get clicked much less frequently than feed ads. As long as your right-column ads are getting a link CTR of 0.5%, you're okay. If not, feel free to edit those ads, too.
You might have heard engagement rate thrown around as an important metric to track. In Facebook-speak, your engagement rate is your CTR (All). It's the total engagements your ad post has received divided by the total number of impressions:
Engagement ÷ Impressions = CTR (All)
Similar to your link CTR, you want people to interact with your ads because no clicks result in zero sales.
How to Access These Facebook Ad Metrics in Ads Manager
Now that you have a handle on these seven important Facebook ads metrics, let's dive into Ads Manager and discover where to find them.
The first thing you see when you get to Ads Manager is your general dashboard. If you look at the top of the columns, you'll only see two of the metrics: Link Clicks and Website Purchases.
So where do you find the rest of these metrics?
Look for the button labeled Columns: Performance and give that a click. In the drop-down menu, you'll see 13 different reporting views to choose from.
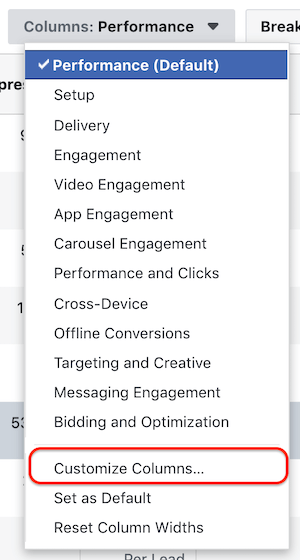
It's worth taking some time to familiarize yourself with each one, from Delivery and Video Engagement all the way down to Targeting and Creative. However, you're not going to use any of these reporting presets because the metrics are all over the place. Instead, create your own custom reporting view that includes the specific metrics we've talked about today.
To do this, select Customize Columns from the drop-down menu shown above.
The window that opens lists each metric that Facebook allows you to track from any of your ads. You can scroll through them all if you like but because you know the exact metrics you're looking for, it's easier to use the Search functionality to find them.
In the search bar, start typing in ROAS and you'll see the Purchase ROAS metric come up. Select the checkbox under Total (metric #1).
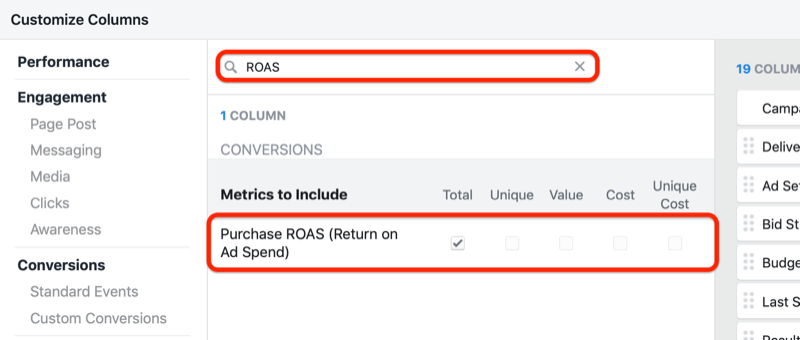
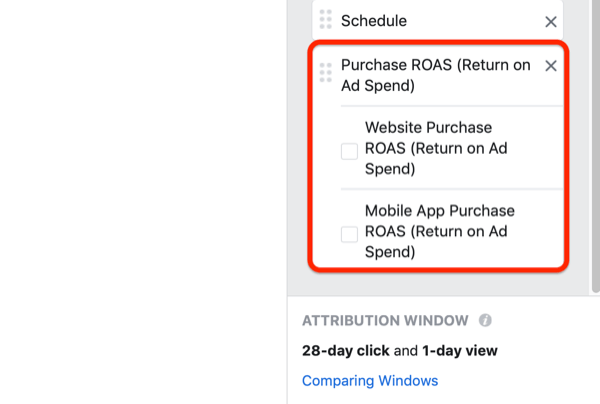
After you select Total, Facebook automatically adds this metric to the right-hand column. If you scroll down to the bottom of the list, you'll see options to show your Website Purchase ROAS and Mobile App Purchase ROAS. I recommend unchecking both boxes unless you have a website and an app where you're trying to track both metrics separately.
When you're done with ROAS, continue on to Purchase. Type “purchase” in the search bar and new options will appear. Next to Purchases, select the Value and Cost checkboxes (for purchase conversion value [metric #2] and cost per purchase [metric #3]).
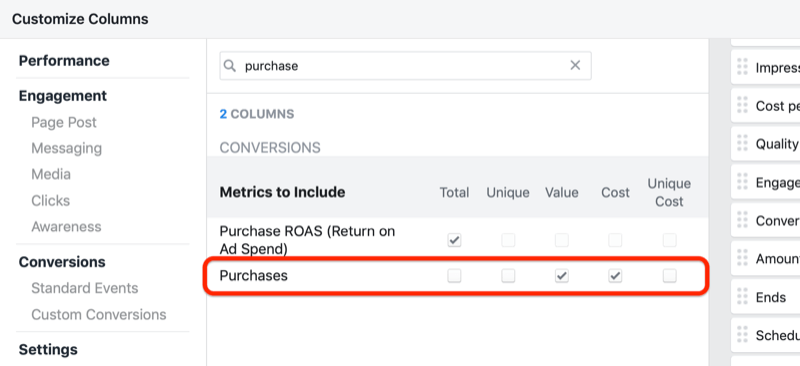
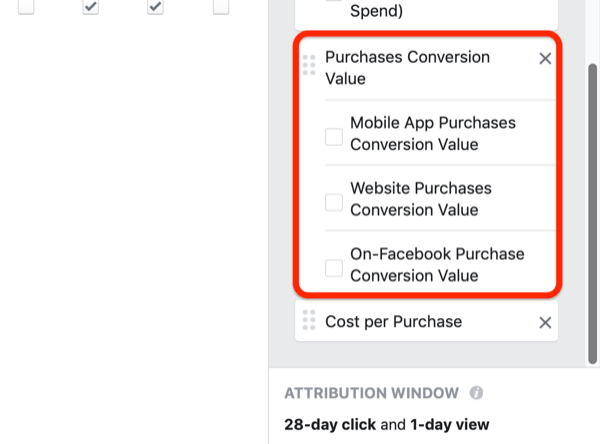
Again, these metrics show up on the right-hand side of the window. Be sure to deselect all of the checkboxes under Purchases Conversion Value.
Next up is your EPL. Unfortunately, you won't find your EPL inside of Ads Manager because it's a manual calculation. It's your total revenue divided by the number of leads you've generated from your Facebook ads (using the formula from metric #5 above).
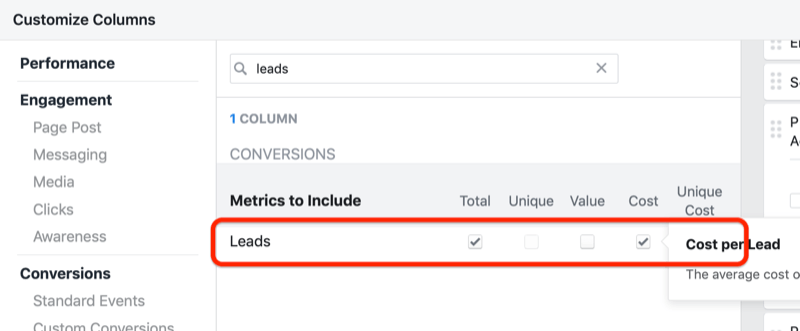
But you might be wondering how to find the number of leads generated. Well, that's simple—just add the leads metric to your custom report. Type Leads in the search bar and then select the Total checkbox. Also select the Cost checkbox beside it to add CPL (metric #6).
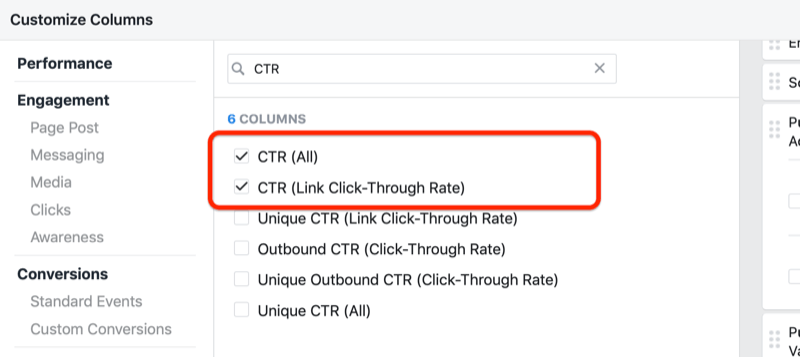
The last thing you need to do is search for CTR (metric #7). Select the checkboxes for both CTR (All) and CTR (Link Click-Through Rate).
Before you save your custom reporting view as a preset, confirm that there are no checked boxes in the right-hand column.
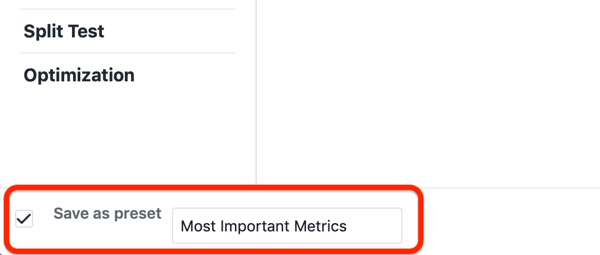
Then in the lower-left corner of the window, select Save as Preset and type in a name (like Most Important Metrics). Click Apply in the lower-right corner to apply your changes.
Now you'll see on the screen all of the metrics we've covered: ROAS, purchase conversion value, cost per purchase, total number of leads (to determine your EPL), CPL, and CTR (for both links and all engagements on your posts).
Pro Tip: To save time analyzing your ad results, check out three Facebook ads custom reports to help you quickly analyze ad performance: ROI Snapshot Report, Lead Progress Report, and Engagement Report.
Watch the video:
Conclusion
The biggest mistake that I constantly see marketers make when it comes to measuring their Facebook advertising results is thinking that they have to track everything. You don't need to know every metric under the sun. We started with seven simple metrics today and those can already feel like a lot to wrap your head around.
However, I want to assure you it doesn't have to feel so complicated. Give yourself permission to go into Ads Manager and experiment today. Your understanding comes from implementation (and a little bit of trial and error along the way).
Even if it doesn't feel like this data is making much sense to you now, down the line when you have more experience in Ads Manager, you'll slowly start to grasp the metrics that matter and how to use them to measure your results. Just be patient with yourself because it takes time.
What do you think? How will these seven Facebook ad metrics help you improve your campaigns? Share your thoughts in the comments below.
More articles on Facebook ads:
- Find out how to use Facebook ads to generate sales and leads quickly.
- Learn how to use Facebook’s Multiple Text Optimization feature to effortlessly customize your ads for different people.
- Discover how to use six types of Facebook ads to move people further along the customer journey.

Curious About How to Use AI?
Our newest show, AI Explored, might be just what you're looking for. It's for marketers, creators, and entrepreneurs who want to understand how to use AI in their business.
It's hosted by Michael Stelzner and explores this exciting new frontier in easy-to-understand terms.
Pull up your favorite podcast app and search for AI Explored. Or click the button below for more information.
