Want to learn more about using Google Analytics 4 (GA4)? Wondering what kinds of reports and insights GA4 can give you?
In this article, you’ll discover how to get started with GA4.
Why Has Google Analytics Changed?
It's official: from July 2023, Google has shut down Universal Analytics in favor of the newer platform. Even if you had a Universal account in the past, it will be deactivated, and its data will disappear soon, too.
You might be wondering what was wrong with Universal Analytics. It all comes down to one word: privacy.
In a statement about the platform change, Google used the word “privacy” seven times. The internet giant is under pressure from international legislation, privacy campaigners, anti-tracking browsers, and even a few lawsuits. Google just can't afford to collect the same amount of data in the same ways.
Google still has about 85% of market share in the web analytics business. GA4 is its bid to continue dominating the market as the internet—and online privacy—changes.
The new Google Analytics is designed to comply with current legislation and prepare analytics for the future. For example, Google plans to phase out cookies in the next few years so GA4 has been set up to eventually work without cookies.
But with less data, how does Google plan to fill the gap between Universal-style analytics and GA4?
GA4 uses predictive AI and data modeling to make up the difference. In theory, the analytics platform can get the same level of information with less intrusive or personalized data collecting.
There are some questions about how accurate this AI-supported data can be, but in general, you should see less than a 5% change in your data figures between Universal and GA4. If you're seeing big, unexplained changes, then check your website code. Analytics code for GA4 has to be high up in the site header to work correctly.
If you've recently made the switch, then GA4 is going to feel unfamiliar and possibly even unintuitive. Here's the good news: GA4 does have many powerful features. In some ways, it's a serious upgrade on standard Universal Analytics properties. And it's still free!
Before You Start Using G4
I covered how to set up Google Analytics 4 in 2022. But before you dive into those technical details—and before we start talking events, conversions, and reports—there's something more important you need to do.
What’s the goal of your website?
Most businesses and social media marketers miss this step but it's the key to collecting and interpreting data in a way that's actually valuable to your brand.
Which AI Moves Actually Matter?
That's what every marketer is wrestling with now. New AI strategies, new tools, new takes every week — but no clarity. Most marketers and business owners are trying to figure out AI alone.The AI Business Society is your trusted guide. Get expert-led training you can put to work immediately. Plus a community of marketers sharing what's actually working.
I'M READY FOR REAL AI RESULTSBefore you start:
- Pinpoint how your website makes money: leads, conversions, referrals…
- Decide which events you need to track. At first, try tracking one macro-event (like a lead or sale) and a couple of micro-events (such as visiting a page or filling out a form).
- Use the data you get to make your website more profitable than ever.
With this approach, you concentrate your efforts on what's most important. As you get more comfortable with GA4 over time, you can experiment with more events and handle a larger volume of data.
Now that we're clear on the right approach to take, let's get into the details.
#1: What's Changed From Universal Analytics?
There are four major differences between Universal Analytics and Google Analytics 4. If you were a fan of Universal in the old days, these are the points you need to get your head around as you make the switch.
The Data Model in GA4 Is Different
Universal Analytics used to track website “hits” and share reports on things like bounce rate but GA4 works differently.
Instead of website hits, the new analytics platform tracks events, which can include page views, clicks, scrolling, and more. This has some follow-on effects. For example, instead of tracking bounce rate, you'll see stats about your page engagement rate.
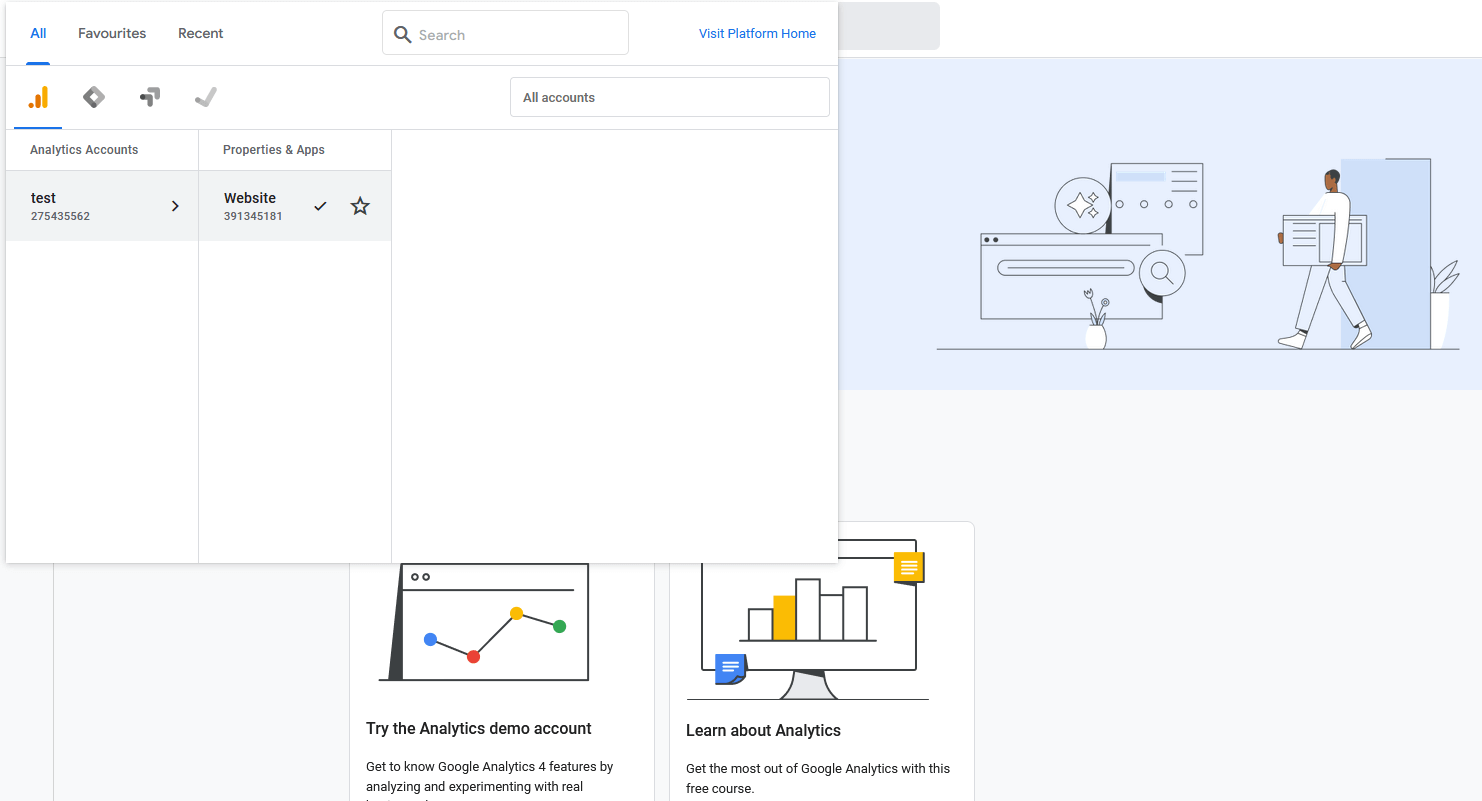
You Only Get One Data View in GA4
If you used Universal a lot, then you might have set up different data views. You could have separate views for your main website, test pages, and so on.
In GA4, all your analytics are in one view. Your website (and app, if you have one) are treated as one “property.”
If you want to separate regular pages from tests or website metrics from app data, then you can still do that with filtered reports. But you can't set up separate viewing modes.
You Need Event Parameters to Get Fine-Grained Data
Remember when I said that GA4 tracks events? Well, although events include a lot more than hits in Universal, they're still painted in pretty broad strokes.
For example, if you track link clicks as an event in GA4, it will just track the number of clicks. If you want to find out where people were on the page when they clicked or more details about their destination, then you'll need to set up event parameters.
Event parameters are extra criteria for recording events. They give you more specifics to help you understand the data. But just like setting up events themselves, you should be discerning about which parameters you want to track. Think about which information is most relevant for your business goals.
You Track Conversions Through Events, Not Goals
Back in the good ol' days of Universal Analytics, you could set goals for your website. Then Google would track conversions based on those goals.
GA4 is based on events, not goals. So when you want to track conversions, you have to generate a new event and label it as a conversion for GA4 to recognize it.
For example, let's say that you want to get users to sign up for a free trial. There are two conversions in this process: first, the micro-conversion of clicking the landing page, and second, the macro-conversion of filling out the signup form.
You might have other events on that page, too, such as scroll activity or session engagement. But only page clicks and form fills will be counted as conversions.
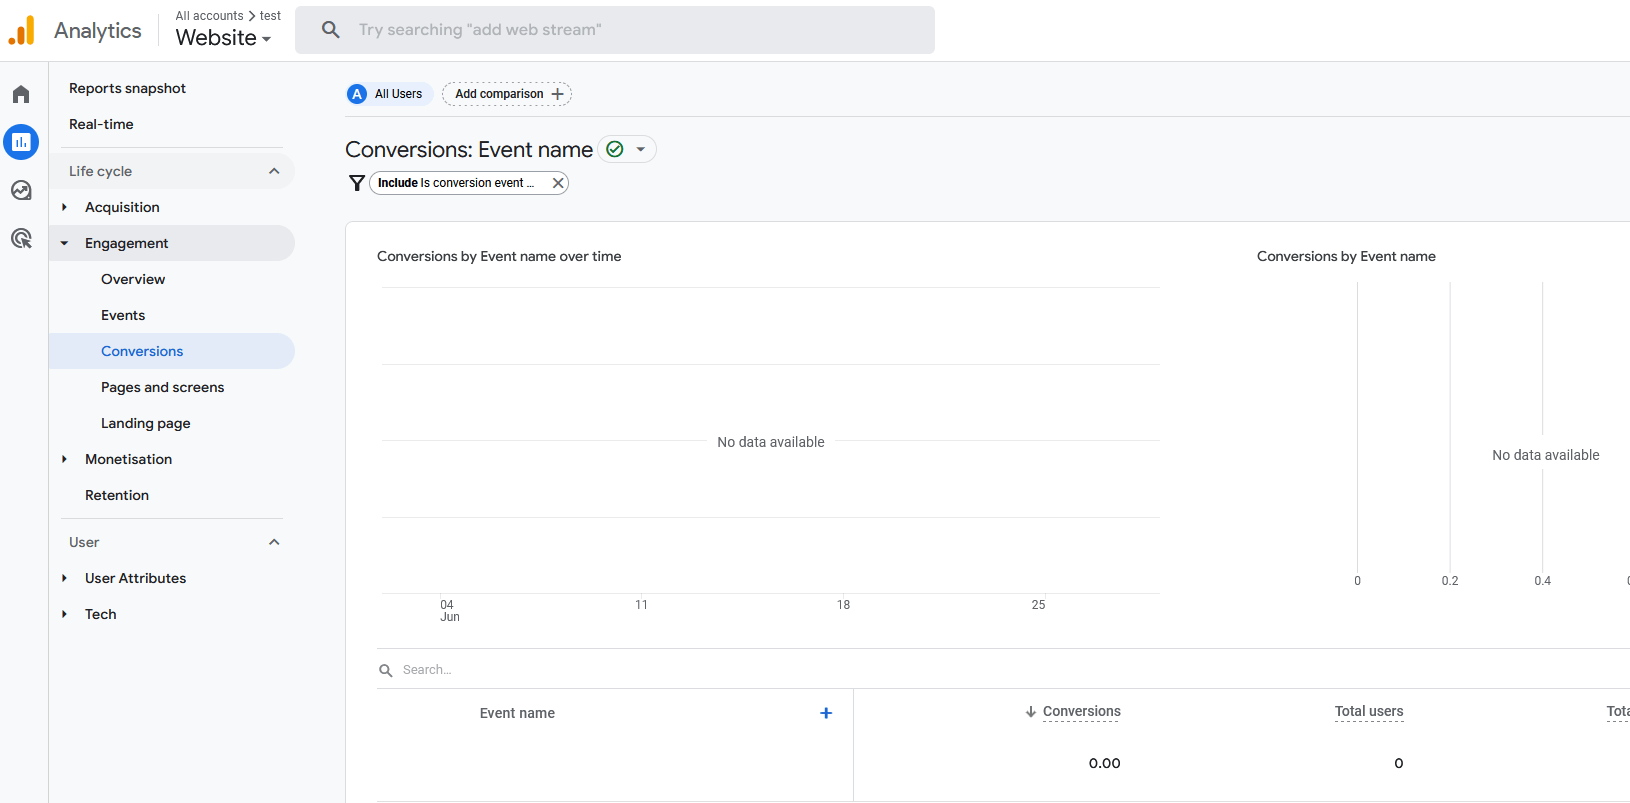
Once you have conversions set up, you'll be able to view that data in a few places:
- The conversions report. This is in the left-hand menu, right above Pages & Screens.
- The traffic acquisition report. This is one of the most powerful features of GA4 and we'll discuss it in more detail below. Conversion numbers and rates show up as a column on the far right.
- Custom reports. In GA4, you can build a custom report that links events, echoing the shape of your marketing funnel. In our example above, we could build a custom report that showed data from the page click and form fill together. You can add filters and segments to this report to get more insights into the funnel's performance.
#2: What Data Can You Track in Google Analytics 4
Overall, there are two categories of events in GA4: default and custom.
Default Events in GA4
There are two types of default events in Google Analytics 4.
3 Days of World-Class Training—Zero Travel!

Couldn't make it to Social Media Marketing World and AI Business World this year? Get all of the great content at a fraction of the price with a Virtual ticket.
That’s full access to recordings of every keynote, workshop, and session—the ones people travel thousands of miles to see. Don't wait. Get your Virtual ticket and enjoy actionable content that you can watch anytime, anywhere.
- Automatically collected events. These are the events Google always tracks, such as engaged session data (more on that in a minute) or the first visit to your website by a new user. You can't turn these off.
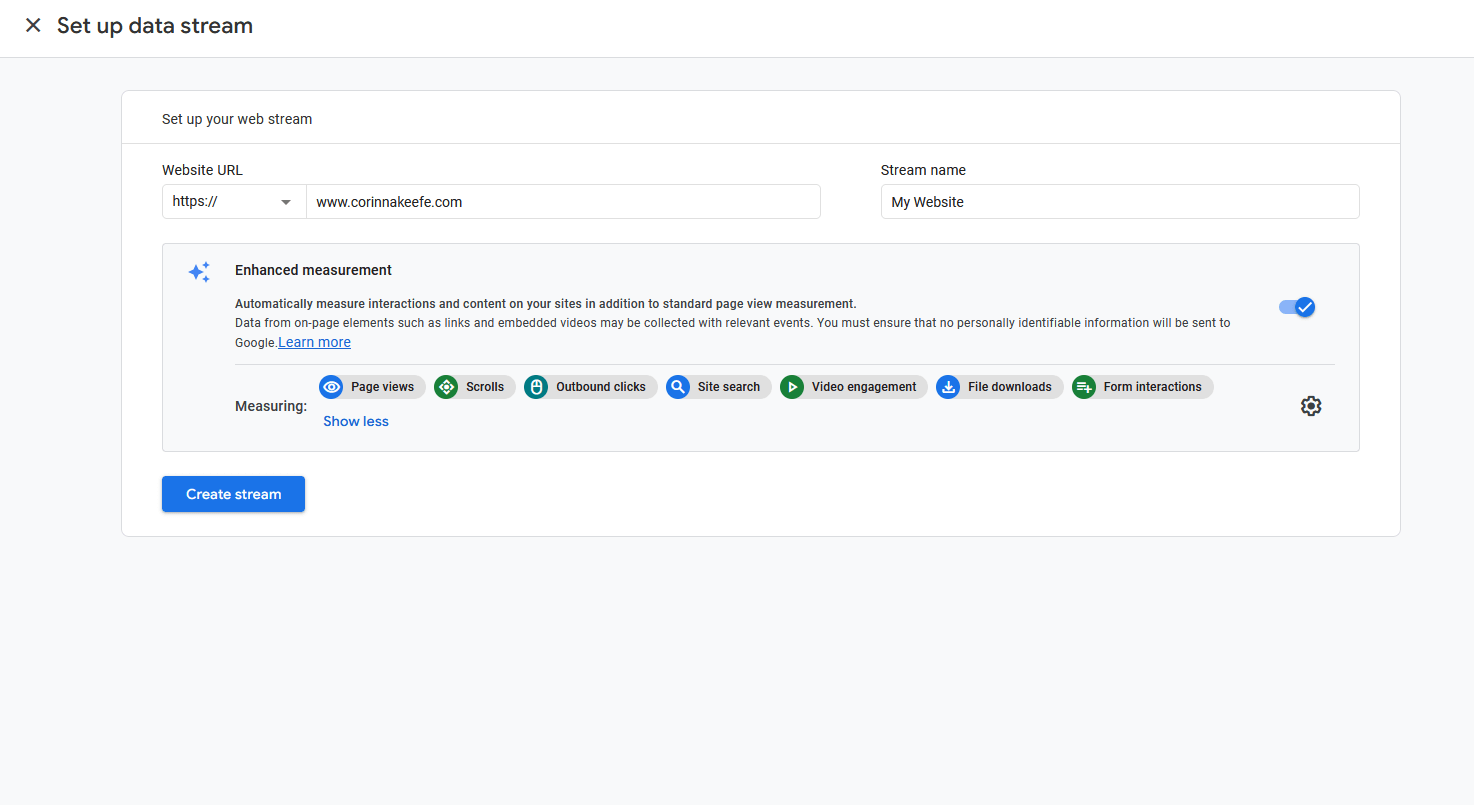
- Enhanced measurement events. These are ready-made events that Google can set up for you but you have to choose to switch them on. They include things like external link clicks, file downloads, video plays, and scroll activity. In the past, you had to set these events up in Tag Manager but now they're accessible within GA4.
You can toggle enhanced measurement events off and on in your admin profile, under Datastream Settings.
However, sometimes it's better to set up enhanced measurement events as custom events. For example:
- The “scroll activity” event triggers when a user scrolls through 90% of a page. If you want to trigger the event at a different percentage, then you'll need to make your own custom scroll event.
- If you want to track video plays from another hosting platform, such as Vimeo, you'll need a custom event. Enhanced measurement only covers YouTube videos.
- If you set up custom events that overlap with enhanced measurement, it's better to turn enhanced measurement off. Otherwise, your data might be skewed by counting the same events twice.
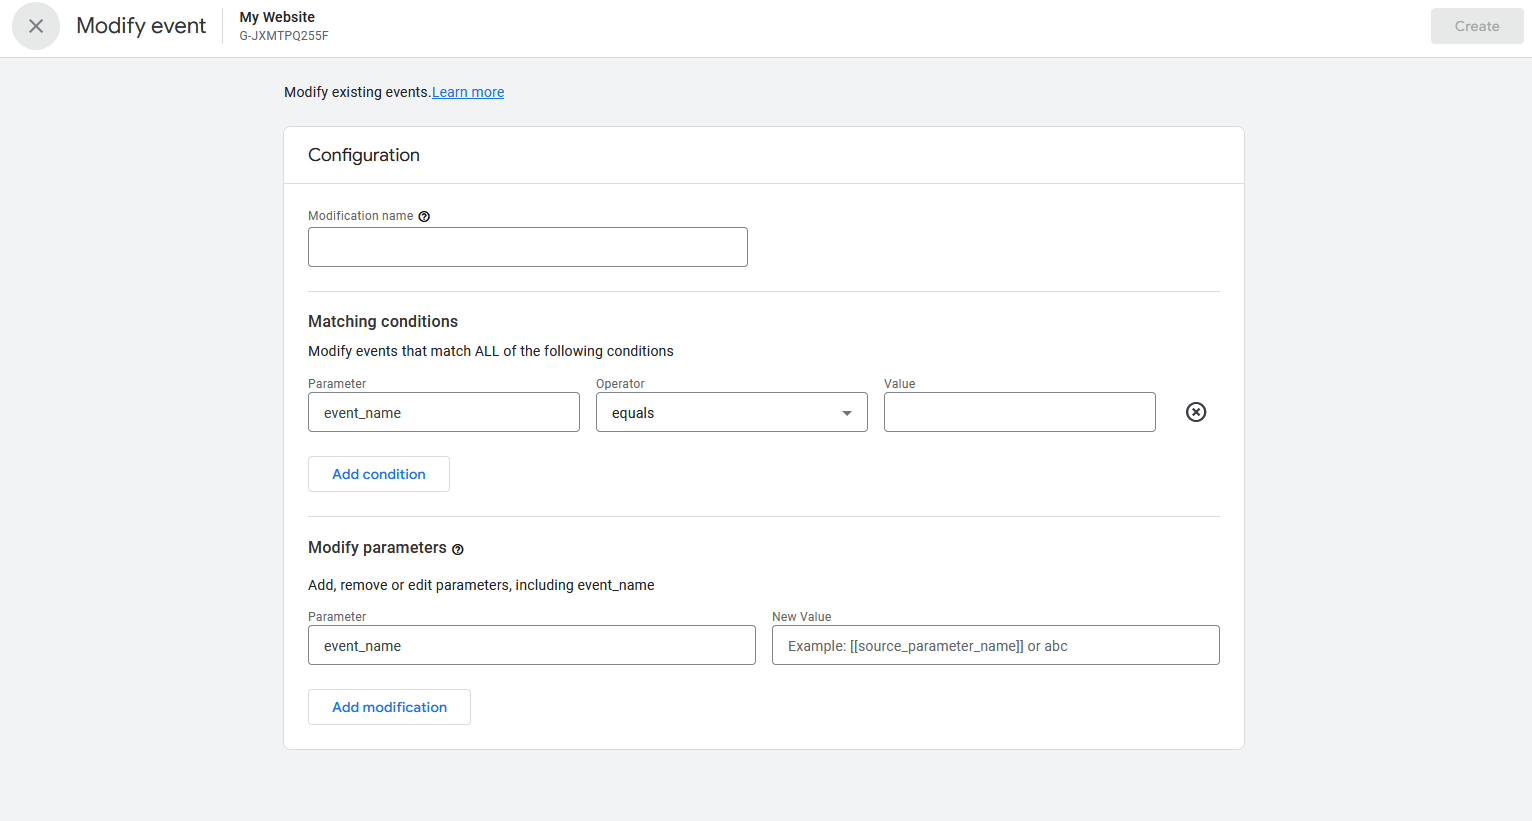
Custom Events in GA4
Just like default events, there are two types of custom events in Google Analytics 4.
- Recommended events. Google won't set these events up for you but it will support you in creating them. For example, if you want to generate custom events to track your eCommerce metrics, Google will suggest event names and parameters.
- Custom events. These are events that you create manually, without any input from Google. You can set these up and name them however you want.
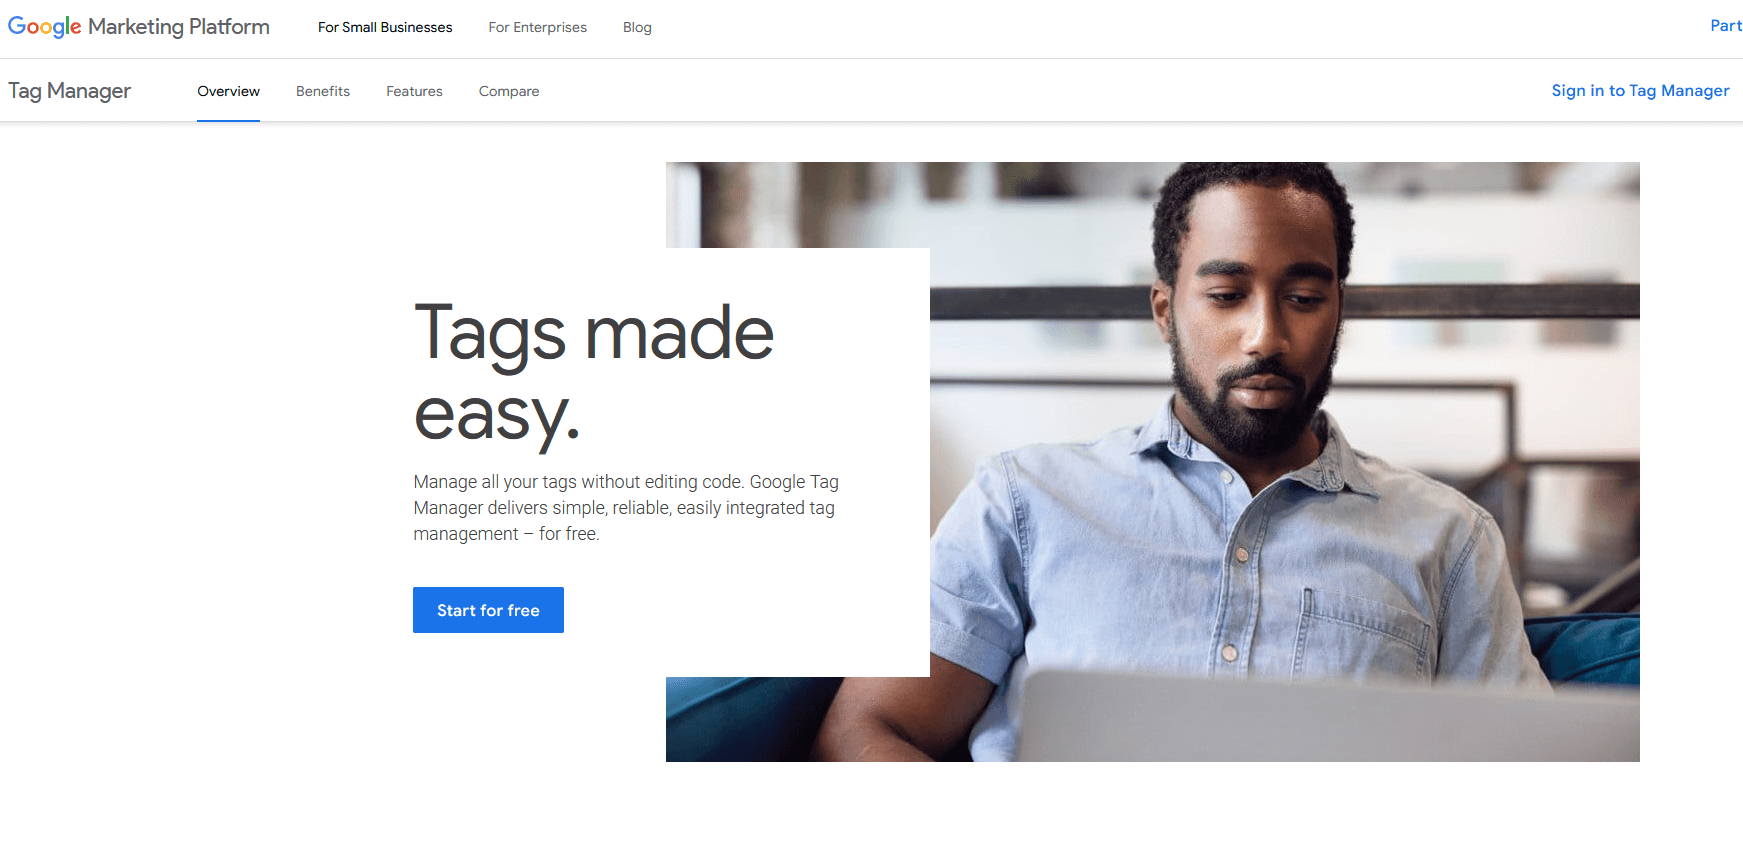
For most custom events, you’ll need to use Tag Manager alongside GA4. But GA4 does also have its own built-in tool for creating custom events. It's less flexible than Tag Manager but offers more guidance. You start with an enhanced measurement event as a template, then make any edits you want.
For example, you'll need to generate custom events to integrate eCommerce channels like WooCommerce and Shopify with plugins. Just know that some of these platforms are still catching up with the switch from Universal Analytics to GA4.
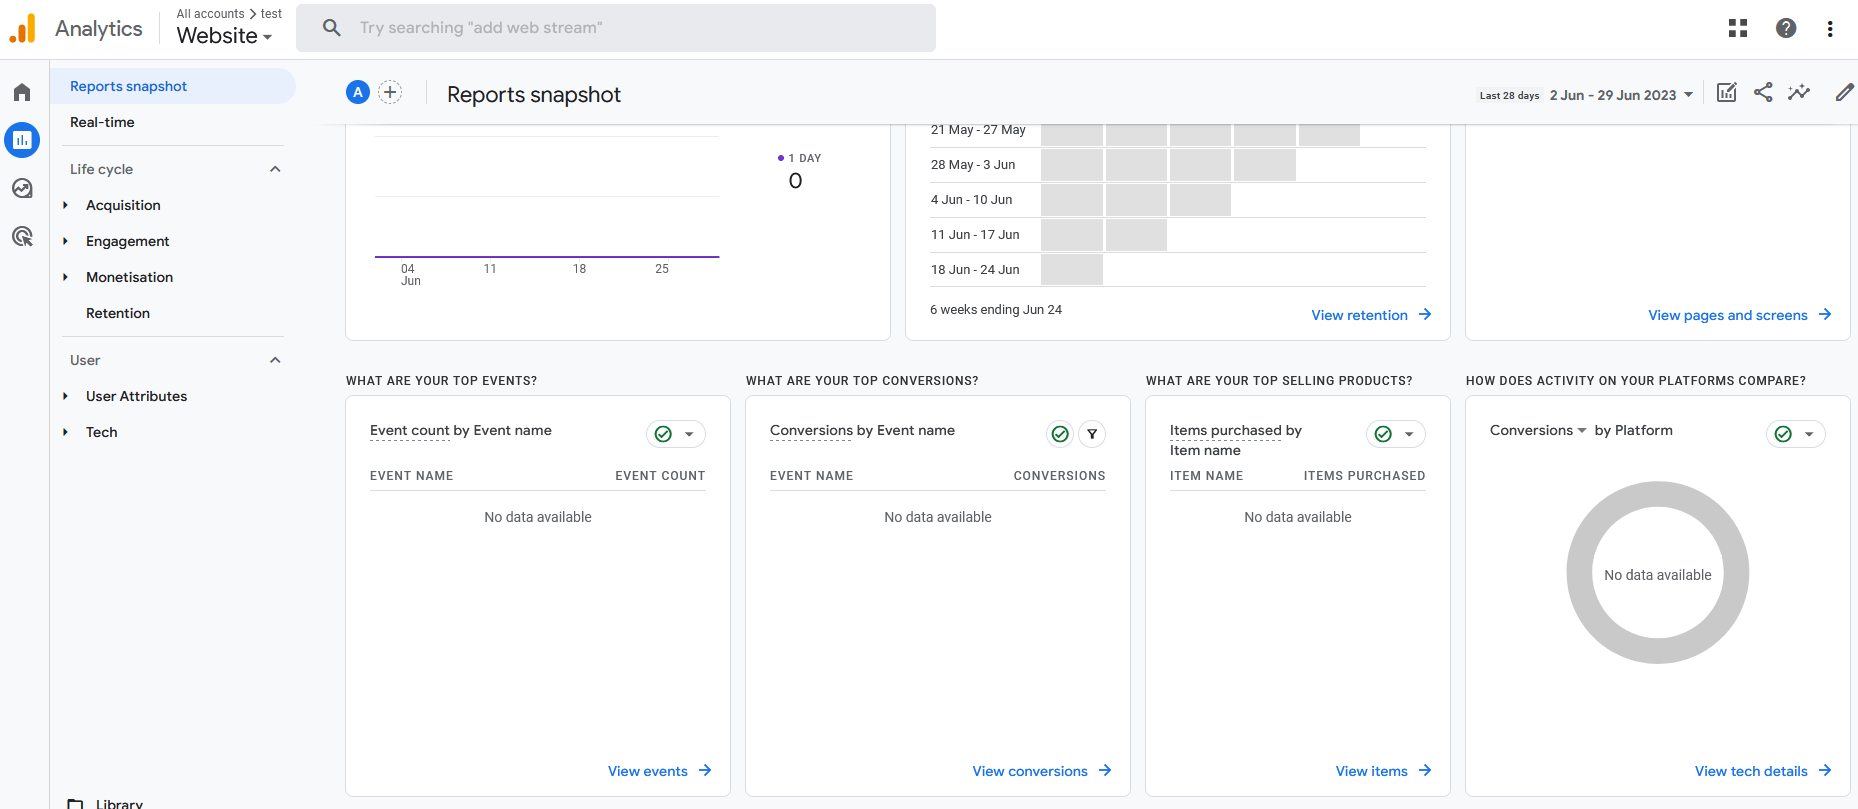
#3: What Reports Look Like in Google Analytics 4
Reporting works very differently in GA4. Compared to Universal Analytics, it has a sparse user interface with fewer built-in reports.
However, it also offers more customization than ever before. It has new sharing capabilities so you can send read-only reports directly to colleagues and clients instead of having to export data every time. For social media marketers who put in the time on the platform, Google Analytics 4 can be revolutionary.
There are two main reports that you should be checking in GA4: traffic acquisition and pages & screens.
Traffic Acquisition Report
The traffic acquisition report keeps track of where your users come from, including organic search, paid search, organic social, ads, email referrals, and more.
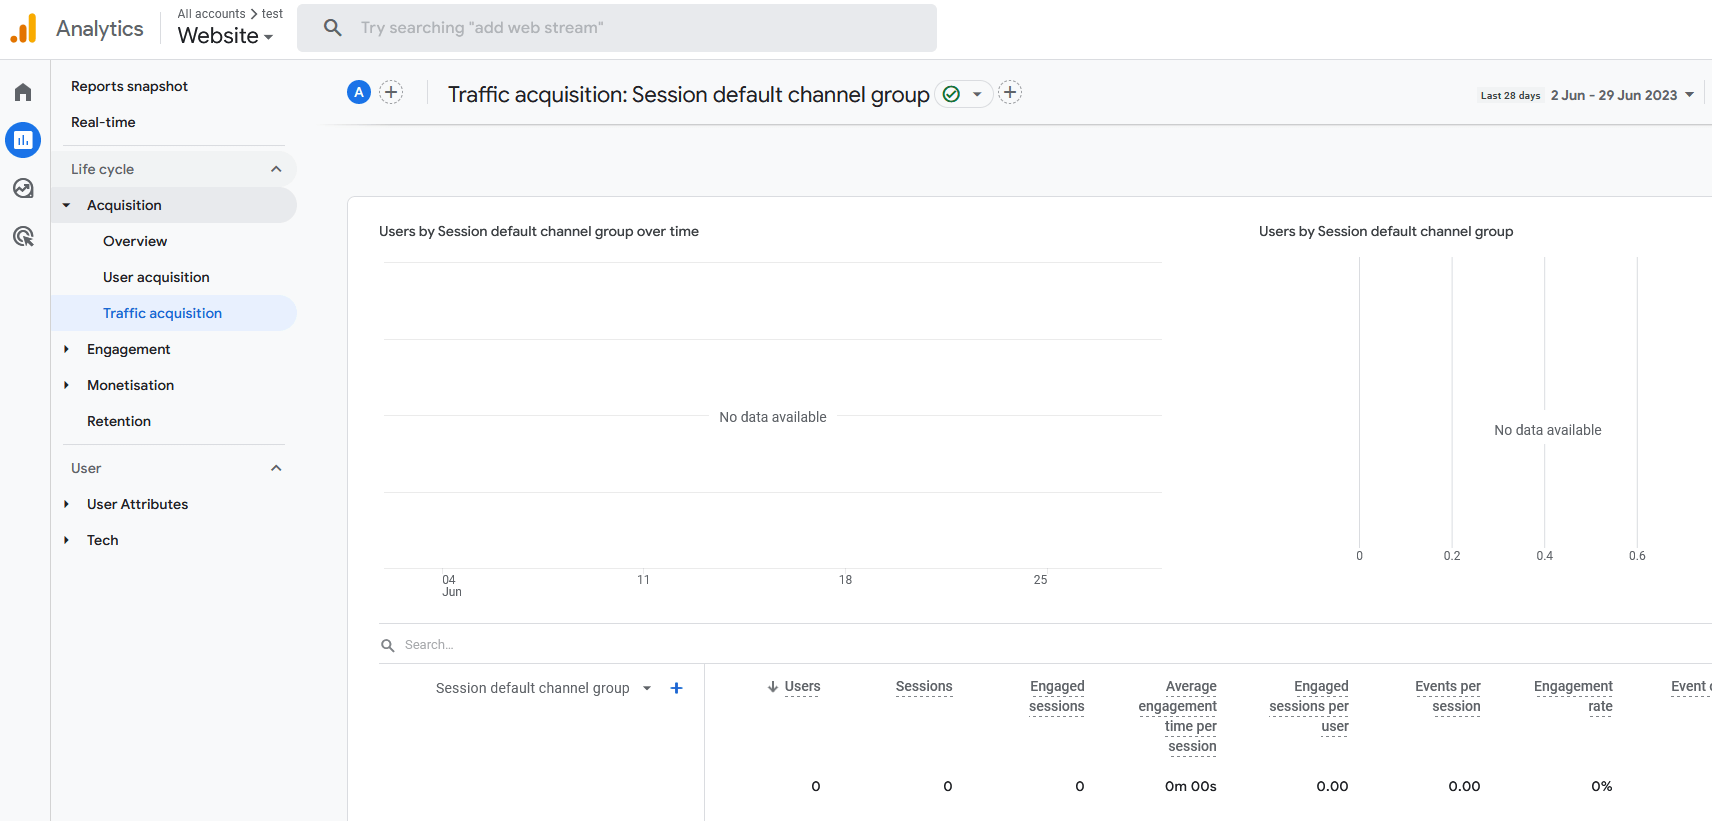
There's one key innovation. As well as showing the volume of traffic, the new GA4 report shows the quality of that traffic.
Google has introduced a new measure called engaged sessions. Users get tagged with an engaged session event when they meet one or more of these criteria:
- Spend 10+ seconds on a web page.
- View a web page multiple times.
- Convert on a web page. (Remember, you choose which events count as conversions.)
This information is far more valuable than simple hit rates and bounce rates. For example, when you can see which traffic sources get the most conversions, you know where to spend your marketing budget.
Pages & Screens Report
Pages & screens shows which content on your site has the best performance. It's similar to traffic acquisition because it displays traffic volume, sources, and engagement, but on a page level instead of across your whole site. This is where you can dig deep into the data and figure out exactly what works from page to page.
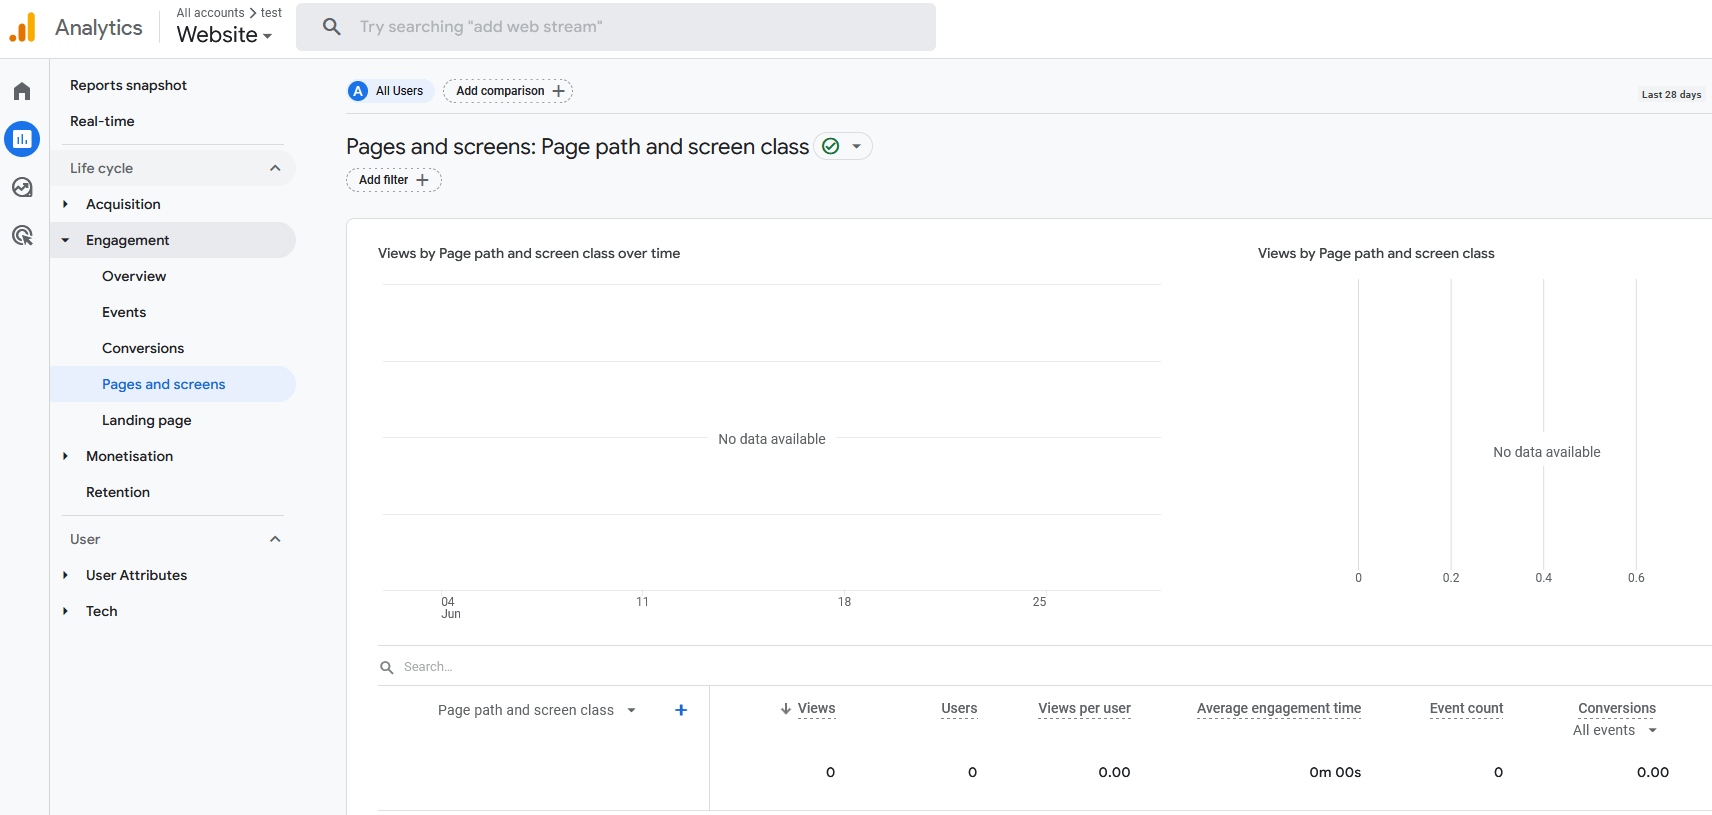
If you've been following the switch from Universal to GA4 for a while, you might remember that Google originally titled the project “App & Web.” That's because the main innovation of GA4 was that it could track website and app activity together, as part of the same business property.
Now, the new analytics platform has been renamed Google Analytics 4 but it still has the same capability. “Pages & Screens” refers to web pages and mobile app screens. If you want to track activity across all media, this is the report to focus on.
#4: Using the Explore Tab in GA4
There's one last feature of Google Analytics 4 that every marketer needs to know: the Explore tab.
If you've ever used Google Data Studio (now called Looker Studio), then it's a similar user experience.
In Explore, you can build custom reports called explorations with your own channels, metrics, time ranges, segments, and comparisons. You can also save them for repeated use.
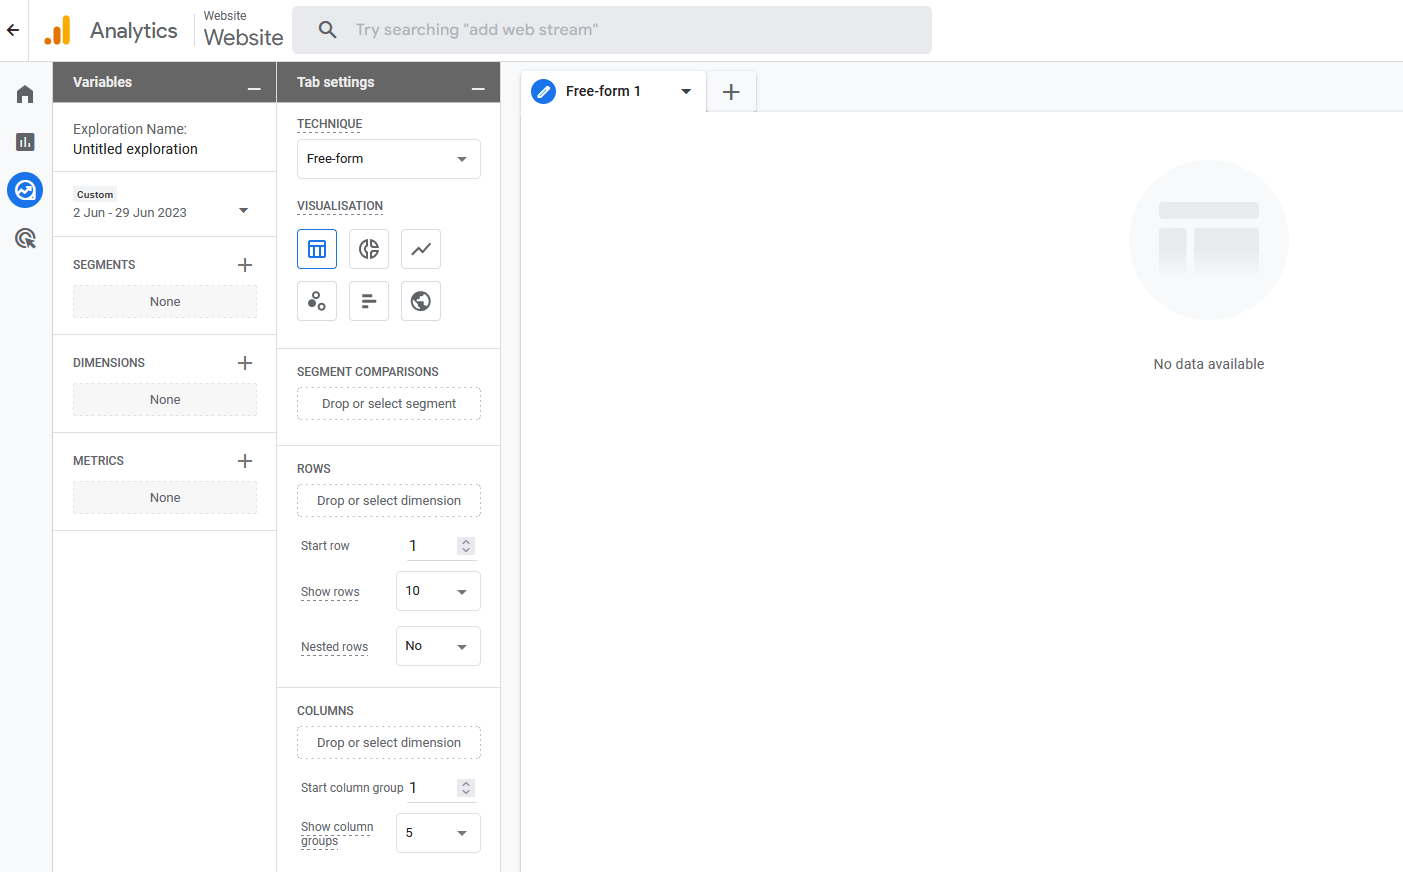
These custom reports are more time-consuming to set up than the ready-made reports but they're incredibly powerful and useful.
Have you tried out Google Analytics 4 yet? How do you think it compares to the old Universal Analytics?
Zack Duncan is an expert in Google Analytics strategy and president of Root and Branch Group, a consultancy that helps businesses be more profitable through analytics. His blog and YouTube channel are focused on analytics and SEO tips. Find him on LinkedIn @zackduncan or watch his YouTube channel, Rooted Digital.
Other Notes From This Episode
- Connect with Michael Stelzner @Stelzner on Instagram and @Mike_Stelzner on Twitter.
- Watch this interview and other exclusive content from Social Media Examiner on YouTube.
Listen to the Podcast Now
This article is sourced from the Social Media Marketing Podcast, a top marketing podcast. Listen or subscribe below.
Where to subscribe: Apple Podcasts | Spotify | YouTube Music | YouTube | Amazon Music | RSS
✋🏽 If you enjoyed this episode of the Social Media Marketing podcast, please head over to Apple Podcasts, leave a rating, write a review, and subscribe.
Stay Up-to-Date: Get New Marketing Articles Delivered to You!
Don't miss out on upcoming social media marketing insights and strategies! Sign up to receive notifications when we publish new articles on Social Media Examiner. Our expertly crafted content will help you stay ahead of the curve and drive results for your business. Click the link below to sign up now and receive our annual report!

Curious About How to Use AI?
Our newest show, AI Explored, might be just what you're looking for. It's for marketers, creators, and entrepreneurs who want to understand how to use AI in their business.
It's hosted by Michael Stelzner and explores this exciting new frontier in easy-to-understand terms.
Pull up your favorite podcast app and search for AI Explored. Or click the button below for more information.
