 Do you know how your Google+ business page is performing?
Are you using Google+ My Business analytics?
The Google+ Dashboard has greatly improved the analytics it offers for its platform.
In this article you’ll discover the Google+ Dashboard and the analytics included in each option.
Google+ My Business Dashboard
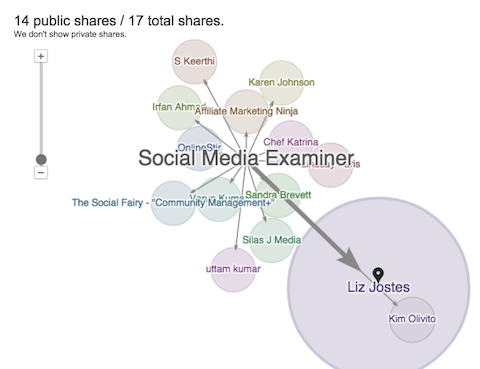
In the early days of Google+, analytics were limited to viewing the Ripples on an individual post. Thankfully, over time, Google+ has improved its analytics for business pages.
Now you can see analytics related to the past 30 days of activity for your Google+ business page, Google Analytics (if you’ve set it up for your website) and YouTube channel activity (if you have one connected to your business page). If your Google+ business page includes a physical address and map location, you’ll have an additional section with data for Google business reviews.
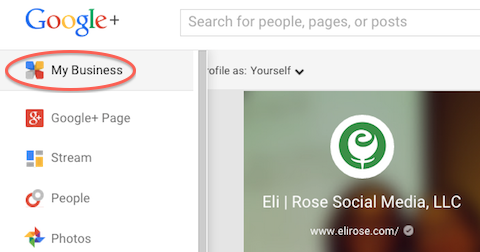
To access your Google+ Dashboard, go to your Google+ business page and select My Business from the left navigation menu.
You’ll end up on your Google+ Dashboard. Scroll down and you’ll see each option—Insights, Google Analytics, Reviews (if applicable) and YouTube channel. Click on each to view detailed data.
You’ll quickly see that your Google+ Dashboard is an excellent hub for viewing the analytics of all of your connected Google products.
#1: Insights
The Insights section gives you an overview of your Google+ page Insights for the last 30 days. Your Insights show numbers for Google+ post views, post actions and new followers. You can also see how each of those numbers has changed in the past 30 days.
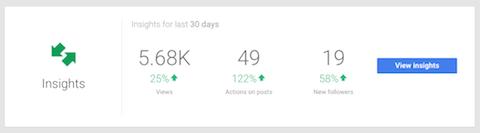
You have three types of analytics within your Insights: Visibility, Engagement and Audience. Click on the View Insights button to see them and get a more detailed view of your Google+ business page activity.
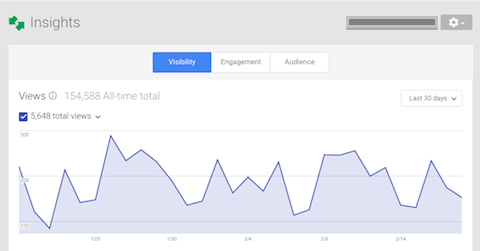
Visibility
The Visibility tab offers historical page view activity. You can choose the date range you prefer to analyze—the default view is the last 30 days, but you have the option to look at your data by the last 7 days, 90 days or all-time.
Get World-Class Marketing Training — All Year Long!
Are you facing doubt, uncertainty, or overwhelm? The Social Media Marketing Society can help.
Each month, you’ll receive training from trusted marketing experts, covering everything from AI to organic social marketing. When you join, you’ll also get immediate access to:
- A library of 100+ marketing trainings
- A community of like-minded marketers
- Monthly online community meetups
- Relevant news and trends updates
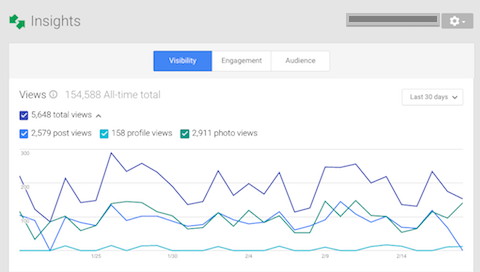
Click on the down arrow to the right of the total views count to reveal the data breakdown of your post views, profile views and photo views.
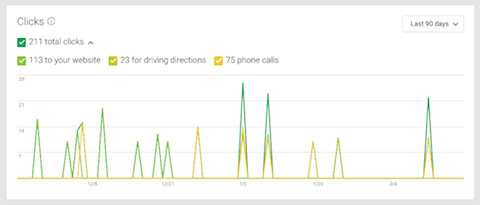
If you have your physical address included on your Google+ business page, you’ll have a few additional reports under the Visibility tab.
The Clicks report displays the number of people who visited your website from local search results, as well as the number of people who requested driving directions.
If you don’t have enough data for any one of these reports, you’ll still see that analytics section in this area, but with the message ”Not enough data.”
You can also see the number of phone calls and sort that data by day of week or time of day. Identifying phone call trends may also help you identify foot traffic trends in your store.
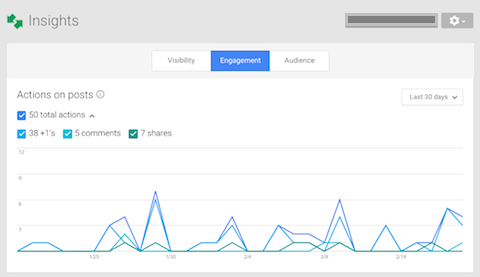
Engagement
The Engagement tab shows +1, comment and share activity on your posts. Click on the arrow next to the total actions count to see the specific activity breakdown.
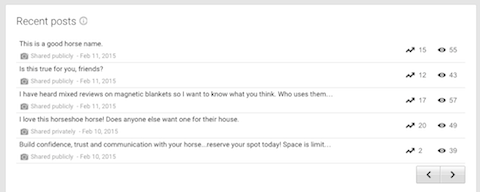
Scroll down a little further to see your Recent Posts analytics, as well as data for average activity by post type. Your Recent Posts section displays post titles and dates, along with a count of actions taken and the number of views of each post.

Discover Proven Marketing Strategies and Tips
Want to go even deeper with your marketing? Check out the Social Media Marketing Podcast! Publishing weekly since 2012, the Social Media Marketing Podcast helps you navigate the constantly changing marketing jungle, with expert interviews from marketing pros.
But don’t let the name fool you. This show is about a lot more than just social media marketing. With over 600 episodes and millions of downloads each year, this show has been a trusted source for marketers for well over a decade.
The Average Activity by Post Type graph gives you a snapshot of which post type resonates the most with your audience. Click on one of the graph bars to see the activity breakdown of +1s, comments and shares for a post.
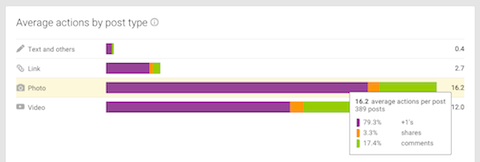
Knowing the specific actions taken on each post type can help with your social media content planning.
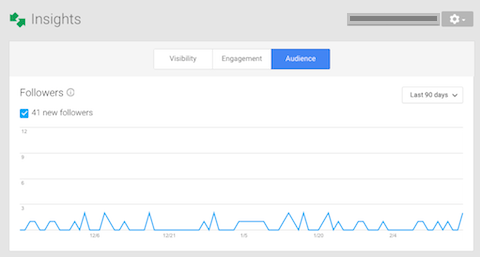
Audience
The top section of your Audience tab lets you see the recent follower growth pattern of your Google+ page.
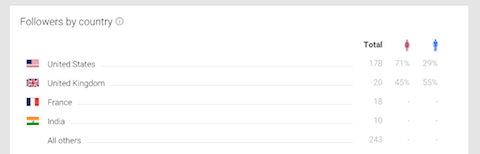
Below that is a chart showing all followers broken out by country. Google+ only shows the significant values, so if your total number is too low, you may not be shown the male/female breakdown by country.
Scroll down a bit more and you’ll see the gender and age graph. Hovering over any section of the graph shows you what percentage of each gender falls into that age category.
#2: Google Analytics
Just below the Insights section on your Google+ Dashboard, you’ll find Google Analytics. If you have a Google Analytics account set up for your website, this overview section will show the number of new website visits, unique visitors and the total number of website page views you’ve received in the past 30 days.
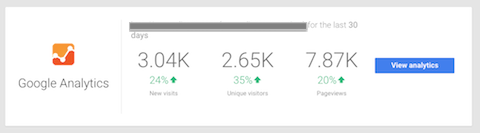
To directly access your Google Analytics account for a more in-depth look at your website analytics, simply click on the View Analytics button.
#3: Reviews
If you have a physical address associated with your Google+ business page, you’ll find Reviews just under the Google Analytics section.
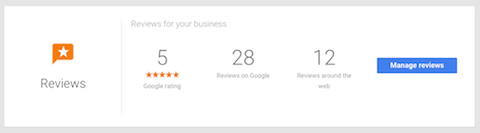
The Reviews overview will give you your average star rating, as well as the total number of business reviews, Google reviews and reviews on other sites around the web.
Click on Manage Reviews to access your Inbox and Analytics.
Inbox
Your Inbox provides a convenient interface to monitor and follow up on any reviews needing your attention. Google reviews are shown at the top of the screen, with additional reviews underneath (like those from other sites such as SuperPages.com, MerchantCircle.com and Yahoo).
Google Reviews show the Google user’s name, the star rating he or she gave you, the date of the review and the full text of the review. As the business owner, you have the option to directly reply to the Google review.
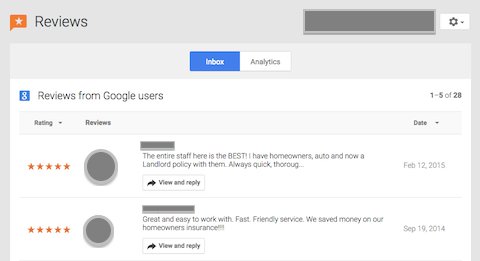
Reviews aggregated from other sources (including websites) show the star rating, source and date of each review along with the review itself.
Analytics
Next to your Inbox tab is your Analytics tab. The Analytics tab provides a breakdown of where your reviews came from and the star ratings from each platform.
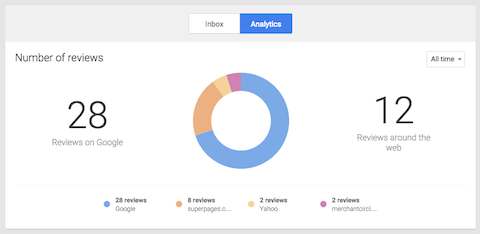

If you discover that you have a lot of review activity on a specific website directory, it may be worth exploring how to claim and list your business on that site.
#4: YouTube Channel
The last element of your Google+ Dashboard is your YouTube channel.
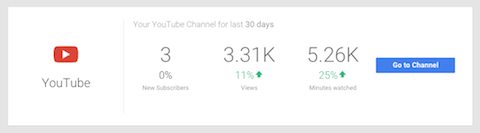
If you have a YouTube channel connected to your Google+ page, you’ll see the number of new channel subscribers, views received and minutes watched in the past 30 days. The Go To Channel button takes you to your YouTube channel home page.
Final Thoughts
Your Google+ My Business Dashboard serves as a hub for your other integrated Google products like Google Analytics, online business reviews and YouTube channel activity.
Having information about how effective—or ineffective—you are at reaching and engaging with your customers can help guide your future Google+ tactics and content.
What do you think? Have you explored your Google+ Dashboard? What kinds of posts receive the most actions for you? In the comments below, share which section of the Google+ Page Dashboard is the most useful to you.
Attention Agency Owners, Brand Marketers, and Consultants

Introducing the Marketing Agency Show–our newest podcast designed to explore the struggles of agency marketers.
Join show host and agency owner, Brooke Sellas, as she interviews agency marketers and digs deep into their biggest challenges. Explore topics like navigating rough economic times, leveraging AI, service diversification, client acquisition, and much more.
Just pull up your favorite podcast app, search for Marketing Agency Show and start listening. Or click the button below for more information.
