 Do you want to understand your social media return-on-investment (ROI)?
Are you tracking the customer journey in Google Analytics?
In this article you'll discover how to collect and analyze the data you need to properly calculate how social media marketing impacts your business.

#1: Create a Custom Segment
The good news is that you already have data you can segment into control groups. When someone visits your website from a social media network, Google has an automated way of identifying that user and adding him/her to reporting under Acquisition > Social.
The challenge with the data setup is that you have a limited number of reports you can view, and you have very little control over how the data is displayed.
The solution: Set up a custom segment that mirrors how Google Analytics automatically tracks the traffic from each social network. Here's how:
Log into Google Analytics.
- Go to Acquisition > Social > Network Referrals. Hover over any of the social networks in the report to see how Google determines the traffic from that network.
- At the top of the page, click on Add Segment, then click the red New Segment box.
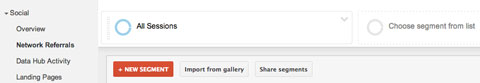
- Title the report GA Default Social Users.
- Click on Conditions.
- Select Source Contains and type in what you saw in the drop-down list (e.g., Twitter.com). Using Twitter as an example, you'll notice other types of Twitter traffic come up as you type. Take note of what shows up and add those too. You can do that by clicking OR and typing the new criteria.
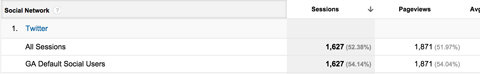
- Review the All Sessions numbers to see if they match the Default Social Users numbers. If they don't, follow steps 8 and 9 to edit the segment.
- Click on the arrow next to the segment at the top of the page and select Edit.
- Repeat this process for each social network until all of the numbers match.
- Type in the network name and see if additional traffic sources show up. If they do, add them to your segment. Then check again to see if the All Sessions numbers match the GA Default Social Users number.
If you have a lot of social traffic, you may run out of fields if you keep selecting OR for each criterion. If that's the case, consider using Regex to include multiple criteria in one field.
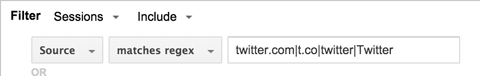
To use Regex, select Source > Matches Regex. Use the pipe (see the image above) with no spaces before or after each criterion to signify OR. To get the pipe, hold shift and press the backslash key.
#2: Isolate Social Media Users in the Data Set
The next step is to set up the data so you can isolate traffic into two groups: default social users and social link clickers.
Default users are those who came to your site from social media and are automatically tracked by Google Analytics. These users did not come from the links you created and shared.
Social link clickers are users who clicked on the links you distributed on your social media properties and the earned traffic that resulted from shares of those links.
3 Days of World-Class Training—Zero Travel!

Couldn't make it to Social Media Marketing World and AI Business World this year? Get all of the great content at a fraction of the price with a Virtual ticket.
That’s full access to recordings of every keynote, workshop, and session—the ones people travel thousands of miles to see. Don't wait. Get your Virtual ticket and enjoy actionable content that you can watch anytime, anywhere.
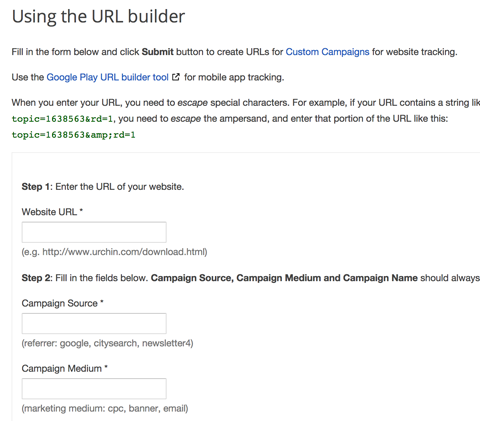
To isolate the two groups, use the Google URL builder to create trackable links you can share on your social networks.
Which AI Moves Actually Matter?
That's what every marketer is wrestling with now. New AI strategies, new tools, new takes every week — but no clarity. Most marketers and business owners are trying to figure out AI alone.The AI Business Society is your trusted guide. Get expert-led training you can put to work immediately. Plus a community of marketers sharing what's actually working.
I'M READY FOR REAL AI RESULTSFirst, I suggest you create an excel spreadsheet that includes all of your sources and media so you can copy and paste them into the URL builder and keep your data clean.
Before you complete the URL builder fields, be aware that capitalization and spacing matter! Whether you're using title case or lowercase, be consistent. For example, Ebook, ebook , E Book and EBook will show up as separate data sets in Google Analytics.
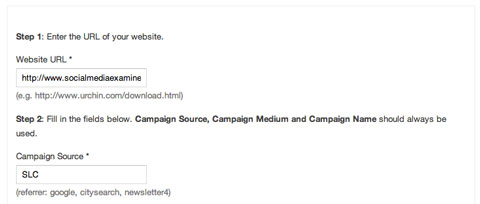
In the URL builder, type in the URL you want to share. This must be a link to your website.
Step 2 in the URL builder is where you add meta data to your link that Google Analytics will be able to read and include in your data set.
In the Campaign Source field, type SLC + (the social network). SLC means social link clicker and is the key to isolating these users. Be sure you include it!
Enter the content type in the Campaign Medium field (e.g., blog post, infographic, video, etc.).
Type the content title in the Campaign Name field (e.g., How to Create Social Media Control Groups in Google Analytics).
When you're done, click Submit. You'll get a long URL—copy it and shorten it with your social media management tool. Next, add your status update and post it.
Follow the steps in section #1 to add a custom segment that contains SLC in the source so you can run reports.
#3: Analyze the Data
Before you analyze your data, come up with a list of questions you want the data to answer, and then list the metrics you'll use to answer those questions.
Here are a few ideas for questions to answer: Does sharing content on social channels influence consideration for products and services? Does sharing content published on your website influence a higher or lower propensity for consideration? Does curating content influence a higher or lower propensity for consideration?
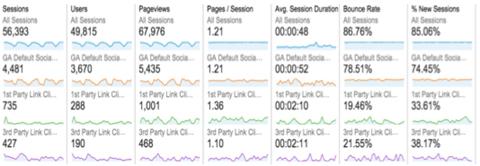
To conduct your analysis, use the custom segments you created for GA default social users and social link clickers.
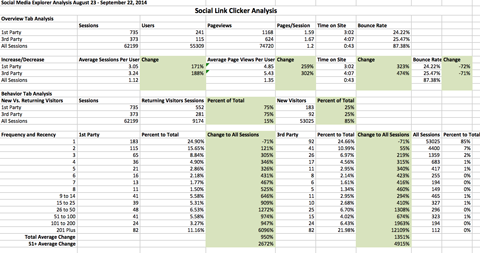
Navigate to the reports that hold the metrics you want to analyze, then copy and paste the metrics into an Excel spreadsheet or use the Export function to create a file with raw data that you can open in Excel.
Calculate the percent changes from one group to the other to see where the outliers are and highlight the insights you find in the data.
Wrapping Up
Interested in conducting an analysis like this inside of your Google Analytics account? Here are resources with the pre-built segments and a custom report on goal conversion data.
Understanding how to measure social media ROI has been the number-one topic marketers want to understand for the last four years.
Look at how social media influences the customer journey of awareness, engagement, consideration, acquisition, retention, advocacy and loyalty.
Use Google Analytics to set up control groups to identify the website visits.
What do you think? Have you performed control group analyses within Google Analytics? Do you have advice or findings to share with others? Please leave a comment below and join the conversation.

Curious About How to Use AI?
Our newest show, AI Explored, might be just what you're looking for. It's for marketers, creators, and entrepreneurs who want to understand how to use AI in their business.
It's hosted by Michael Stelzner and explores this exciting new frontier in easy-to-understand terms.
Pull up your favorite podcast app and search for AI Explored. Or click the button below for more information.
