 Do you want to analyze your social media marketing efforts?
Wondering which metrics to focus on?
Auditing key social media metrics can reveal which aspects of your social media marketing are working and provide insight into which areas you can improve upon.
In this article, you'll discover five ways to analyze the effectiveness of your social media marketing.

Create a Social Media Audit Spreadsheet
There are dozens of metrics you can analyze during a social media audit. Deciding which ones to focus on will depend in part on your goals and the platforms you're using. However, there are some key metrics everyone should analyze.
But before getting into that, create a spreadsheet for the data you'll track. This will make it easy to compare past audits with current ones. Google Sheets is a good tool to use because your entire team can access it online. It's also easy to duplicate sheets for future audits.
In the first column of the spreadsheet, list all of the social networks you're going to audit. Then add a column for the number of followers you currently have and a column for % change in followers. If this is your first audit, you won't need to use the Followers Change column. In future audits, you'll add the change in follower percentage, which can be positive or negative.

From here, add a regular column and a % change column for all of the metrics discussed below. When you analyze these metrics, you'll add your data to this spreadsheet. Also be sure to note the date of the audit and conduct your audits at fixed intervals.
Now let's check out the key metrics you'll need to analyze with your social media audit.
#1: Examine Follower Growth to Identify Anomalies in Audience Behavior
The number of social media followers you have matters because bigger numbers translate to higher levels of engagement and more traffic.
To find out your total number of followers, you can simply visit your social network and look at the number displayed on your profile. However, you'll get better insights if you go into your social media analytics and look at the graph for follower growth. Look for any outliers in the data.
For example, suppose the graph below represents the followers/likes growth of your Facebook page. As you can see, the daily likes growth is consistent, except for the day when the line spiked with more than 60 likes.
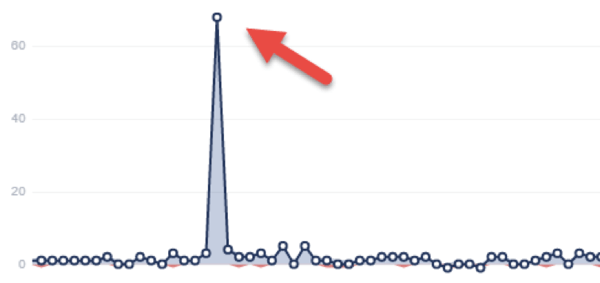
If you simply checked the total number of likes displayed on your Facebook page, you wouldn't know about this spike. But now that you do, you can start digging into why spikes occurred. Check what you posted on that day or see if someone else tagged you.
Get World-Class Marketing Training — All Year Long!
Are you facing doubt, uncertainty, or overwhelm? The Social Media Marketing Society can help.
Each month, you’ll receive training from trusted marketing experts, covering everything from AI to organic social marketing. When you join, you’ll also get immediate access to:
- A library of 100+ marketing trainings
- A community of like-minded marketers
- Monthly online community meetups
- Relevant news and trends updates
You'll want to look at analytics for all of your social networks to examine follower growth. Be sure to add your current number of followers to your spreadsheet.
If you find it a slog to go through every social network's built-in analytics, use a social media dashboard tool like Cyfe, which displays the follower growth of your top social networks in one place. Cyfe makes it easy to track and monitor your social media data so you can evaluate the total ROI and success of your social activities.

#2: Look at Impressions to Spot Irregularities in Reach
The impressions metric is the number of people who've seen your social media updates. All of the top social networks have built-in analytics that show the number of impressions your updates receive.
For example, on Twitter, go to Twitter Analytics and visit the Tweets tab to see the number of tweet impressions. Look for spikes in impressions on particular days, and then take a closer look to see what caused them.
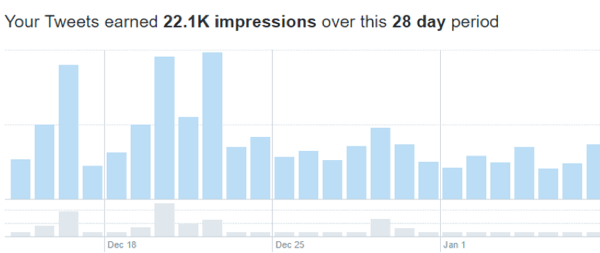
Go through all of the social networks you're auditing and record the number of impressions you're generating on your social media audit spreadsheet. Keep in mind that the impressions metric might have a different name on some networks. For example, Facebook refers to it as “people reached.”
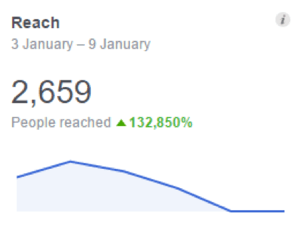
When you add total impressions to your spreadsheet, also make a note of your posting frequency for that period. Sometimes your impressions will increase just because you posted a few extra updates. This is why it's good to stick with a fixed number of updates each month; it will make your audit more accurate.

Discover Proven Marketing Strategies and Tips
Want to go even deeper with your marketing? Check out the Social Media Marketing Podcast! Publishing weekly since 2012, the Social Media Marketing Podcast helps you navigate the constantly changing marketing jungle, with expert interviews from marketing pros.
But don’t let the name fool you. This show is about a lot more than just social media marketing. With over 600 episodes and millions of downloads each year, this show has been a trusted source for marketers for well over a decade.
#3: Monitor Engagement to Find Peaks and Valleys in Interactions
Followers and impressions are useless if you're not getting any engagement. Increases in the two metrics discussed above should be proportional to increases in engagement.
When you get a good amount of engagement in the form of likes, repins, retweets, and comments, it means your followers are interested in the content you're sharing. You can then focus on replicating the techniques that brought you these results.
For example, if you're auditing your Pinterest page's engagement rate, go to your Pinterest analytics and look at the platform's biggest engagement currency: repins/saves. The graph below shows that engagement was down 10%, so you'd want to know what caused this drop.
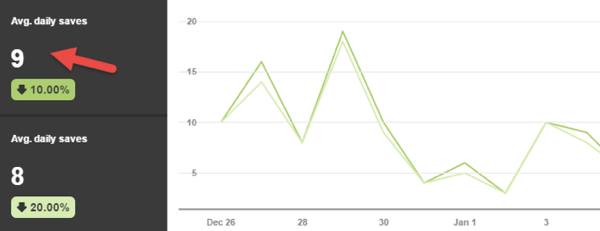
On your spreadsheet, make a note of the average daily saves that Pinterest displays. Or if you prefer to look at the total, add up the total saves for each day and note that sum.
If the network you're auditing lets you post different media, also look into which types of media (photos, links, videos, etc.) are driving the highest engagement.
#4: Review Clicks and Traffic to Reveal Inconsistencies With Website Experience
Clicks are actually a form of engagement, but let's consider them a separate metric because they influence traffic. While analyzing clicks and traffic, look for the number of clicks to your website in your social media analytics, and find your traffic numbers in your website analytics.
Not all clicks will result in traffic, however; a handful of people will leave while your page is loading. If the difference between clicks and traffic is massive, it's an indication there's something wrong with your site, probably the loading time.
You can easily check your social media traffic using Google Analytics. Go to your website's dashboard and click Acquisition > Social > Network Referrals.
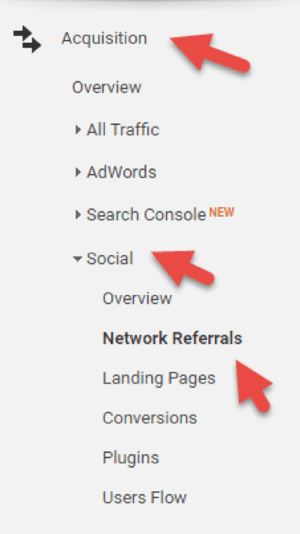
This section includes a graph of the total number of social network referrals and a list of the number of referrals from each social network. Make a note of the referred traffic for each social network on your spreadsheet.

#5: View Mentions and Sentiments to Assess Overall Brand Reputation
Mentions are the number of times other social media users tag your social media page or even just write your company's name. To accurately track this metric, you need to use a social listening tool such as Brand24. When you enter your company name, Brand24 will find all of your mentions.
In the graph below, the dark blue line represents the number of mentions and the aqua line indicates the social media reach of these mentions. You'll want to note both mentions and reach on your spreadsheet.
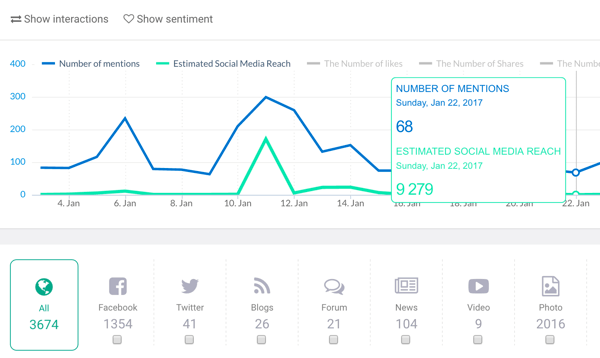
If you want to go a step further, include the number of likes, shares, and comments from the updates mentioning your company.
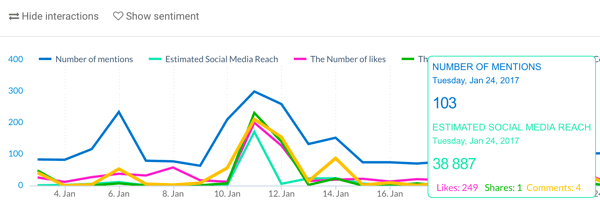
Not all mentions are the same, however. They can be positive or negative. In the graph below, the green line indicates the number of positive mentions and the red represents the negative.

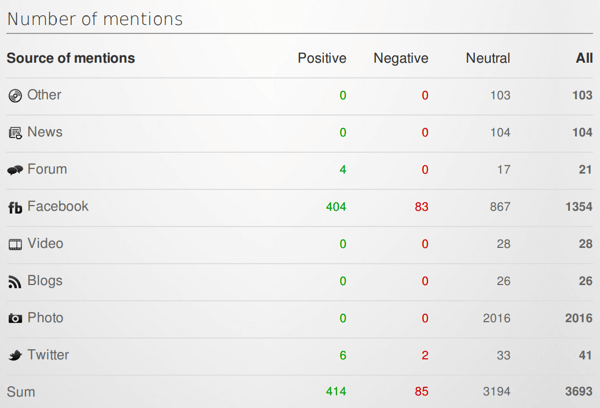
The easiest way to get the total mentions, positive results, and negative results on Brand24 is to create a report.

Look through the report and add the relevant numbers to your spreadsheet.
Conclusion
Followers, impressions, engagement, clicks/traffic, and mentions are important metrics to analyze while conducting a social media audit.
For your first audit, track the relevant data and add it to your spreadsheet. This will be the starting point. In future audits, include the change percentage to gauge whether your social media strategy is working or if you need to make some changes.
What do you think? Which metrics do you analyze while conducting a social media audit? Do you have any to add to this list? Please leave your comments below.

Attention Agency Owners, Brand Marketers, and Consultants

Introducing the Marketing Agency Show–our newest podcast designed to explore the struggles of agency marketers.
Join show host and agency owner, Brooke Sellas, as she interviews agency marketers and digs deep into their biggest challenges. Explore topics like navigating rough economic times, leveraging AI, service diversification, client acquisition, and much more.
Just pull up your favorite podcast app, search for Marketing Agency Show and start listening. Or click the button below for more information.

