Looking for people-centric marketing metrics to track and analyze your customers and prospects? Are you using the reports available inside of Facebook Analytics?
In this article, you'll discover five Facebook Analytics reports to help you make data-backed business decisions.
Why Your Business Should Use Facebook Analytics Reports
Every company has a growth model that includes a set of goals to make it flourish; a goal defines a way to grow. To visualize this, the goal of an online store is purchases. For an app, your goal might be related to daily/weekly/monthly active users. Or your business goal might be related to social media shares, posts, and reactions.
One of the most valuable features of analytics is setting up and measuring progress toward goals for business growth. To be sure everything is set up correctly to promote your business growth, keep these points in mind:
- Choose goals that bring you profit.
- Properly set up goals in your analytics system.
- Measure your baseline and check how it changes over time and what causes that change.
Even if you've installed Google Analytics or some other analytics system, you don't have a complete picture of your users' behavior. Facebook Analytics, which is based on people-centric tracking principles, can enrich your existing data with aggregated and anonymized data on Facebook users, revealing valuable insights that will help your business grow. Facebook Analytics turns all of your goals into standard or custom conversion events.
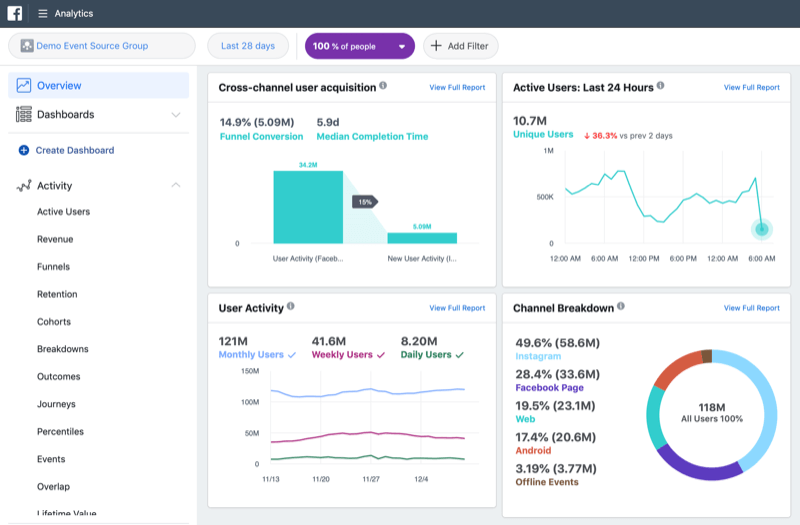
No matter what you want to analyze—a website, an app, your Facebook page, a combination of channels, or even offline events—make sure you set up your analytics system correctly. If you want to acquire relevant data and get accurate results, set up your Facebook tracking tag.
To track your customers' activity in Messenger bots, Facebook pages, or games for Facebook Gameroom, no special setup is required if these services are already connected to your Business Manager account or any of the Facebook Developer tools.
Pro Tip: To debug your tags, use Facebook Pixel Helper, which is a free Chrome plugin for troubleshooting and validating your pixel implementation. Also, you can use Google Tag Manager to manage all of your tags, including Facebook Analytics tags.
Customize Your Facebook Analytics
Personalizing Facebook Analytics for your business can make your marketing analytics even more valuable.
Note: This article assumes you've already completed these tasks:
- Installed the Facebook pixel. Check out this article for step-by-step instructions.
- Set up event source groups in Facebook Analytics, which allow you to track your audience across channels. Read this article for details.
- Copied your Facebook tracking code to all pages of your website and/or all screens of your app. Read this article for instructions.
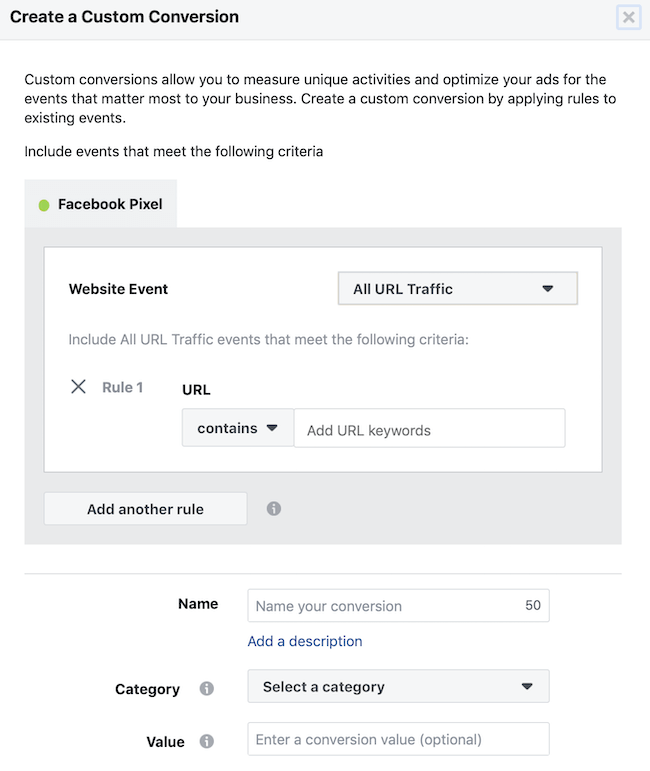
Custom conversions can help you track non-standard events that mark the growth of your business. While they're difficult to set up for those who don't know how analytics work on the inside, it's still possible to create them using these best practices.
To create a custom conversion, open Events Manager and select Custom Conversions in the left navigation. Then click Create Custom Conversion in the top-right corner of the page.
Get World-Class Marketing Training — All Year Long!
Are you facing doubt, uncertainty, or overwhelm? The Social Media Marketing Society can help.
Each month, you’ll receive training from trusted marketing experts, covering everything from AI to organic social marketing. When you join, you’ll also get immediate access to:
- A library of 100+ marketing trainings
- A community of like-minded marketers
- Monthly online community meetups
- Relevant news and trends updates

In the Create a Custom Conversion window, select your website or offline event, type in the URL of the page on which the custom event will fire, and enter a name for the conversion. For more details about this setup process, refer to this article.
Custom dashboards are the best way to see more detail in the most essential Facebook Analytics reports. To create a new dashboard, click Create Dashboard in the left navigation. In the pop-up window, type a name for your new dashboard.
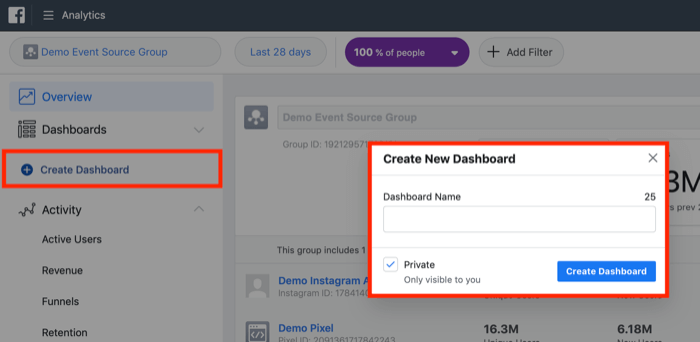
From here, you can add a chart or a funnel from the starting page of your dashboard. Or you can just pin the graphs you need and choose the type of graph to make your visualizations as useful as possible. This is especially handy when you need to make a dashboard immediately after launching experimental advertising and compare the results with outcomes from a past campaign.
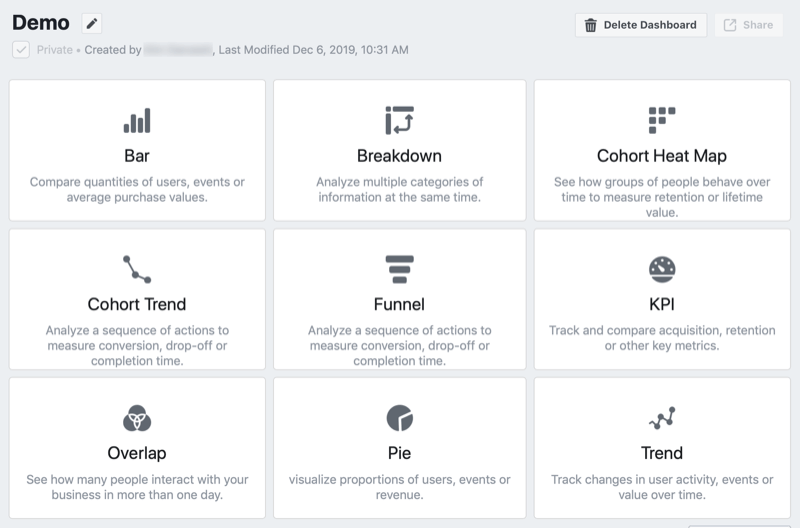
Now we'll look at five Facebook Analytics reports that help you make data-backed marketing and business decisions. Even in the simplest Facebook Analytics reports, you'll find all of the tools you need to dig into your data and analyze it from the inside.
#1: View Facebook Analytics Funnel Reports to Inform Budget and Ad Spend Decisions
All marketing efforts can be visualized as processes and funnels. They may be linear or nonlinear but all have a certain value. The best way to analyze a process is to break it down into steps or stages, put them into a logical order, and collect data about how customers walk through the funnel step by step to reach their goal.
Funnels help you experiment with the smoothness of your customer journey. They allow you to see if people feel comfortable reaching their goals or if they decide to leave even before they take the first step.
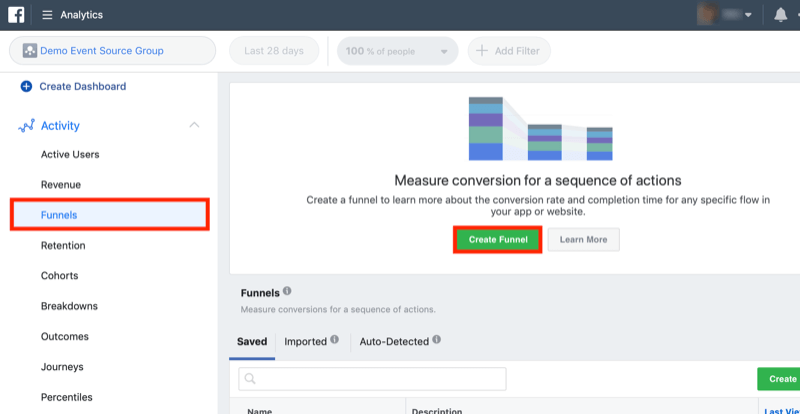
You can set up the funnels you're interested in (those related to your most important marketing processes) with the help of Facebook Analytics. To build a funnel of events, go to Activity > Funnels to open the Funnel report. Then click Create Funnel.
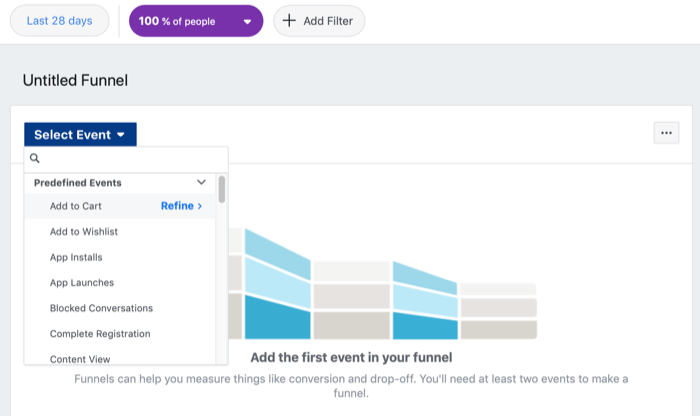
Now select an event to start building your funnel.
To illustrate, the structure of the funnel below is Search > Content View > Add to Cart > Purchases.
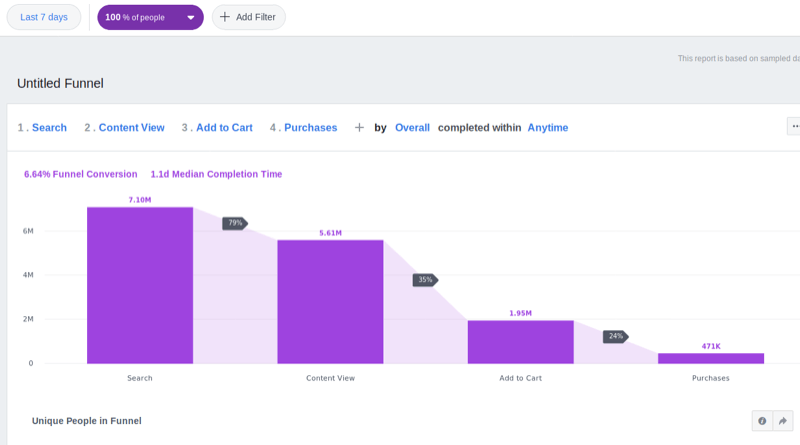
But that's not all. Thanks to the people-centric principles of Facebook Analytics, it has tons of aggregated anonymized demographic data you can use to enrich this report.
Why might this be important for marketers? Because sometimes marketers work based on a gut feeling or a conclusion without real proof, such as “we're a youth brand so the audience that buys and loves our product most is 17- to 24-year-olds.” They might even target their advertisements to that age category and invite young influencers to promote the product on Instagram.
But upon checking the funnel report, they might discover a lot of interesting things about their product. And based on an incorrect hypothesis, they're doing everything all wrong.
Thanks to the Facebook Analytics funnel report below, you can see that the age group with the highest conversion rate is 25- to 34-year-olds. And this is a data-driven conclusion.
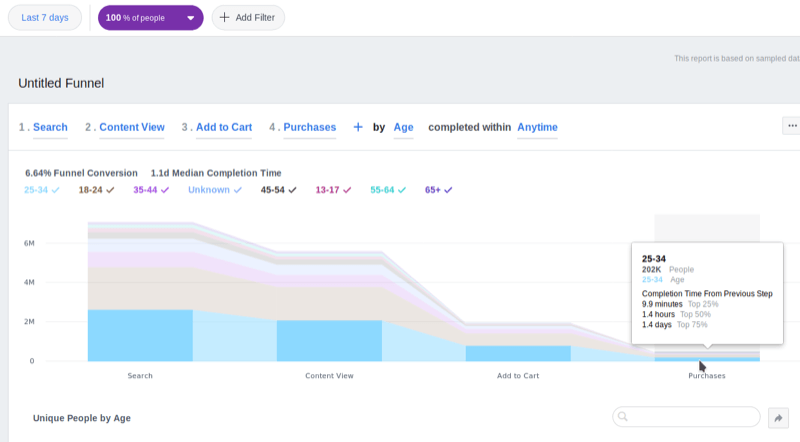
So it's time to reallocate your advertising budget. Stop advertising to those who don't buy and start concentrating efforts on the group that converts most. Cutting waste from your budget is a great way to grow. As you can see, Facebook Analytics can help you with this.
#2: Assess Facebook Analytics Overlap Reports to Inform Audience Targeting
What if your advertising is multichannel and you don't know how to change your targeting options to save money for each channel? Take a look at the overlap report in Facebook Analytics.
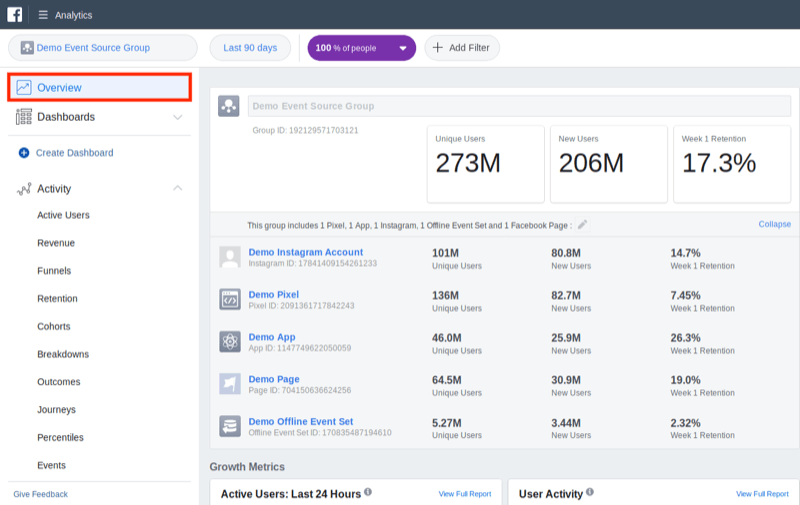
It's easy to see an overview of all of your data sources on the main screen of Facebook Analytics. It shows the names, traffic numbers, and retention rates for each source.

Discover Proven Marketing Strategies and Tips
Want to go even deeper with your marketing? Check out the Social Media Marketing Podcast! Publishing weekly since 2012, the Social Media Marketing Podcast helps you navigate the constantly changing marketing jungle, with expert interviews from marketing pros.
But don’t let the name fool you. This show is about a lot more than just social media marketing. With over 600 episodes and millions of downloads each year, this show has been a trusted source for marketers for well over a decade.
A more interesting feature for marketers and analysts is to visualize how the audiences of these channels overlap, with the possibility of adding filters and choosing the parameters to display.
For example, you might see that Android users convert much better than iOS users but the percentage of Android users is very low. Based on this, you should stop wasting money on advertising to iOS users because they don't convert, and start advertising to Android users, who convert well. This is one way to save your advertising budget and make your targeting even more data-driven.
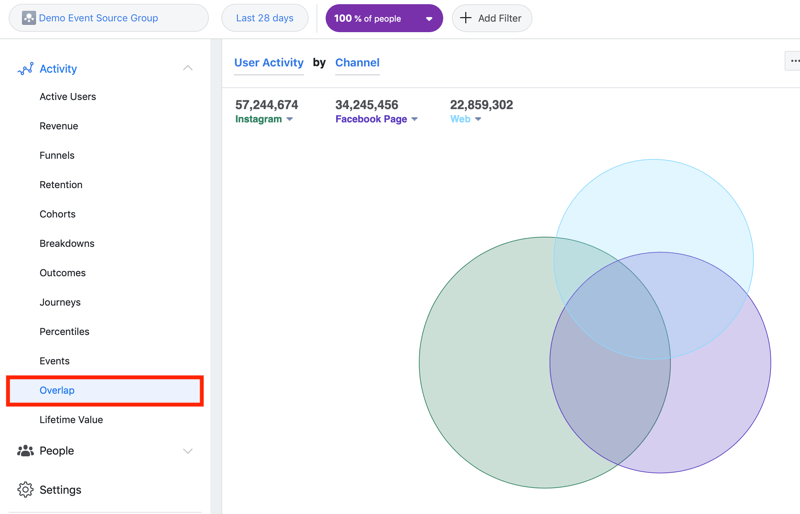
The Overlap report is one of the simplest and most powerful tools you can use to create advertising and audiences to work with. It lets you see users who take actions across channels. The image below shows how the Web, Instagram, and Facebook Page channels overlap.
Scroll down the page to see additional details.
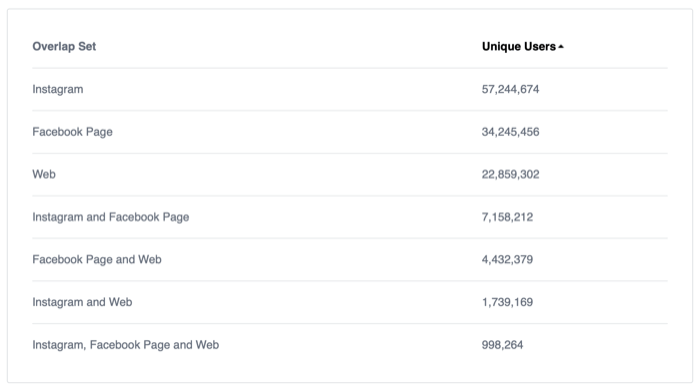
The Overlap report will help give you a true understanding of cross-device and cross-platform customer behavior so you can find insights for narrowing or broadening your targeting.
#3: Use Facebook Analytics Outcome Reports to Reveal Successful Content, Format, and Posts
Now let's look at how to choose the best content for advertising on Facebook.
Imagine a tool that told you how much profit each of your Facebook posts brings. That might sound crazy but marketers who work with Facebook Analytics can test a new feature called Outcomes. Go to Activity > Outcomes to access this data.
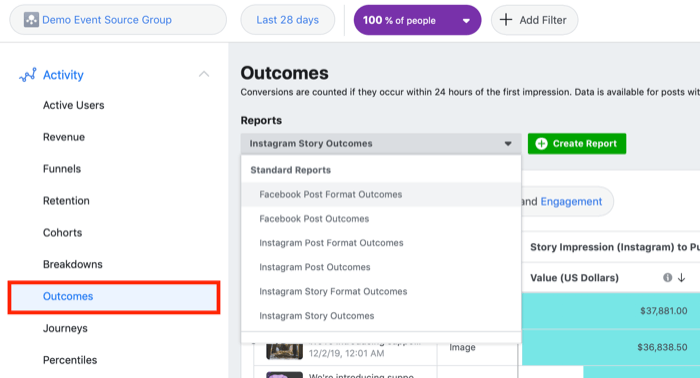
The Outcomes report (beta) shown below considers Facebook formats and conversion rates of key events like app downloads, purchases, and so on.
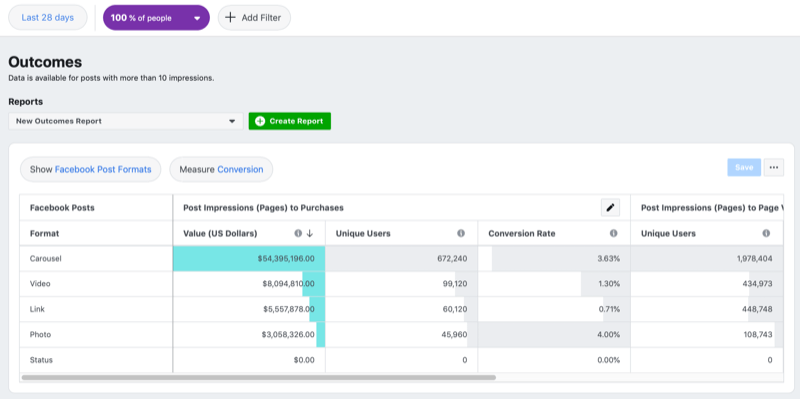
Outcomes is an essential tool for social media marketers who have a gut feeling about which pieces of content are good. Now there's no need to guess. Just open the report and look through it to find the best-performing format for your next advertising campaign based on your goal.
#4: View Facebook Analytics Demographic Reports to Reveal Possible Business Partnerships
The curiosity and creativity you can unleash with analytics tools will help you find insights where you never expected them and apply those insights in the most profitable way. Let's look at how to be creative with Facebook Analytics.
How much data do people share willingly via social media? Facebook users share an enormous amount of data every day. And all of these aggregated and anonymized treasures are available in a Demographics report in Facebook Analytics.
To access this report, choose People > Demographics in the left navigation.
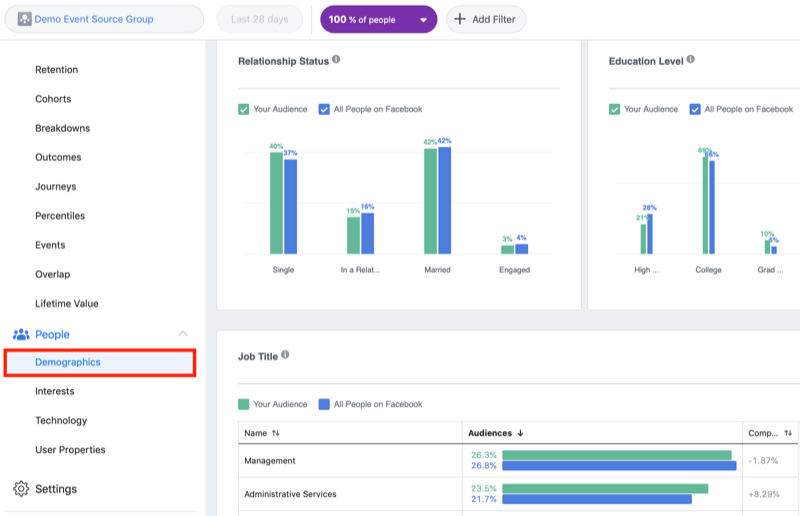
Aside from classic demographic data, marketers might use household information including:
- Education level
- Relationship status
- Job title
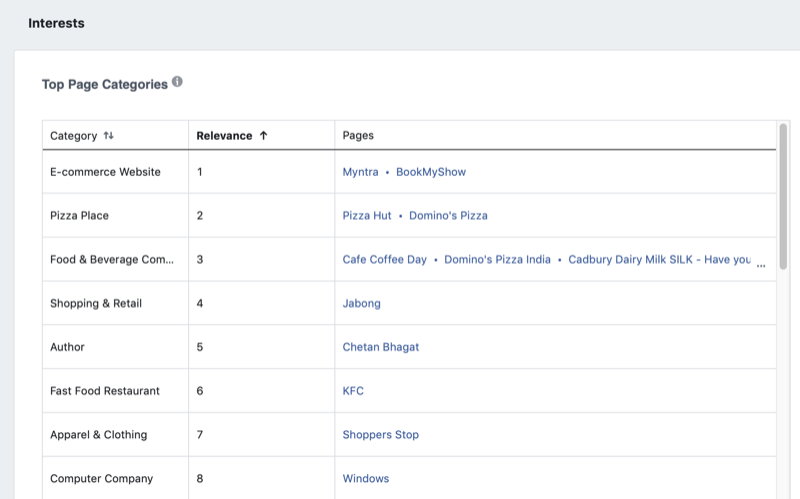
One of the most exciting Facebook Analytics reports is the Interests page (People > Interests), where marketers can find top page categories for their product's audience.
Links to the pages you see in the Interests report might help you find brands to work with for mutual promotion. Analyzing this report is a great way to build a list of potential partners that can help your business grow.
It's worth mentioning that all of this data is shared by people themselves and is public. The security of sensitive personal data is a high priority for Facebook; consequently, marketers can't use Facebook to find data on individuals. But if you want data on a group of people defined by certain characteristics, then Facebook reports will work perfectly for you.
#5: Examine Facebook Analytics User Retention Reports to Monitor Consumer Engagement by Cohort
Cohorts segment users into groups based on the period elapsed since they first came in contact with your product. And the more users there are in each cohort, the better. But losing users faster than you acquire them is a real problem for businesses. That's why you need to focus on keeping your retention rate high.
Facebook Analytics helps you monitor your retention rate by slicing and dicing your data, considering dozens of possible criteria, so you can see the positive or negative trends.
With the User Retention report, you can see the percentage of people who stay interested in your product or content over time. To access this report, go to Activity > Retention in the left navigation.
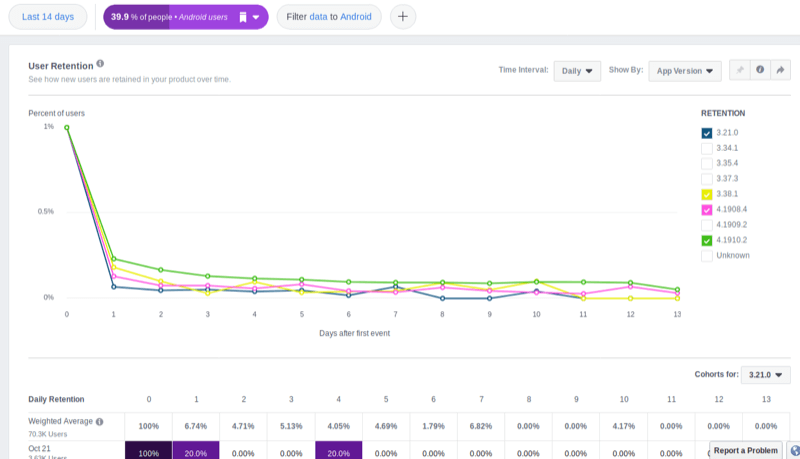
Suppose the latest version of your app (4.1910.2, green in the screenshot below) includes a new feature (push notifications) that might reactivate your app users and get them to open and use your app again. In the graph, you can see that this version definitely works better than the 3.21.0 version (dark blue), as more people stay interested in the app and open it again over time.
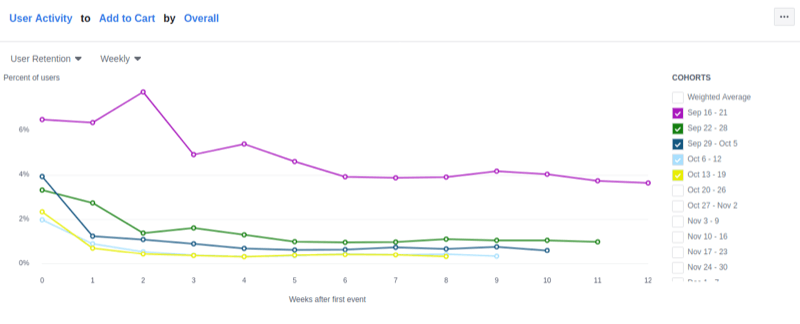
Another way to use this Facebook Analytics report is to reveal the percentage of people who continue to add to cart (as shown below) or purchase from you. The image below shows how the retention rate of those website customers who were active and added to cart changed week by week for the last 90 days.
You can decide what exact dimension of events you want to be mirrored in this report. Your cohorts might be built by different approaches, too—starting from basic breakdown by periods, ending with device/browser/OS options.
To get even more insights from this report, scroll down to the row-by-row cohort analysis table displayed on the same page as the Retention report.
- Each row in the cohort report represents a week (or hour or month) when new customers start using your product.
- Each column in the cohort report shows the percentage of users who return to your product at least once in a given time period.
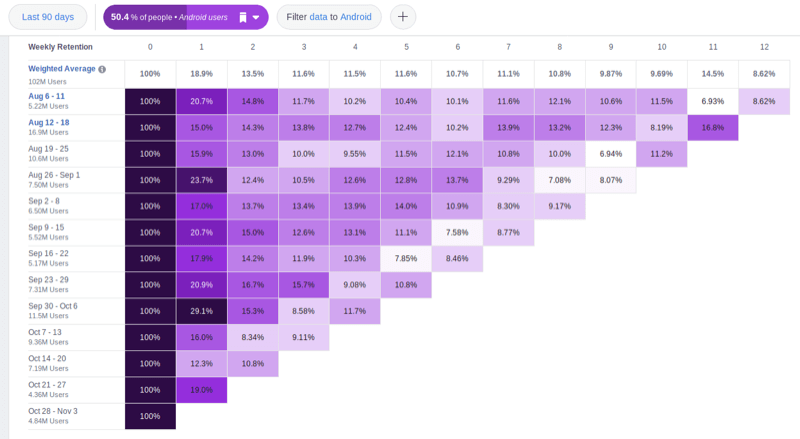
Your retention rate for the first week will always be 100% because it's the week everyone starts to use the product. But after that, everything starts to become more interesting. As time goes by, you'll see some cells become pale as the number of returning users decreases. This tendency shows your growth zones as well as room for improvement and opportunities for decreasing your churn rate. Dark cells point to a successful retention strategy.
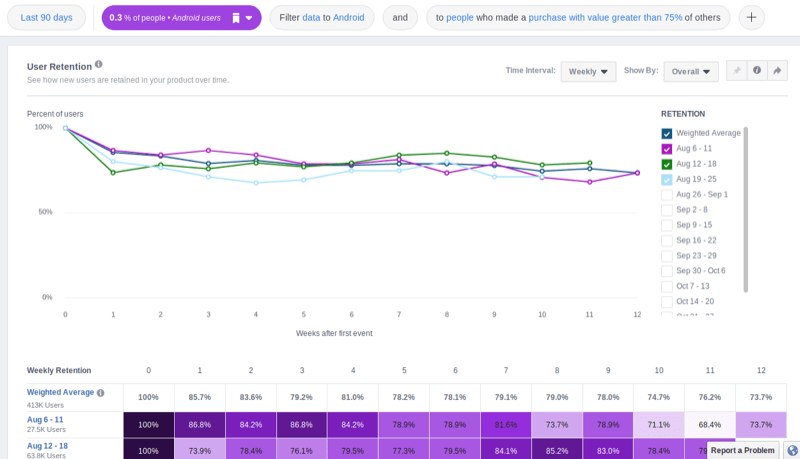
Cohort analysis in Facebook Analytics is the best way to see if your efforts help you keep your customers. But cohorts may sound too simple for those marketers who want to go beyond standard analysis and see the connections with data on purchases or other events. For this, Facebook Analytics includes the ability to filter by complex logical chains.
The Retention report below shows what happened with Android users who made an in-app purchase with a value greater than 75% of other in-app purchases.
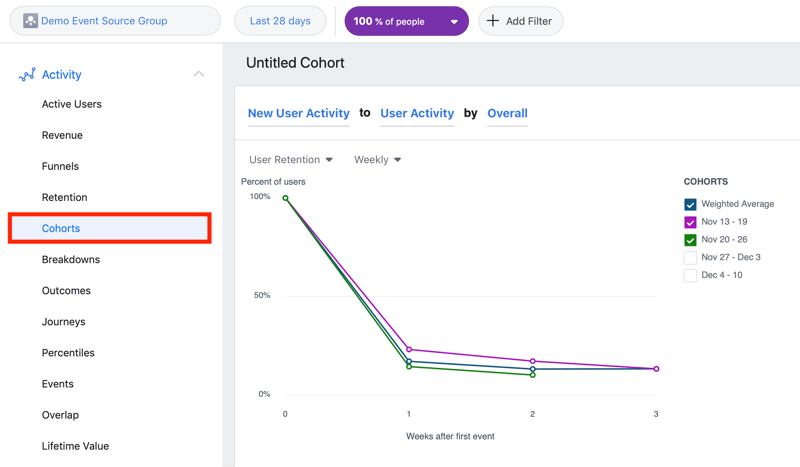
Note: In the Cohorts report (go to Activity > Cohorts), you can build any cohort for your marketing experiments (by selecting any dimensions and parameters you like) and use it at any time.
Conclusion
Facebook Analytics has no maximum number of tracked users, no limit to the number of tracked events, is free to use, and doesn't require you to use Facebook login. All of this makes analysts and marketers happy. As a third-wave analytics system, Facebook Analytics offers enough features to be a productivity-centric stand-alone tool. It gives marketers insights for decision-making, and analysts have access to data they could only dream about—and across all channels.
What do you think? Which of these Facebook Analytics reports do you use? What is their impact on your marketing decisions? Share your thoughts in the comments below.
More articles on Facebook Analytics:
- Discover how Facebook Analytics helps you analyze funnels and the lifetime value of a customer.
- Learn how to set up Facebook Analytics and Facebook attribution.
- Find out how to use Facebook and Google Analytics together to reveal how your Facebook customers engage with your funnel on their path to purchase.
Attention Agency Owners, Brand Marketers, and Consultants

Introducing the Marketing Agency Show–our newest podcast designed to explore the struggles of agency marketers.
Join show host and agency owner, Brooke Sellas, as she interviews agency marketers and digs deep into their biggest challenges. Explore topics like navigating rough economic times, leveraging AI, service diversification, client acquisition, and much more.
Just pull up your favorite podcast app, search for Marketing Agency Show and start listening. Or click the button below for more information.

