Wasting too much time trying to make sense of your Instagram campaigns? Looking for a faster and easier way to check Instagram ad performance?
In this article, you'll discover three built-in reports you can use to refine your campaigns.
#1: Instagram Ads ROI Report
Anytime you advertise on Instagram, return on investment (ROI) is a critical metric to track. Because it compares the value your ads have generated against the amount you've invested in running them, ROI helps you assess the success level of any campaign.
Why You Should Set Up This Instagram Ads Report
With an ROI report, you can determine whether your ads are generating revenue at the levels you expected so you can optimize underperforming ad sets. It can also help you identify top-performing ad sets so you can start scaling your efforts.
Measuring ROI is particularly important for campaigns using lower-funnel objectives. If you're using the newer Outcome-Driven Ad Experiences (ODAX) version of Ads Manager, measuring ROI is essential for lower-funnel objectives like sales. In the older version of Ads Manager, this report is ideal for conversions and catalog sales objectives.
What to Do Before Creating This Report
Does your campaign aim to drive results outside of Instagram such as purchases on your website? Take the time to configure your Meta pixel before setting up this report or even launching your ad campaign.
To check your pixel, go to your Business Settings and navigate to Data Sources. Confirm that your pixel is active and displaying a green dot.
To make sure your pixel is working correctly, click the Open in Events Manager button. Go to the Diagnostics tab to review and address active issues. If Events Manager reports that your pixel hasn't generated any trackable events recently, go to the Test Events tab to run a quick test.
How to Check Instagram Ads ROI Metrics
Once your Meta pixel is configured correctly and your Instagram ad campaign is up and running, you can start tracking ROI. To set up a custom report, open Ads Manager and click the Columns button. Scroll to the bottom of the drop-down menu and select Customize Columns.
Using the search bar, find and select the key metrics for the report. Start with Results and Cost per Result, which use your campaign objective to measure outcomes. Next, add Amount Spent to monitor the total sum of what the campaign has spent in a given timeframe.
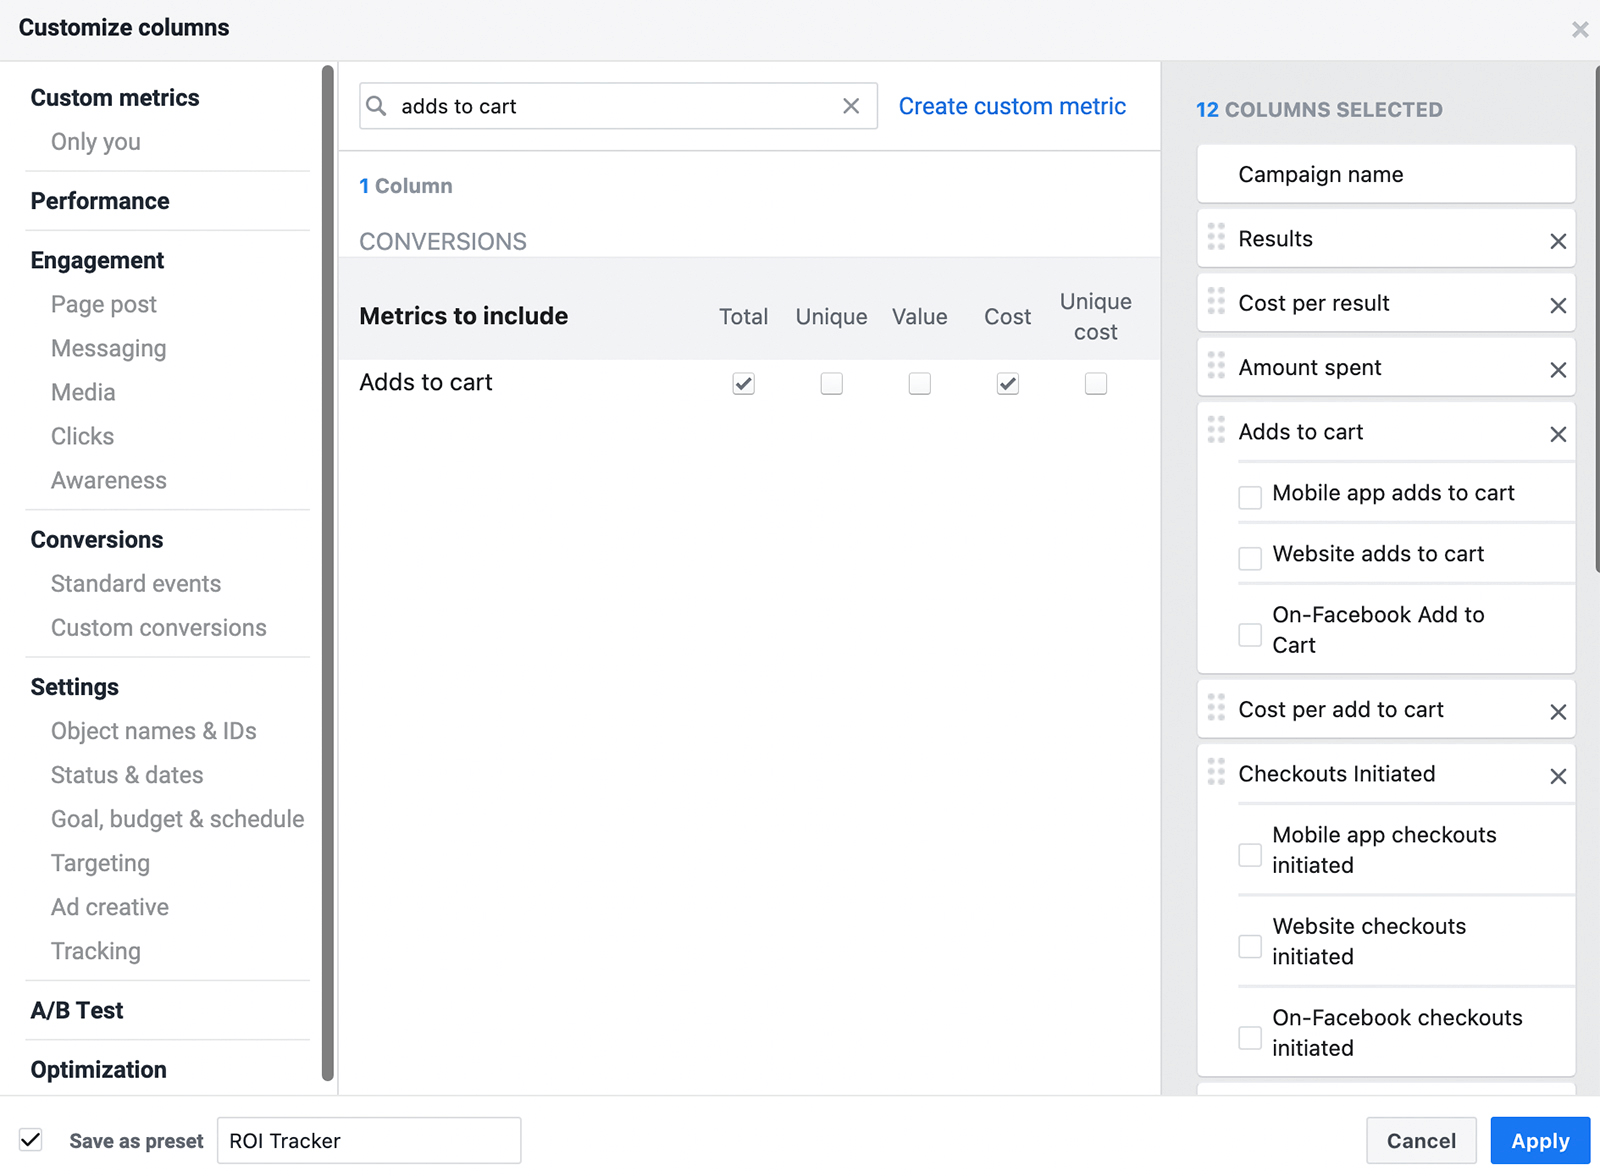
Then add metrics that cover the entire purchase process including Adds to Cart (Total and Cost), Checkouts Initiated (Total and Cost), Website Purchases, Purchases (Value and Cost), and Purchase ROAS (Total). Uncheck boxes that separate metrics by website or mobile app to simplify the report. Drag and drop the columns so they appear as follows:
- Results
- Cost per Result
- Amount Spent
- Adds to Cart
- Cost per Add to Cart
- Checkouts Initiated
- Cost per Checkout Initiated
- Purchases
- Cost per Purchase
- Purchases Conversion Value
- Purchase ROAS
Click the Save as Preset box in the lower-left corner of the window and give the report a descriptive name like ROI Tracker. Finally, click the blue Apply button to view your results. Now that you've saved the column preset, you can select it from the Columns drop-down anytime you open Ads Manager.
How to Use the Instagram Ads ROI Report
Choose an Instagram campaign to analyze and set the timeframe you want to review. Then scroll right to get a snapshot of the customer journey from Adds to Cart to Checkouts Initiated to Purchases. In most cases, you'll see far more Adds to Cart than Purchases, with Checkouts Initiated somewhere in the middle.
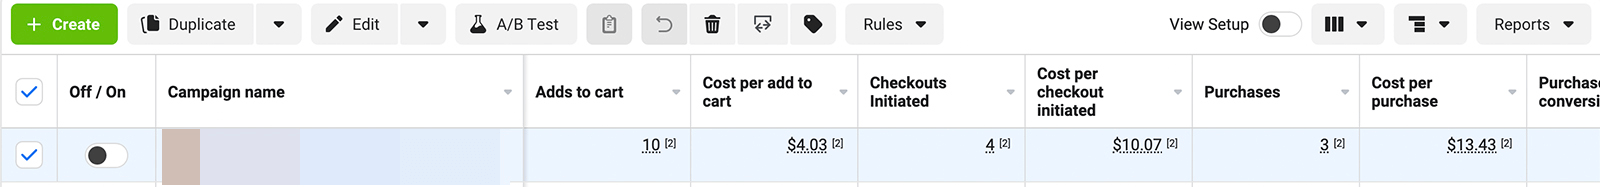
By comparing the three metrics, you can get a better sense of where prospects are ending or pausing their customer journey. Are Checkouts Initiated and Purchases pretty similar—and much lower than Adds to Cart like in the example above? Product pricing, shipping costs, or even shipping dates may be preventing people from checking out and completing a purchase.
Which AI Moves Actually Matter?
That's what every marketer is wrestling with now. New AI strategies, new tools, new takes every week — but no clarity. Most marketers and business owners are trying to figure out AI alone.The AI Business Society is your trusted guide. Get expert-led training you can put to work immediately. Plus a community of marketers sharing what's actually working.
I'M READY FOR REAL AI RESULTSNext, scroll to the rightmost column to see the Purchase ROAS (Return on Ad Spend) for your campaign. Ultimately, the most important metric in this report, ROAS tells you how the campaign is impacting your bottom line.
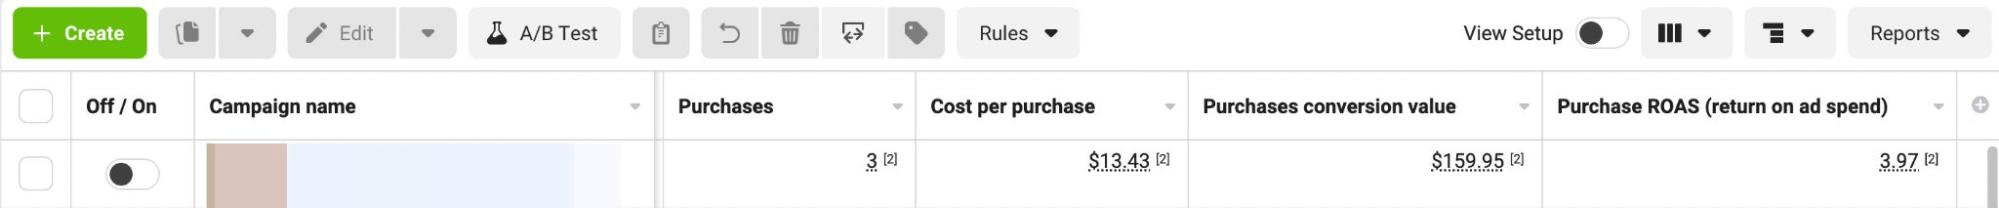
What's a good ROAS for an Instagram ad campaign? Any number above 1 indicates that the campaign has a positive result; it's generating more value than you've invested. But ROAS doesn't factor in the other costs of doing business such as materials, shipping, and marketing. That's why most Instagram marketers aim for a ROAS of 4 or higher.
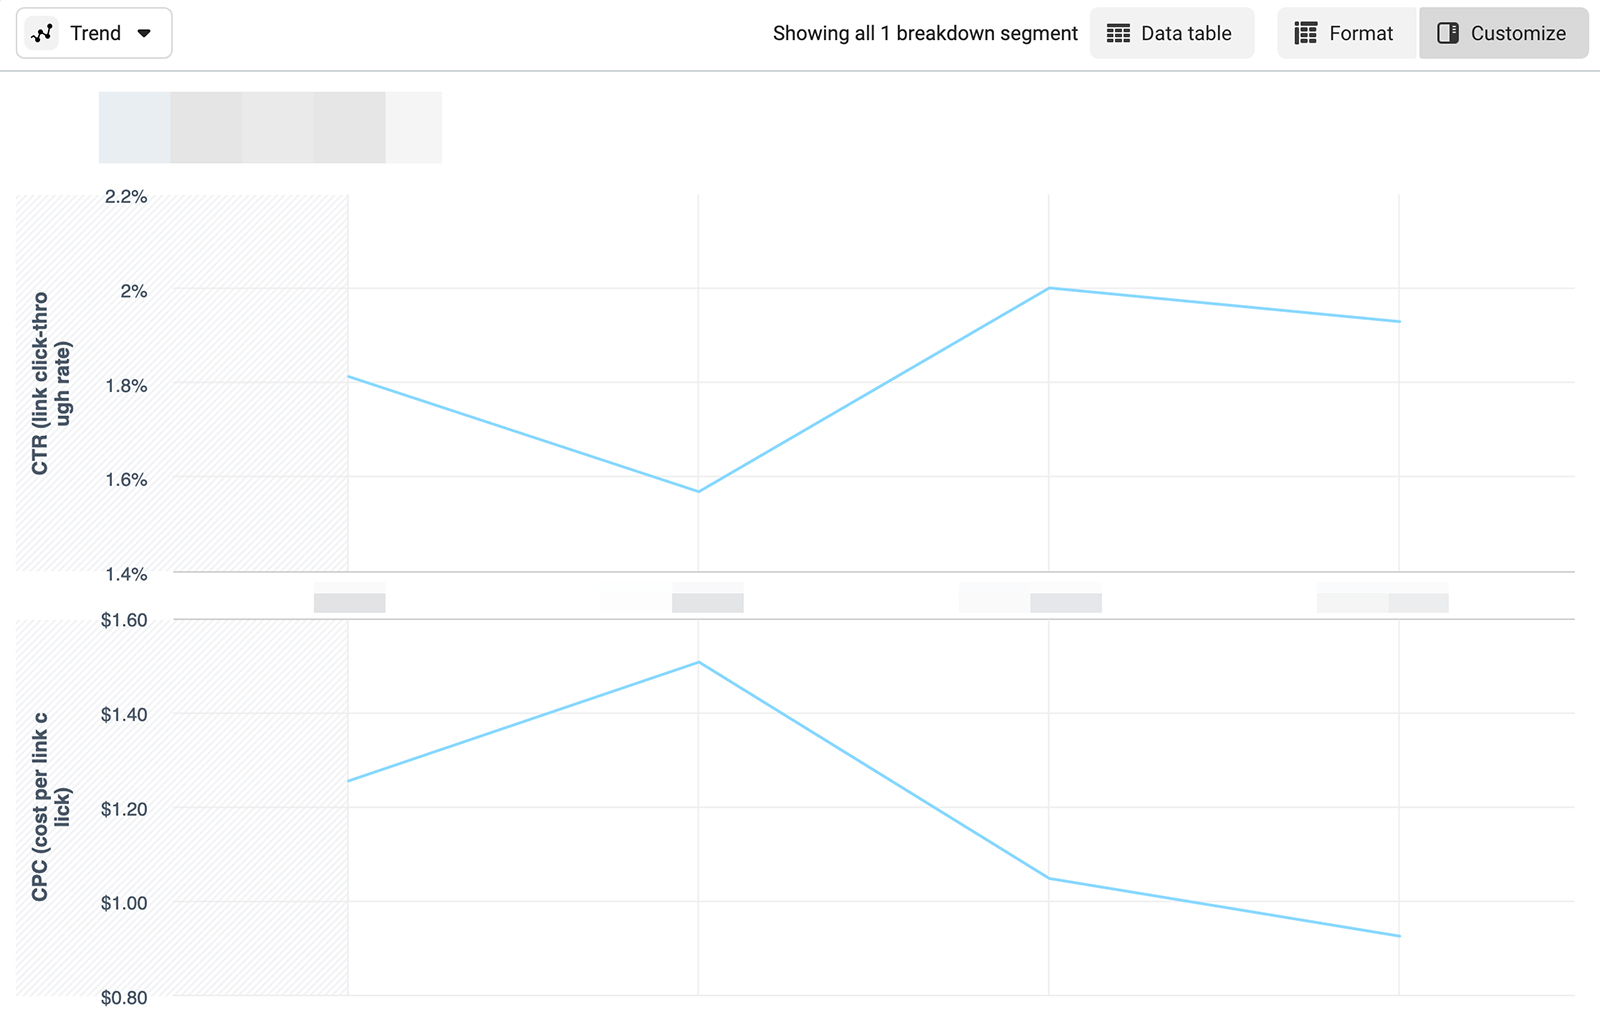
To benchmark your ROAS and find out what's good for your company, click the Reports button in Ads Manager and select Export Table Data. Then choose Export to Ads Reporting and select Trend Report to visualize your data. Now you can see how your ROAS has changed over time and determine whether it's trending up or down.
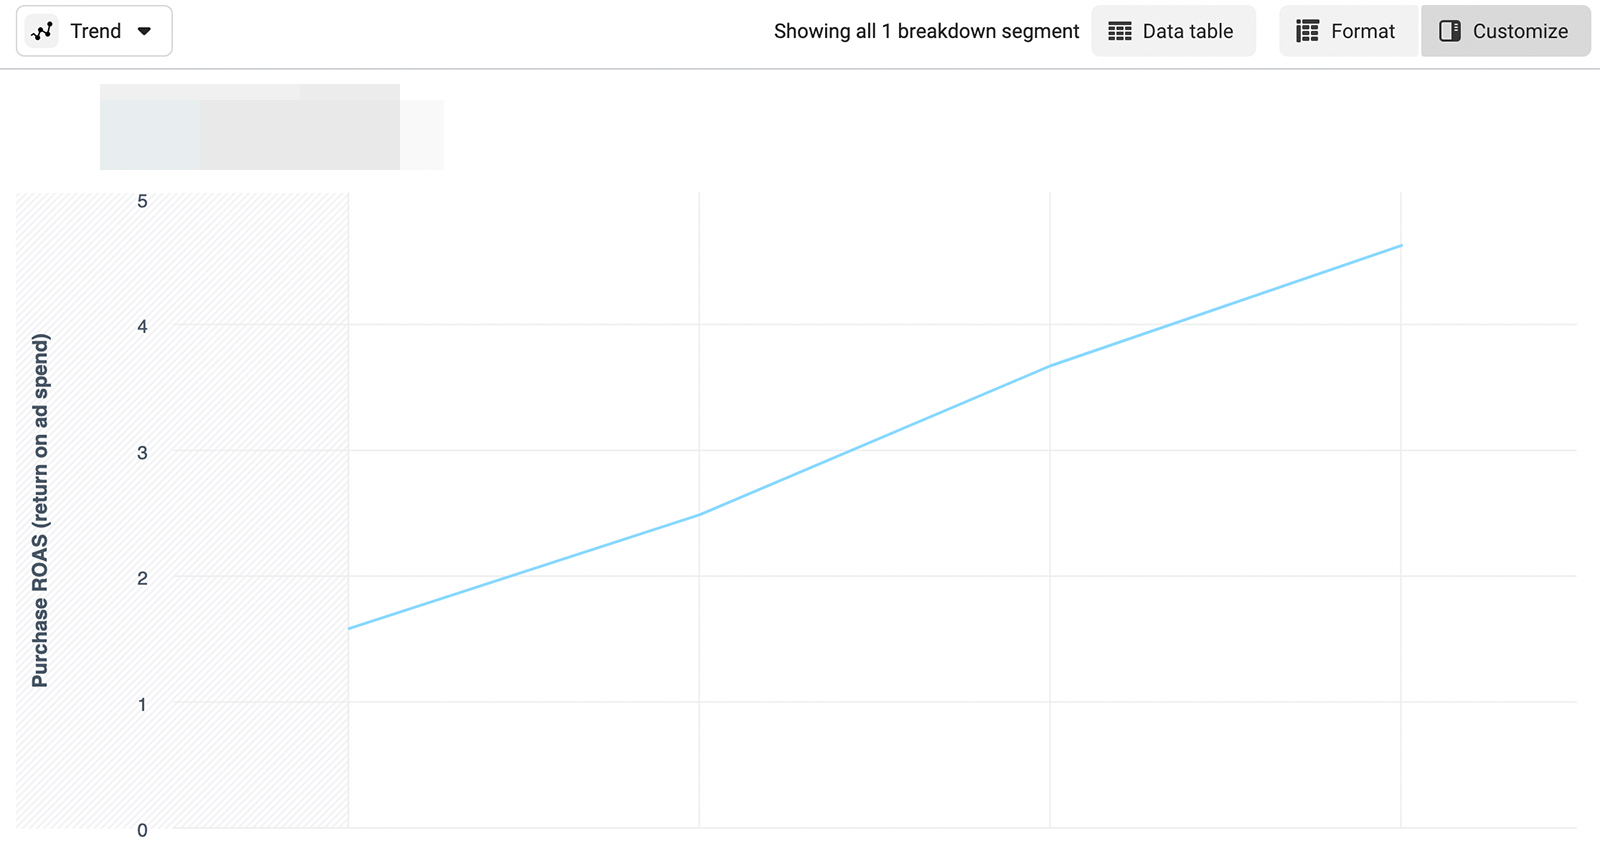
Is the ROAS for your Instagram campaign higher than what you'd aimed for or is it trending upward? Your campaign is on the right track.
If the opposite is true and if your ad sets have left the learning phase, it's a good idea to re-optimize the campaign. For example, retargeting people who have already visited your site, interacted with your ad, or even made a prior purchase may increase your ROAS and improve your return.
#2: Instagram Ads Lead Generation Report
While an ROI report is ideal for keeping an eye on your bottom line, a leads report is great for focusing on the middle of your funnel. If you use Instagram ads for lead generation, you'll want to add this custom report to your toolkit.
Why You Should Set Up This Instagram Ads Report
With a lead generation report, you can see how people interact with your ads or site and whether they complete micro-conversions before becoming customers. If you're using the newer version of Ads Manager with ODAX, this report fits well with leads and engagement objectives. In the older version of Ads Manager, this report works well for the lead generation and conversions objectives.
What to Do Before Creating This Report
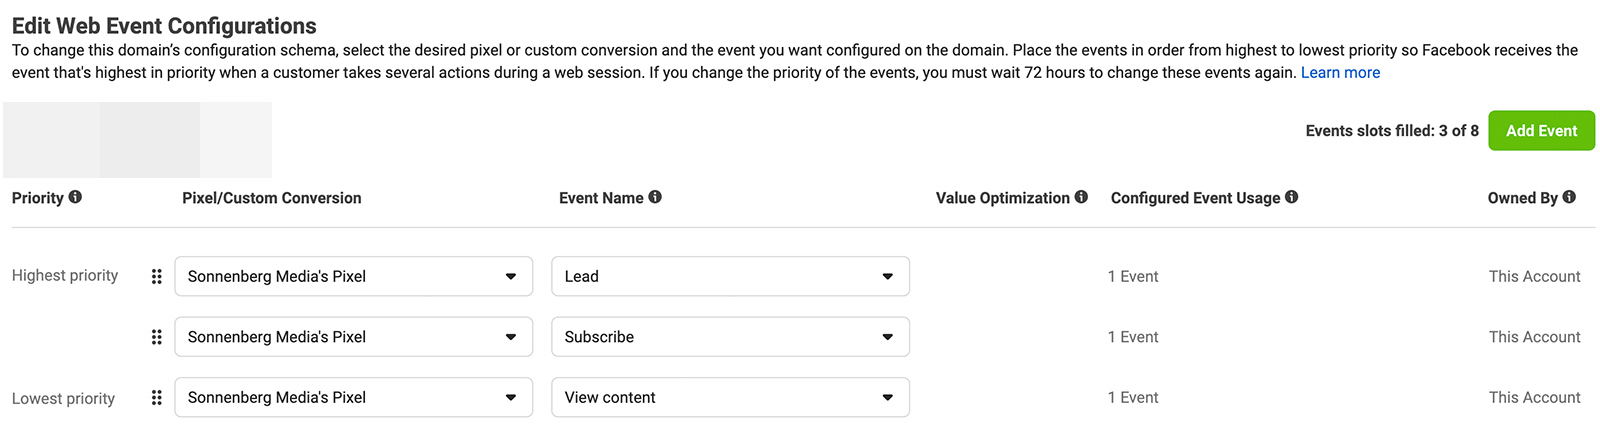
Before setting up this report or launching your Instagram campaign, check that you've configured conversion events correctly. Open Events Manager, select your pixel, and click the blue Configure Web Events button.
If you haven't updated the event priority recently, drag and drop your eight conversions, placing the most important one at the top. If you want to target lead generation, for example, you might add Lead, Complete Registration, or Subscribe to the list.
How to Check Instagram Ads Lead Generation Metrics
Now that you've got the basics set up, you can use a workflow similar to the one above to create a custom lead generation report. Open Ads Manager, click the Columns drop-down menu, and select Customize Columns at the very bottom of the list.
3 Days of World-Class Training—Zero Travel!

Couldn't make it to Social Media Marketing World and AI Business World this year? Get all of the great content at a fraction of the price with a Virtual ticket.
That’s full access to recordings of every keynote, workshop, and session—the ones people travel thousands of miles to see. Don't wait. Get your Virtual ticket and enjoy actionable content that you can watch anytime, anywhere.
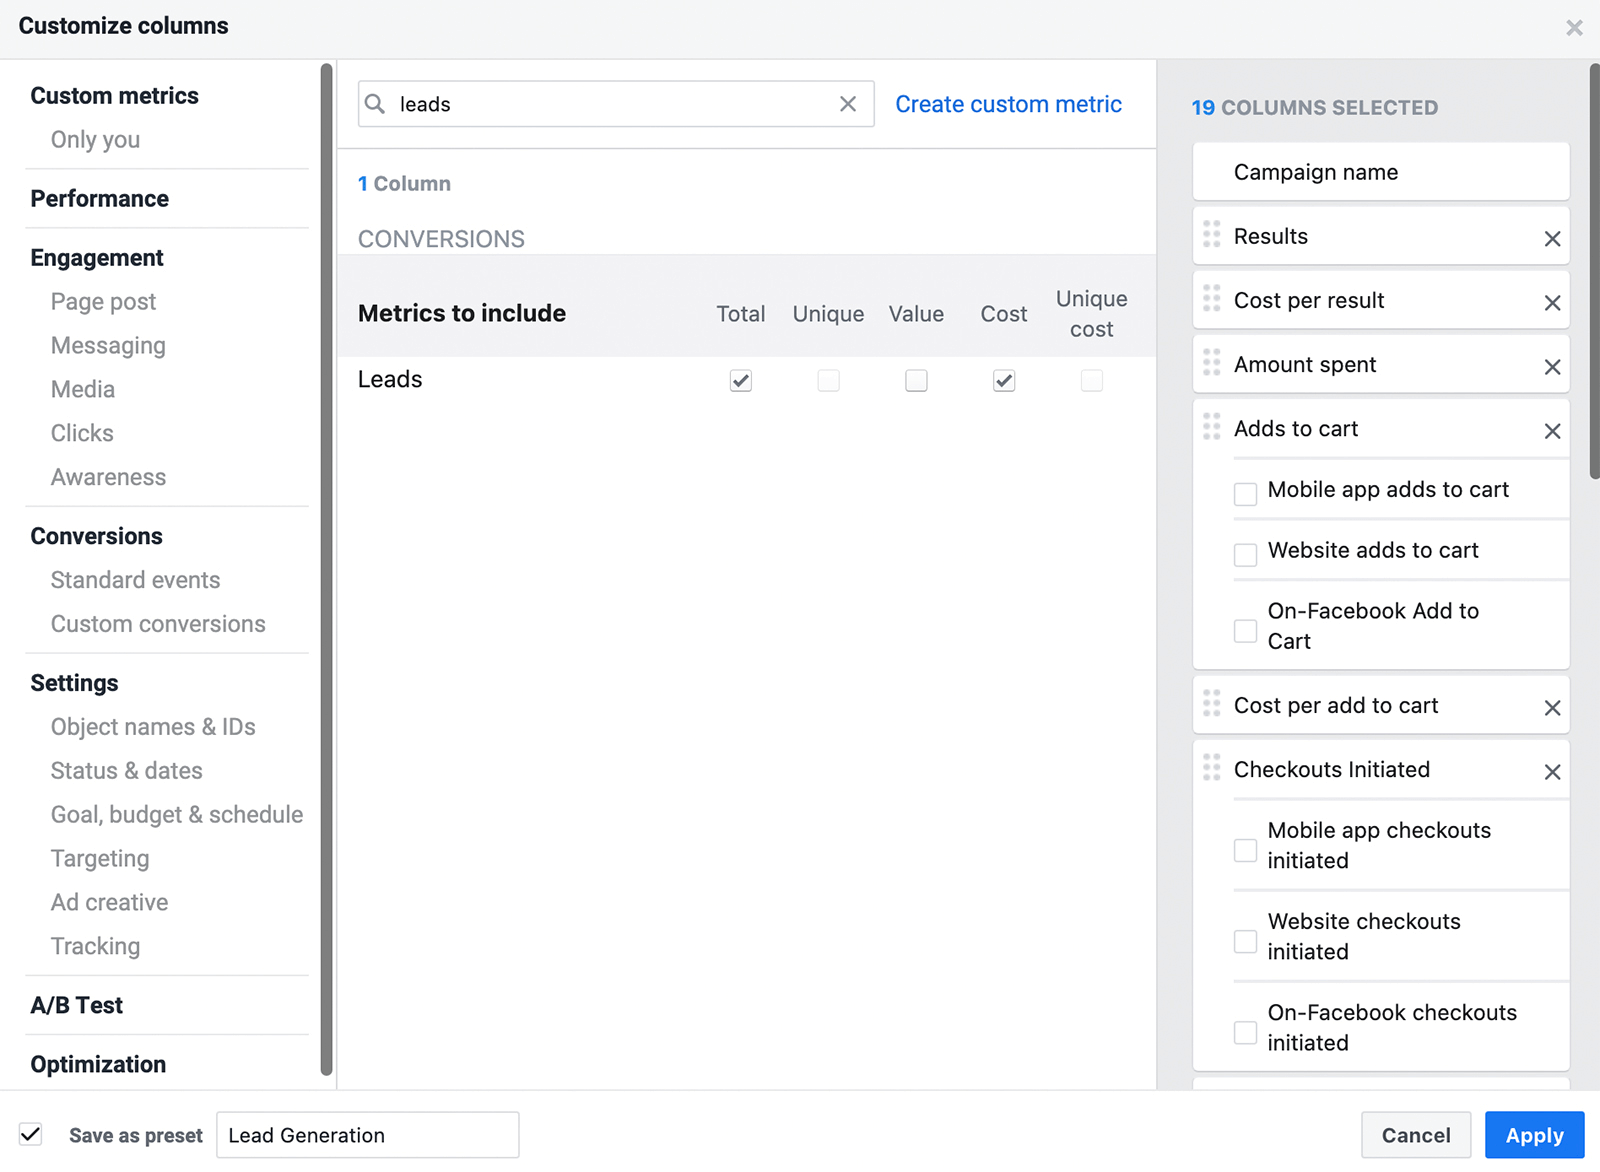
If you start with the ROI Tracker report settings above, it's easy to add metrics that focus on website clicks and conversions. Use the search bar to find and add Link Clicks, Cost Per Click (CPC), and Click-Through Rate (CTR). Then add the conversion metric (Total and Cost) that you've targeted in the campaign; for example, Leads or Registrations Completed.
Drag and drop the columns so click and conversion metrics appear above purchase metrics. Here's a full list of what to include:
- Results
- Cost per Result
- Amount Spent
- Link Clicks
- CPC
- CTR
- Leads or Registrations Completed
- Cost per Lead or Registration Completed
- Adds to Cart
- Cost per Add to Cart
- Checkouts Initiated
- Cost per Checkout Initiated
- Purchases
- Cost per Purchase
- Purchases Conversion Value
- Purchase ROAS
Check the Save as Preset box and name the report Lead Gen or something similar. Now you can use this report to analyze leads campaigns with one click.
How to Use the Instagram Ads Lead Generation Report
With this report, you can quickly see whether people are successfully progressing through your sales funnel. First, take a look at link clicks and CTR to see if people are responding positively to your ad and clicking through to your site.
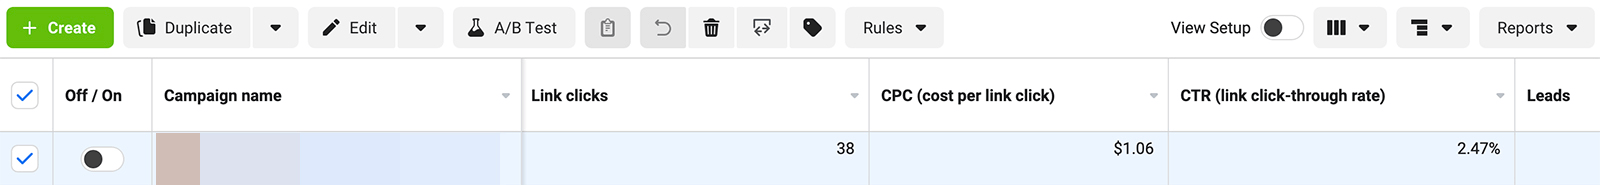
What CTR should you aim for? Across all industries, the average CTR for Instagram ads is 0.22%. You can benchmark your brand's CTR by using figures from other successful campaigns you've run for your company.
Using the workflow from the ROI report, you can also click to visualize your lead generation analytics over time. Click to export table data to ads reporting, and then switch the view to Trend. Now you can see how link clicks, CTR, and/or CPC are trending.
To continue analyzing your lead progress, go back to the column view and scroll through the steps. Are people clicking through to your website in droves but then failing to convert? Retargeting engaged prospects with another version of your ad may help you increase your lead conversion rate.
Alternatively, consider rethinking your audience targeting. Due to Apple's third-party app tracking restrictions, using website analytics to build audiences is getting increasingly difficult. Instead, create custom audiences based on in-app metrics like people who've interacted with your ads.
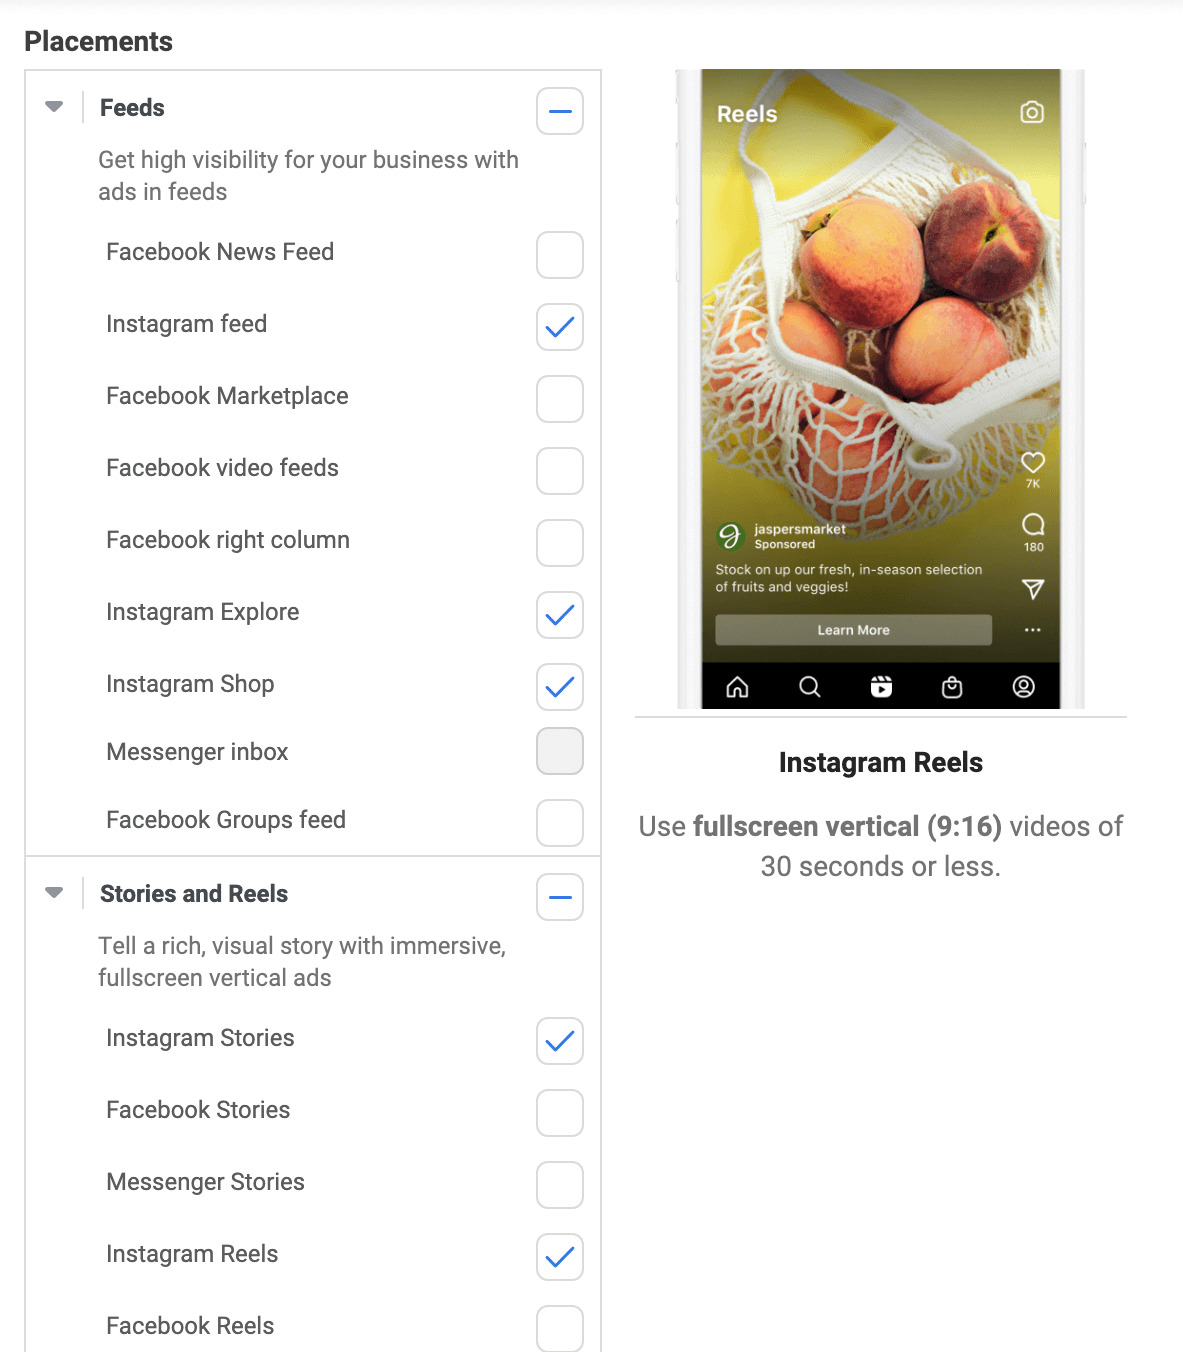
To get better results from your Instagram lead generation ads, you might also leverage more ad placements, especially if you're only using Instagram Explore and feed ads. For example, Stories and Reels tend to generate more clicks, since they're less saturated than other placements.
#3: Instagram Ads Engagement Report
When you're focused on maximizing the return from your Instagram campaigns, it's easy to assume that you only need the two reports above. Yet analyzing engagement can also help you measure the health of your ads, which is essential to strong campaign performance.
Why You Should Set Up This Instagram Ads Report
Even if engagement isn't the main goal of your Instagram campaign, ads that leave a positive impression tend to generate a lot of interactions. With an engagement report, you can see how people are interacting with your paid content and identify your most successful ads.
This custom report offers helpful insights no matter what Instagram campaign objective you choose. Once you set it up, you can use it to analyze performance at the ad level, and then decide how to optimize your campaigns.
How to Check Instagram Ads Engagement
To set up this custom report, open Ads Manager and click the Columns button. Select Customize Columns and then search for the metrics you want to add.
Start with the first several metrics from the lead generation report including Results, Cost per Result, Amount Spent, Link Clicks, CPC, and CTR.
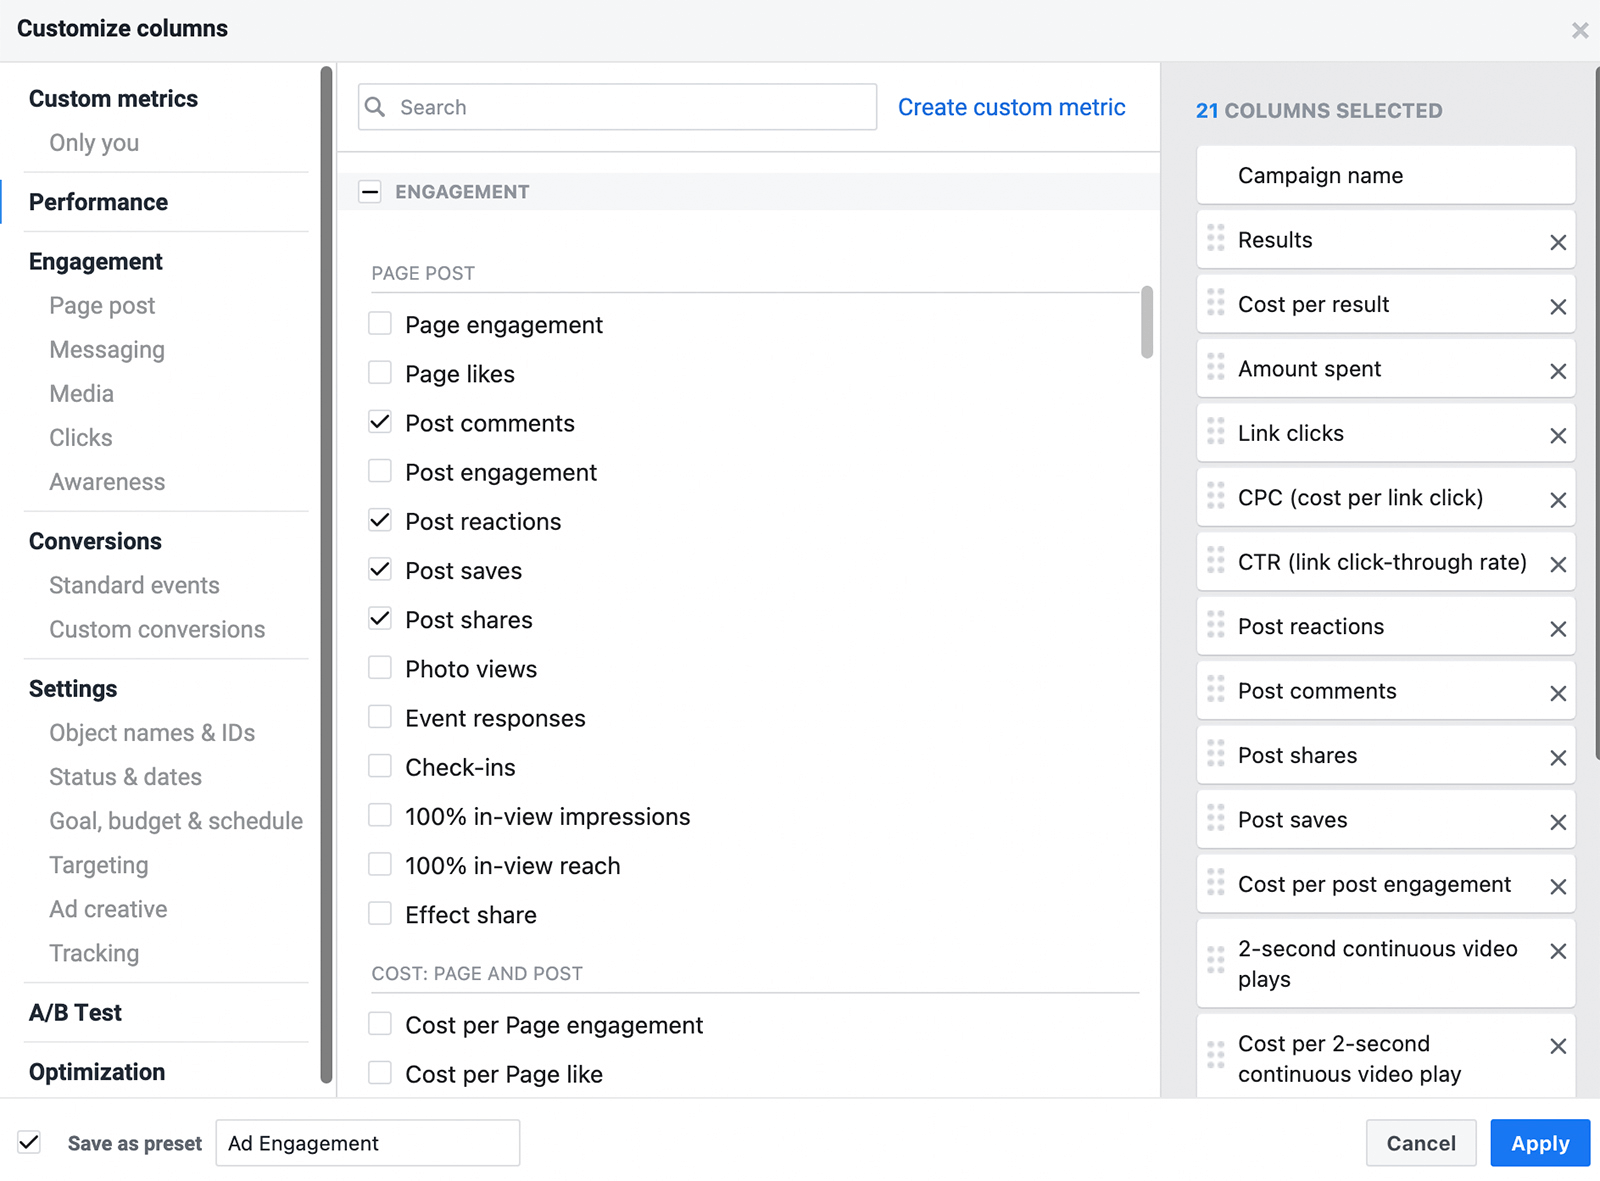
Then click Engagement in the left-hand menu and add post-level engagement metrics so you can assess the value of each interaction. In addition to the metrics above, add these to your report:
- Post Reactions
- Post Comments
- Post Shares
- Cost per Post Engagement
- 2-Second Continuous Video Plays
- Cost per 2-Second Continuous Video Play
- ThruPlays
- Cost per ThruPlay
- Video Plays at 25%
- Video Plays at 50%
- Video Plays at 75%
- Video Plays at 95%
- Video Plays at 100%
Give your report a name like Ad Engagement. Then save it as a preset so you can reuse it efficiently.
How to Use the Instagram Ads Engagement Report
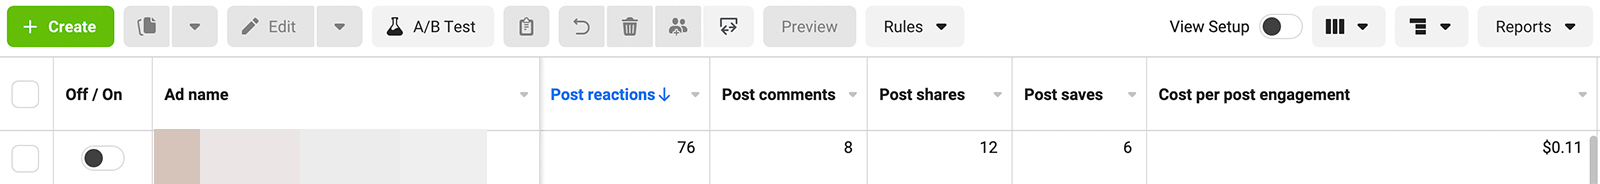
Go to the Ads tab in Ads Manager so you can see engagement at a more granular level. Are some ads getting tons of shares or dozens of positive comments?
Both of these findings indicate that your ads are resonating with your audience. If you can identify what people love about the ad—like the creative, messaging, or offer—then you can use similar elements in other ads or campaigns.
Are some ads getting virtually no engagement? Before you consider switching them off and allocating the rest of the ad set budget to other ads, look at lower-funnel metrics first.
Scroll left to take a closer look at CTR and CPC. Then use the ROI or lead generation report to take a closer look at leads or purchases. If some are generating virtually no activity at any stage of the customer journey, then it's a good idea to switch them off or test new iterations.
It's also helpful to take a closer look at the video views metrics in this custom report. Because you can create custom audiences based on this metric, ads that generate a lot of video views can create additional value for campaigns further down the funnel.
Keep in mind you can use the Breakdowns button in Ads Manager to separate results per placement. Although Ads Manager doesn't show breakdowns for web-based metrics like leads and conversions, it can display breakdowns for in-app metrics like engagement. That way, you can identify which placements are the best fit for your ads and continue to improve performance.
Pro Tip: Want to share your findings with colleagues? Select any of the custom reports you created and choose the timeframe and campaign parameters. Then click Export Table Data and save it as a simple spreadsheet or a pivot table.
Alternatively, choose Share Link from the Reports menu and provide the URL to your colleagues. Note that only people with access to the Ads Manager account can use the link to log in and view results.
Conclusion
Using these three custom reports, you can analyze Instagram ad performance with a few clicks. Save these reports or customize them further so you can check your ads efficiently. Then optimize them to improve performance or scale to drive even better results.
Get More Advice on Instagram Ads
- Write Instagram ad copy that converts.
- Test your way to better Instagram ads.
- Optimize your Instagram ads creative.
Stay Up-to-Date: Get New Marketing Articles Delivered to You!
Don't miss out on upcoming social media marketing insights and strategies! Sign up to receive notifications when we publish new articles on Social Media Examiner. Our expertly crafted content will help you stay ahead of the curve and drive results for your business. Click the link below to sign up now and receive our annual report!

Curious About How to Use AI?
Our newest show, AI Explored, might be just what you're looking for. It's for marketers, creators, and entrepreneurs who want to understand how to use AI in their business.
It's hosted by Michael Stelzner and explores this exciting new frontier in easy-to-understand terms.
Pull up your favorite podcast app and search for AI Explored. Or click the button below for more information.
