Want better results from your Instagram ads? Wondering how to simplify management and reporting results?
In this article, you'll discover six tricks for getting more out of your Instagram advertising so you can get better results in less time and with fewer resources.
#1: Customize Facebook Ads Manager Columns to Quickly Find What Matters
With more than a dozen pre-made tables and 100+ different advertising metrics, Facebook Ads Manager certainly provides all of the insights you need to run successful Instagram campaigns. But knowing what to look for or how to find the right data isn't always a quick or easy process.
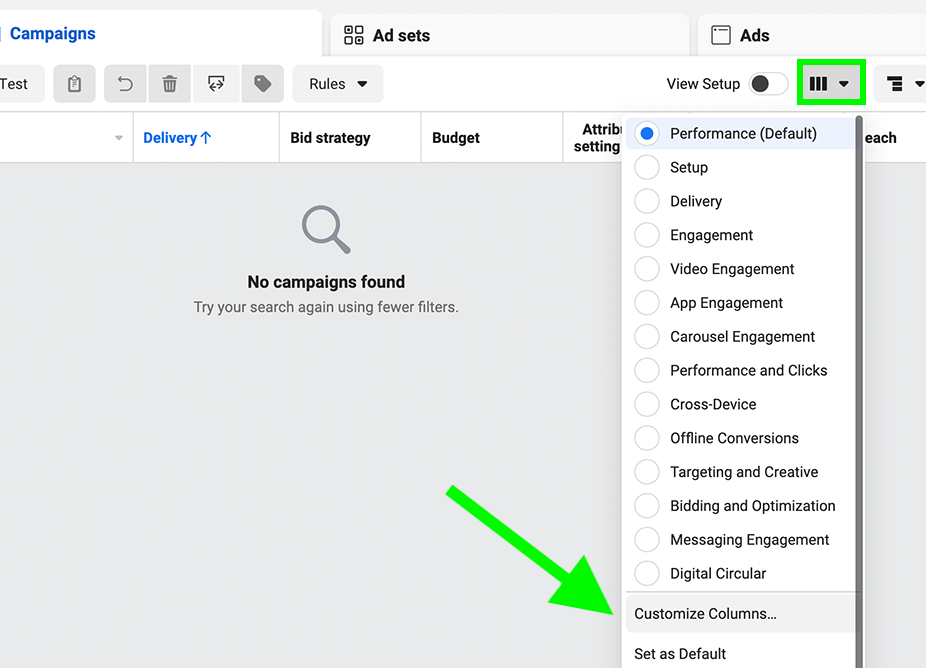
To save time on Instagram ad analysis, creating custom tables is critical. You can get started by opening your Ads Manager account and clicking the Columns button. When the drop-down menu opens, scroll to the bottom and select Customize Columns.
Display Essential Metrics
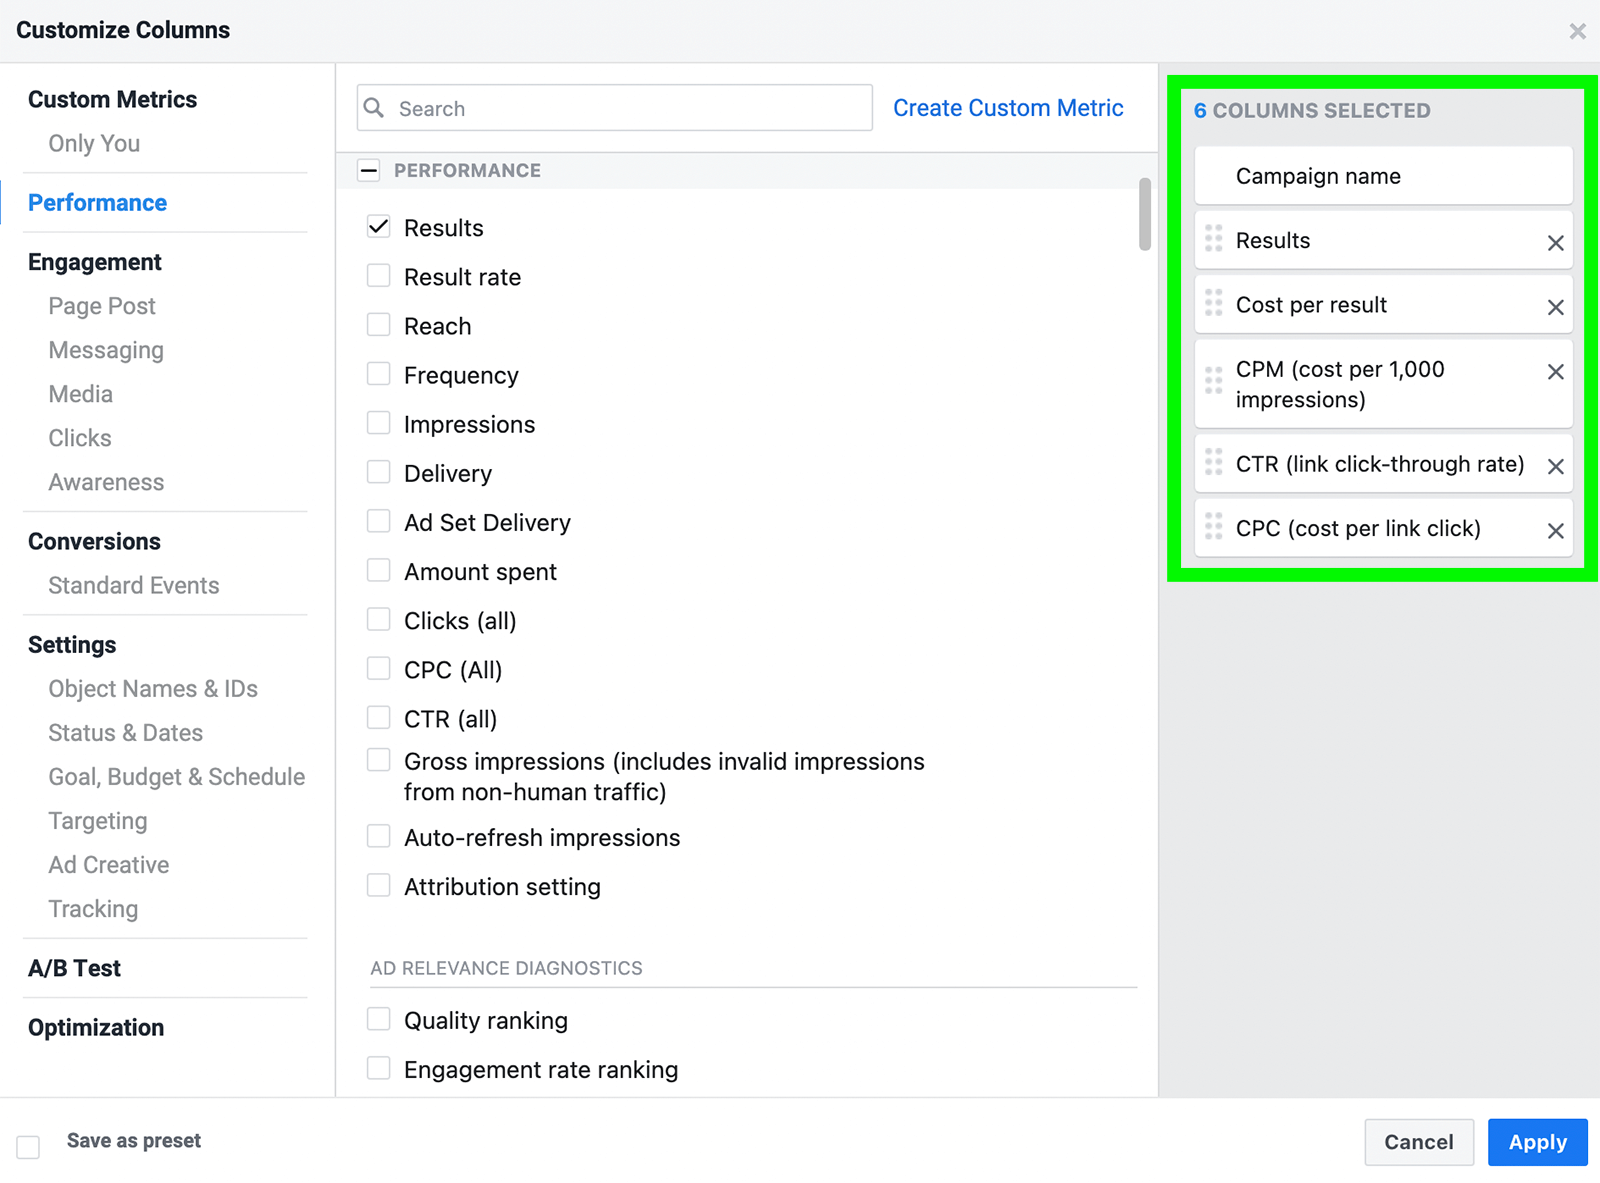
Next, choose which metrics to display and then drag and drop to organize them in the table. Add these essential metrics first:
- Results: A tally of the results your campaign has generated based on the objective or optimization event you chose—such as people reached or website purchases
- Cost Per Result: The average cost for every objective-based result your Instagram campaign has achieved
- Cost Per 1,000 Impressions (CPM): The average cost of delivering your ad 1,000 times
- Click-Through Rate (CTR): A percentage that reflects how often your target audience clicks or taps through your ad versus how often they see it in their news feed
- Cost Per Click (CPC): The average cost for every tap to your linked landing page
Include Instagram Campaign-Specific Metrics
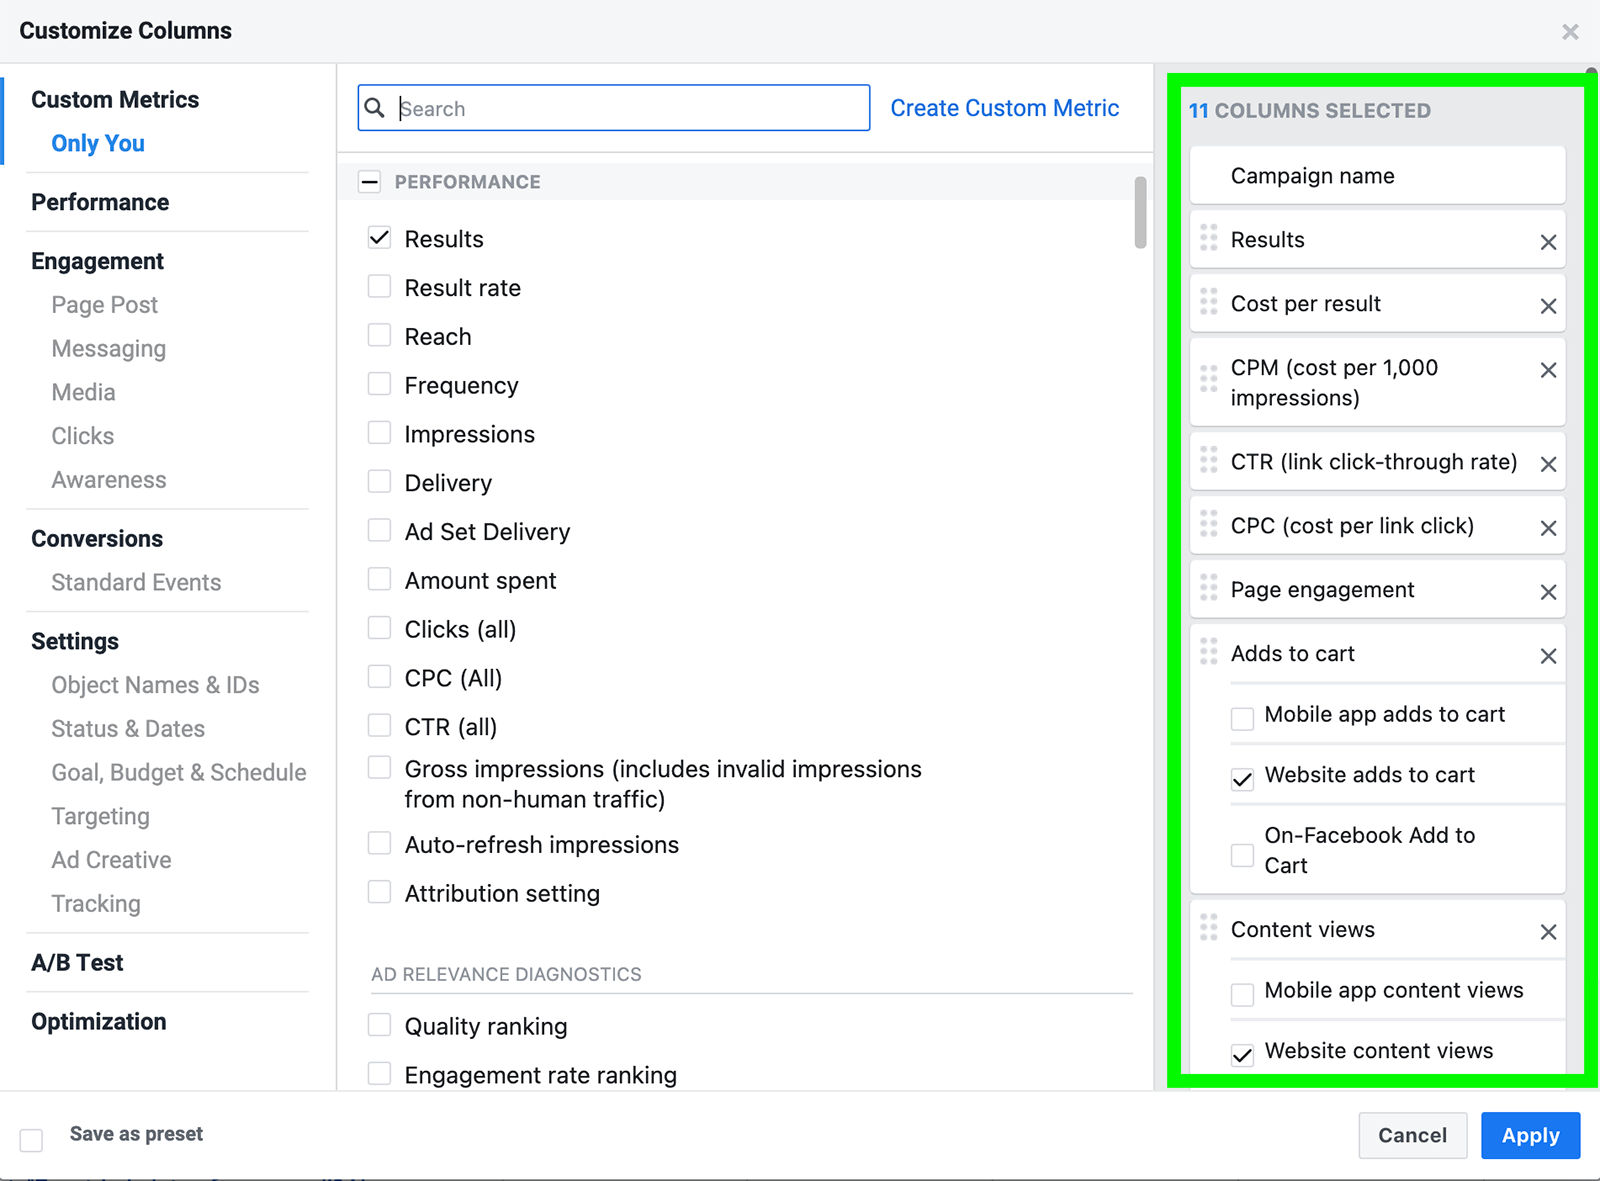
Now add metrics that offer more insight into your campaign goals. To streamline campaign management, create separate custom tables for each of the Instagram objectives you target most often so you have an efficient way to evaluate any campaign. Some campaign-specific metrics to add include:
- Post Engagement: A tally of all of the reactions, comments, and shares your campaign has received to assess interest levels and gauge sentiment
- Pre-Conversion Actions: The actions that lead up to the final result such as content views or adds to cart
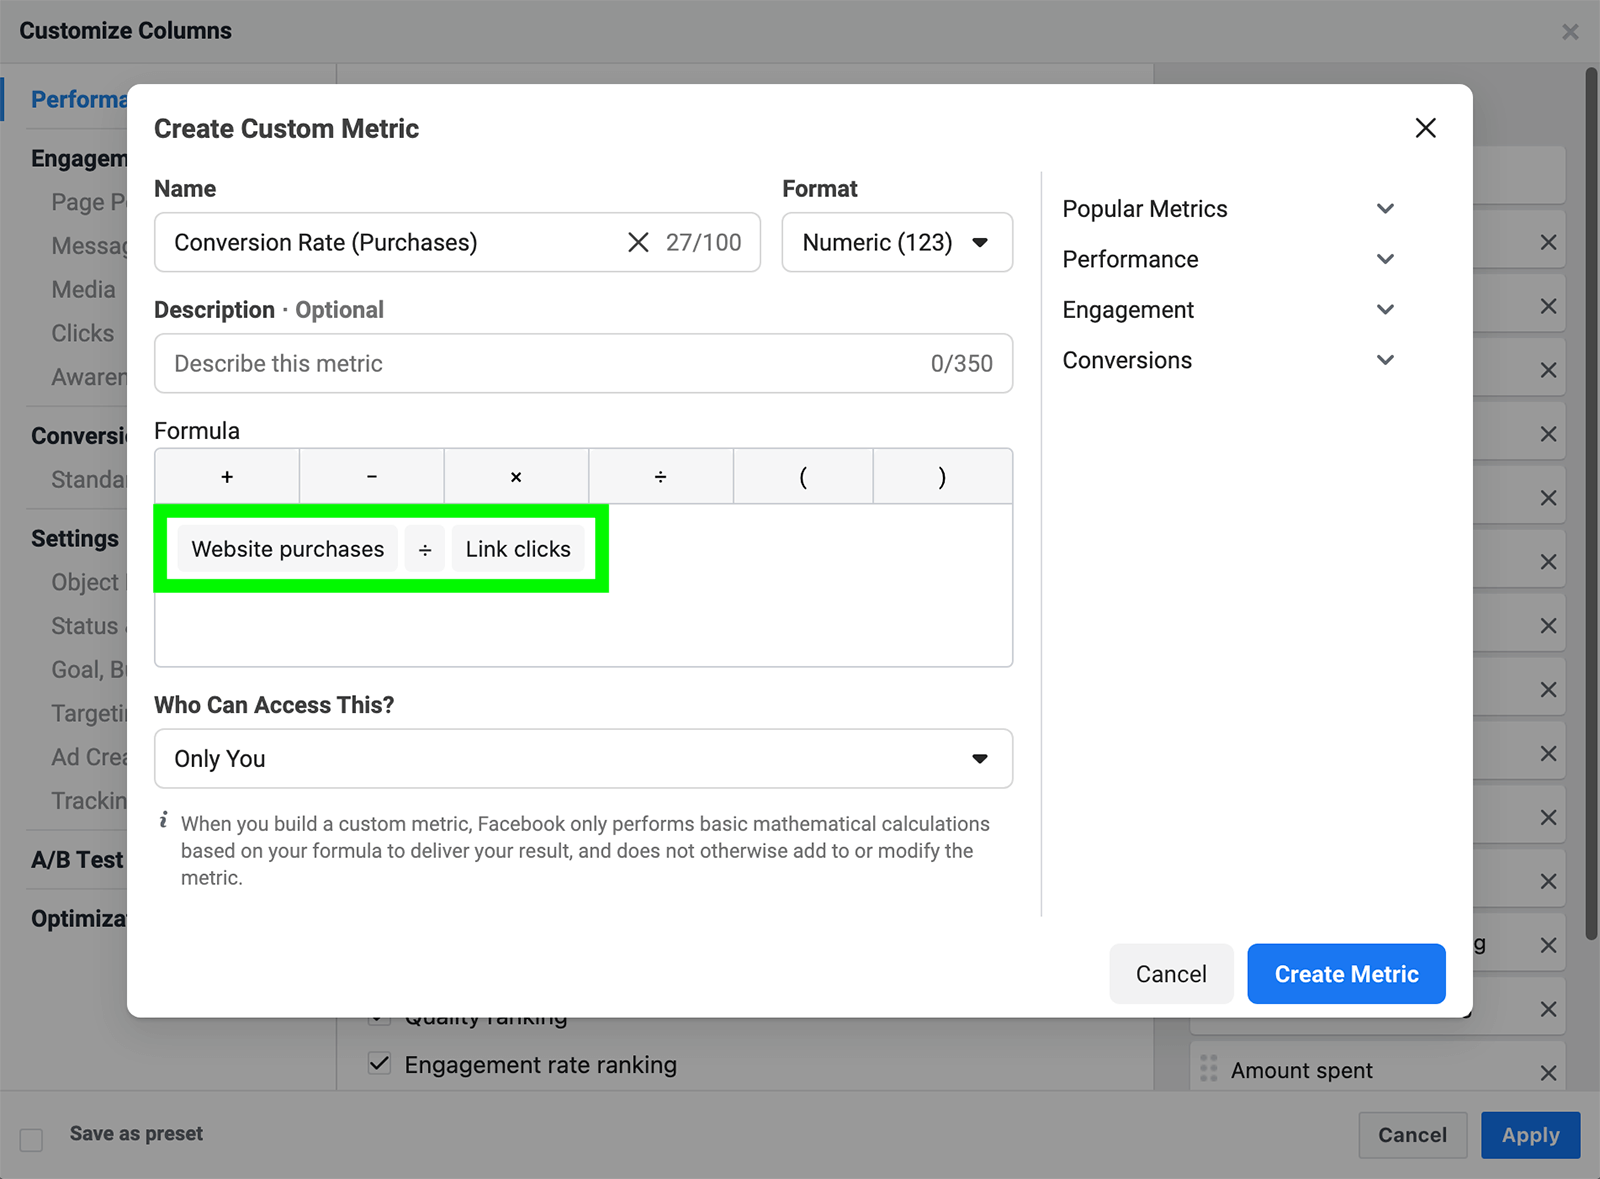
Track Conversion Rates Automatically
Finally, click the Create Custom Metric link to start tracking conversion rate. You can create a formula by dividing the number of conversions by the number of clicks. Keep in mind you can create a separate conversion rate metric to reflect each campaign objective.
Then click the Save as Preset box in the lower-left corner of the window and give the table a unique name. Once you save the view, you can find it in the Columns drop-down menu so you can reuse the same table every time you check your Instagram ads.
Evaluate Instagram Ads Efficiently
With these metrics at your fingertips, you can answer common questions about your Instagram ad performance:
- How many results has your campaign generated this week?
- Does one of your ads have a CTR that's higher than average for your campaign?
You can also compare current ad performance to past results:
- Are you meeting or exceeding average performance metrics for your brand?
- Is one of your ads underperforming and can you identify ways to improve it?
If you don't have a lot of past data or if you want to look at the bigger picture, you can also compare your ad sets to industry averages.
Using Placement and Platform Breakdowns
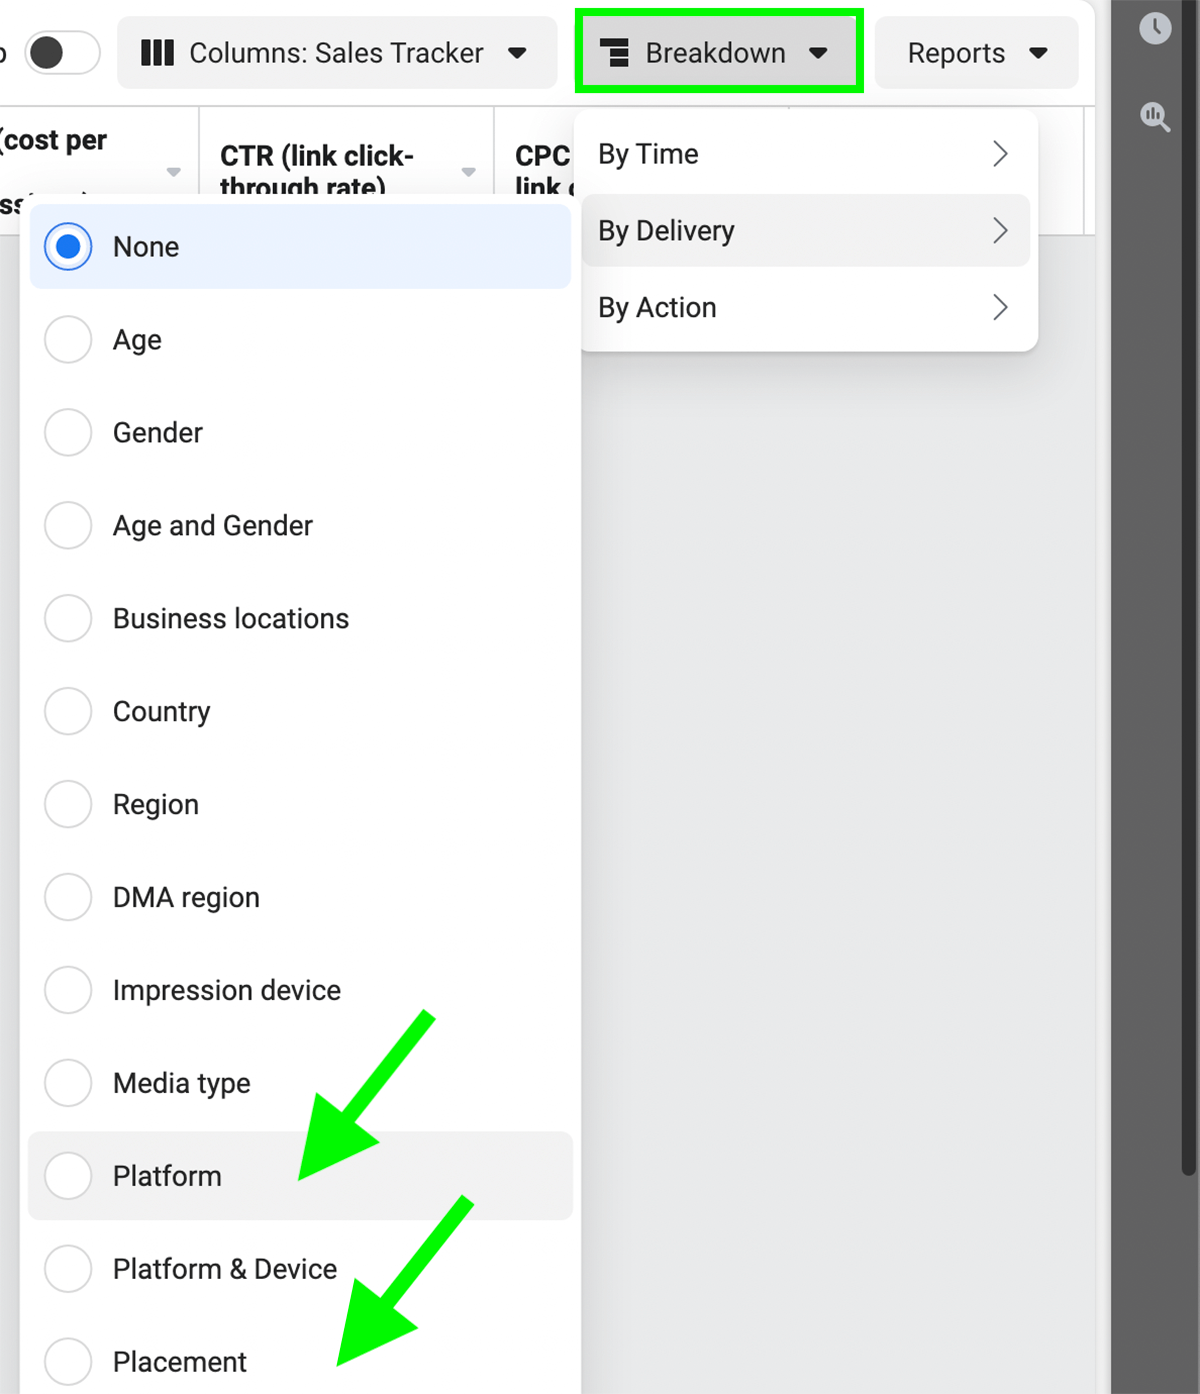
If your campaign is running on Instagram only, then you can use your custom tables to view the key metrics for any campaign, ad set, or ad with one click. But if your campaign is running on Facebook, Instagram, and the Audience Network, then you have to take another step to filter out all non-Instagram results.
Click the Breakdowns button and select either Platform or Placement. With the former, you can see all campaign results on Instagram. By choosing the latter, you can see more granular results by feed, Explore, Stories, and so on.
#2: Set Up Custom Ads Manager Reports
Ads Manager tables are ideal for providing a campaign snapshot at a given moment in time or for a set time frame. For example, you can use custom table views to check key metrics for the day, week, or month.
Which AI Moves Actually Matter?
That's what every marketer is wrestling with now. New AI strategies, new tools, new takes every week — but no clarity. Most marketers and business owners are trying to figure out AI alone.The AI Business Society is your trusted guide. Get expert-led training you can put to work immediately. Plus a community of marketers sharing what's actually working.
I'M READY FOR REAL AI RESULTSBut if you want to look for patterns or map changes over time, charts are much more helpful than tables. Although clicking the Charts icon in the upper-right corner of Ads Manager automatically translates your data into a visual format, this feature doesn't let you add or save custom metrics.
To create time-saving charts, select your custom table view in Ads Manager and click the Reports button. When the drop-down menu opens, select Create Custom Report. The metrics you added to the table view automatically appear in the report.
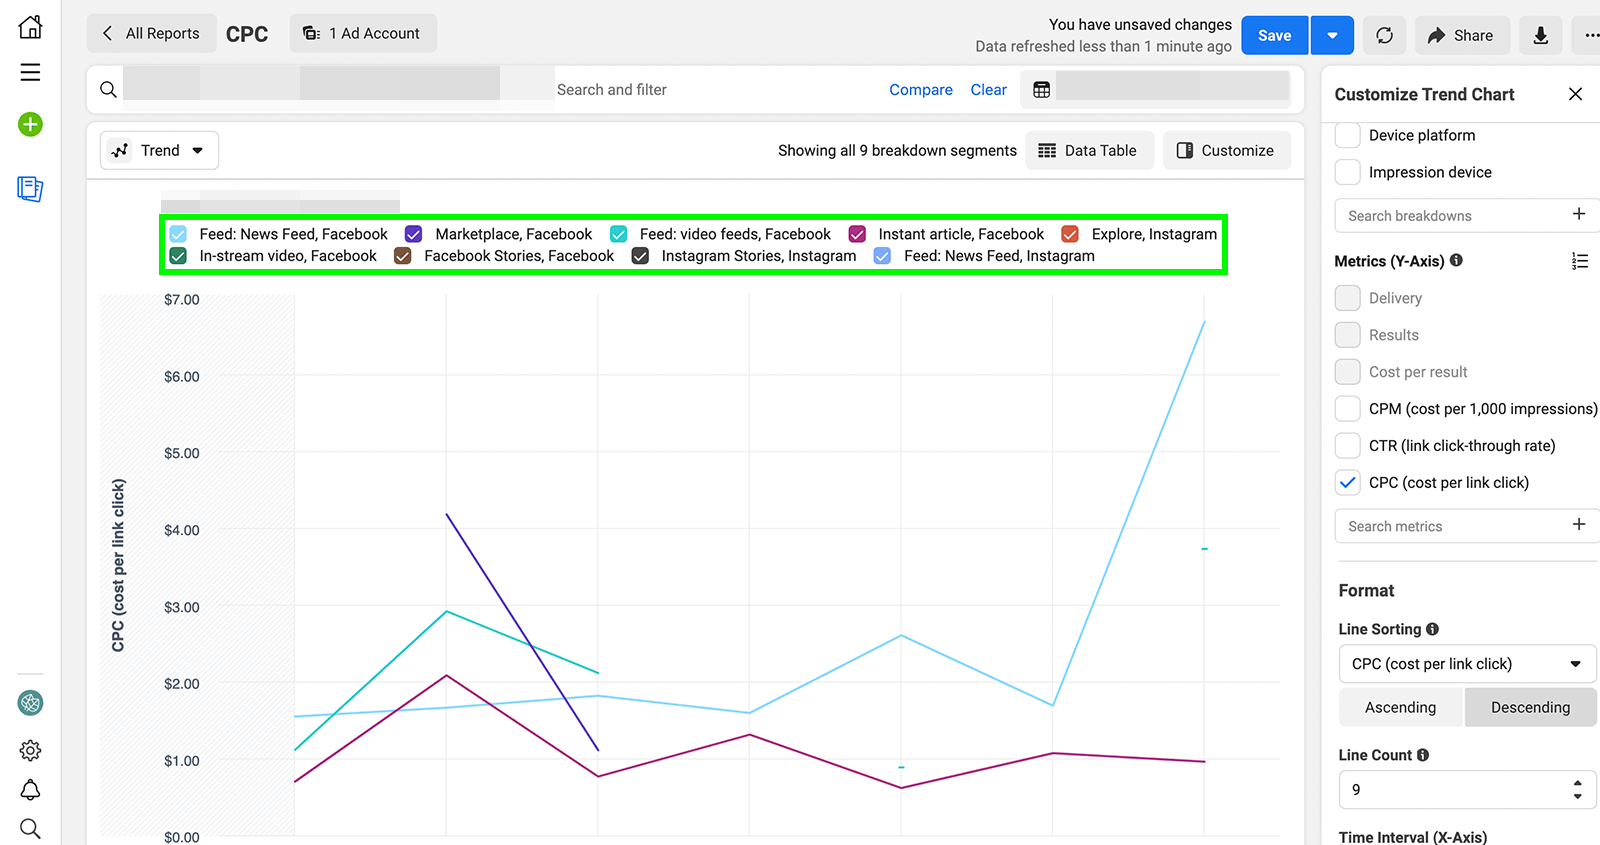
To track changes over time, select the Trend view and choose which metric you want to chart.
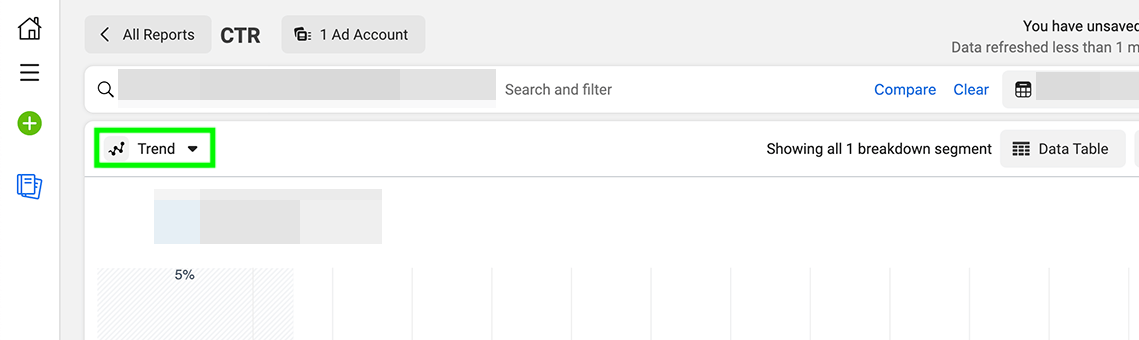
For example, you may want to see how CTR, CPM, or conversion rates have changed over the week or month.
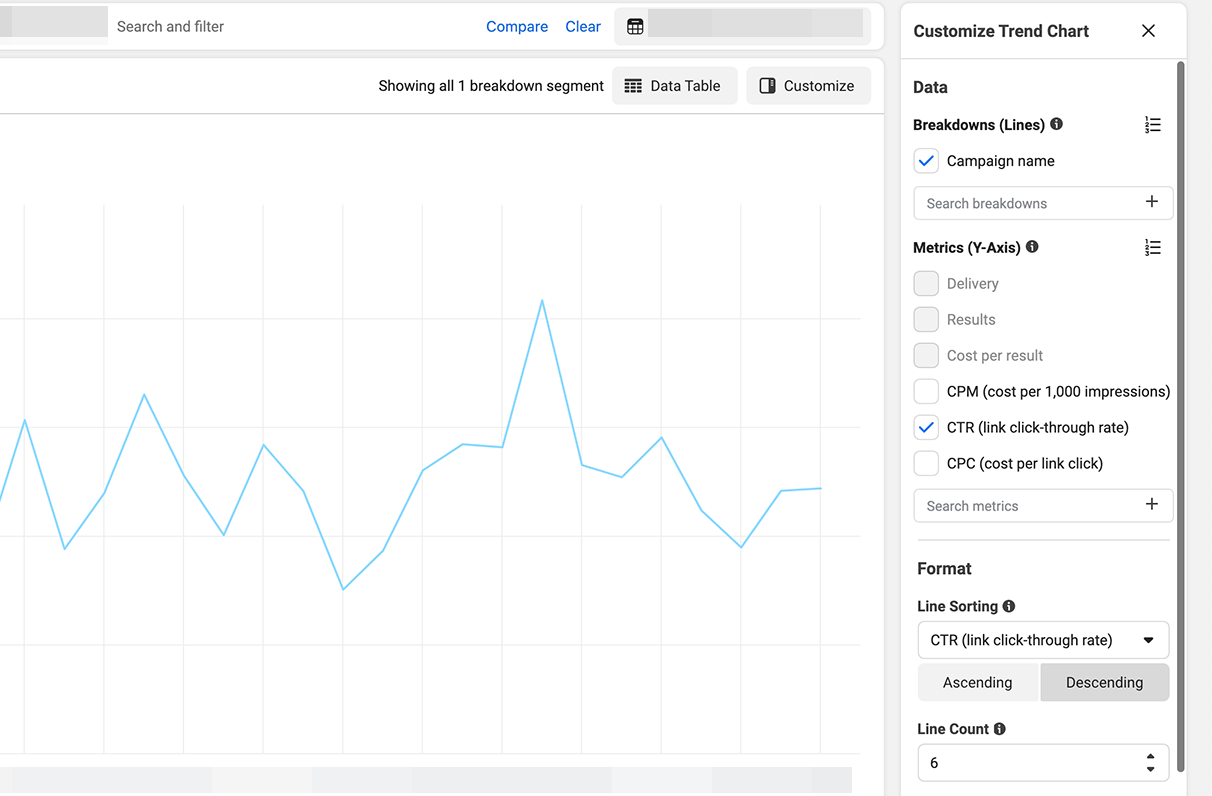
If your campaign is running on multiple platforms, be sure to add the Placement breakdown to your chart. Then uncheck all non-Instagram placements to filter the results.
You can click the blue Save As button to create a separate saved report for each metric. To reuse these charts, go to the Ads Reporting tab and choose any saved report. Select the campaign and time frame, and you can start analyzing the results right away without having to reconfigure the display or start from scratch.
Now you can identify patterns and pinpoint shifts in campaign, ad set, or ad performance. That means you can determine when your Instagram ads started to hit their stride or when performance began to decline, which are key steps toward optimizing your Instagram campaigns.
#3: Use Breakdowns to Gain Deeper Insights
With tables and reports, you can easily see campaign performance in the moment or over time. In most cases, that's all you need to identify a major issue efficiently or confirm your Instagram ads are delivering as expected.
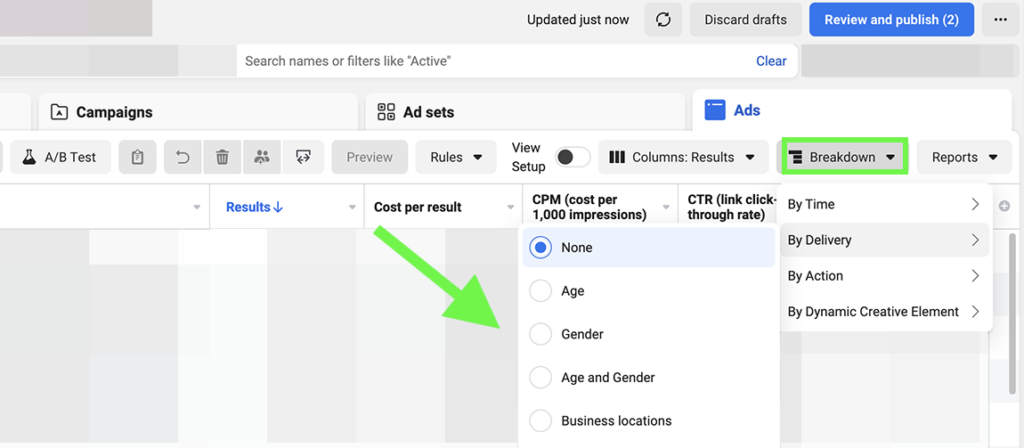
But when you want to learn why your ads are performing a certain way or how to optimize them, you need more information. To get more insightful campaign data, use the Breakdown feature.
To access breakdowns, open your Ads Manager account and select one of the custom table views you've created. Then click the Breakdown button and select one of the options from the drop-down menu. In addition to platform or placement, you can distill data by:
3 Days of World-Class Training—Zero Travel!

Couldn't make it to Social Media Marketing World and AI Business World this year? Get all of the great content at a fraction of the price with a Virtual ticket.
That’s full access to recordings of every keynote, workshop, and session—the ones people travel thousands of miles to see. Don't wait. Get your Virtual ticket and enjoy actionable content that you can watch anytime, anywhere.
- Time, ranging from month to day
- Demographics, including gender, age, or region
- Device type, including iOS or Android
- Action, including reaction type or carousel card
- Dynamic creative element, including headline, URL, or call to action (CTA)
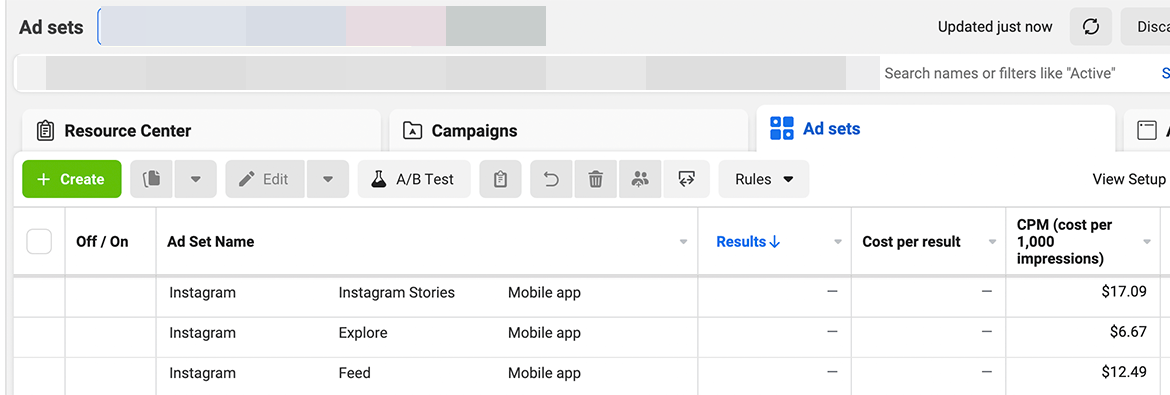
Using this data, you can get a better sense of what kinds of people, devices, platforms, and placements are driving the best results.
Are people in a certain region converting far more often than the rest of your target audience? You may want to focus a bigger percentage of your ad budget on people in that area. Is Instagram Stories driving far more clicks than feed placements? You may want to consider running an ad set with Stories placements only.
As useful as these insights are, it's important to know that Ads Manager does have some limitations. Due to iOS-related privacy updates, Ads Manager provides breakdown data for in-app metrics only. If your campaign targets results on your website or in your app, Ads Manager can only show breakdowns for metrics like CPM and CTR—not for content views, website purchases, or other third-party results.
#4: Set a Schedule to Review Your Instagram Ads
Now you know how to access quick overviews, trend reports, and data breakdowns for your Instagram ads. But how often should you check campaign results in Ads Manager?
In many cases, you can check your Instagram ads less often than you might think. Use these guidelines to create a basic Instagram ads review schedule:
- Are your ad sets still in the learning phase? Aim to check them once per day to make sure they're continuing to deliver and collect data. In most cases, ad sets leave the learning phase once 50 optimization events have taken place.
- Has your ad set been running for less than a month? Aim to check it once per week after it leaves the learning phase.
- Has your ad set been running for more than a month? Aim to check it once per month after you've set up automated rules (see below).
As you can see, frequent checks aren't usually necessary. When ad sets are in the learning phase, delivery and results are likely to fluctuate significantly. That means checking ad sets every hour may lead to an inaccurate view of campaign performance. Attempting to optimize campaigns during this window of time may compromise performance.
Once Ads Manager gathers enough data to move past the learning phase and optimize delivery, campaign performance is likely to even out. That means you can analyze your Instagram ads less frequently and make better-informed decisions about how to optimize performance.
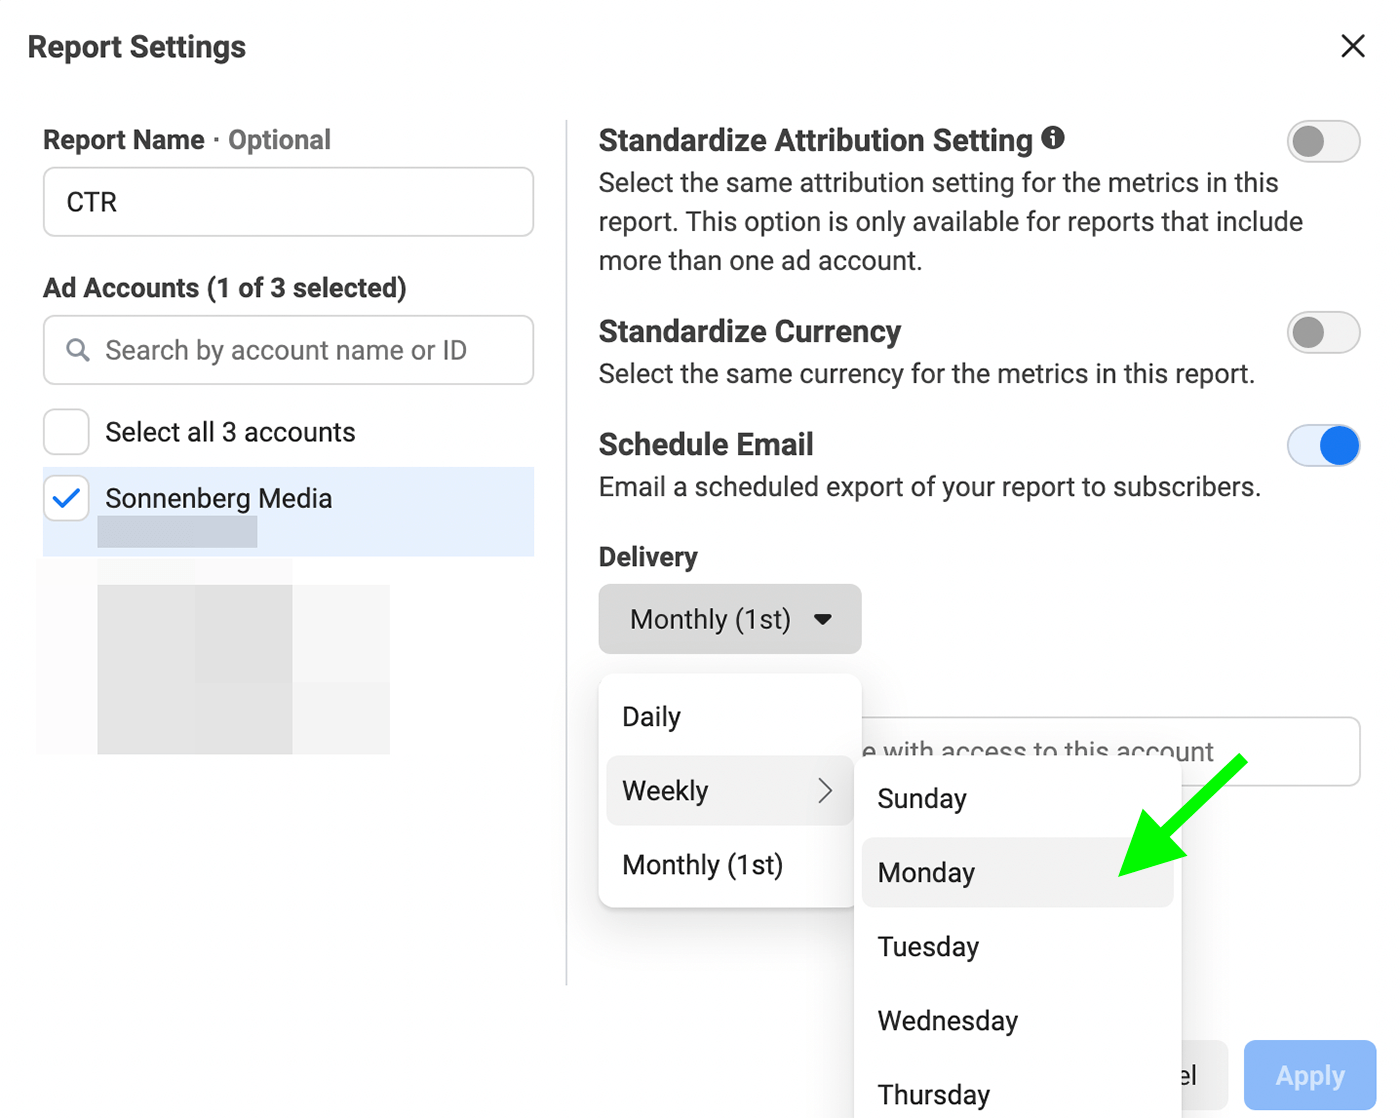
To check your Instagram ads, you can open Ads Manager and review each ad set manually. But when you want to save time, scheduling reports may be a better idea. You can schedule any custom report template to generate automatically.
To automate the process, navigate to Ads Reporting and open the report you want to send. Click the Report Settings button to the right of the report title. Toggle the Schedule Email switch and choose when to send the report and who should receive it. Then repeat the process to schedule each report you need for Instagram ad analysis.
#5: Apply Automated Rules to Guide Instagram Ad Campaign Management
Before you step back to weekly or monthly Instagram ad maintenance, it's important to set up automated rules for your campaigns. Although ad performance tends to even out after the learning phase ends, campaign results can still fluctuate over time, especially due to ad fatigue or seasonal competition.
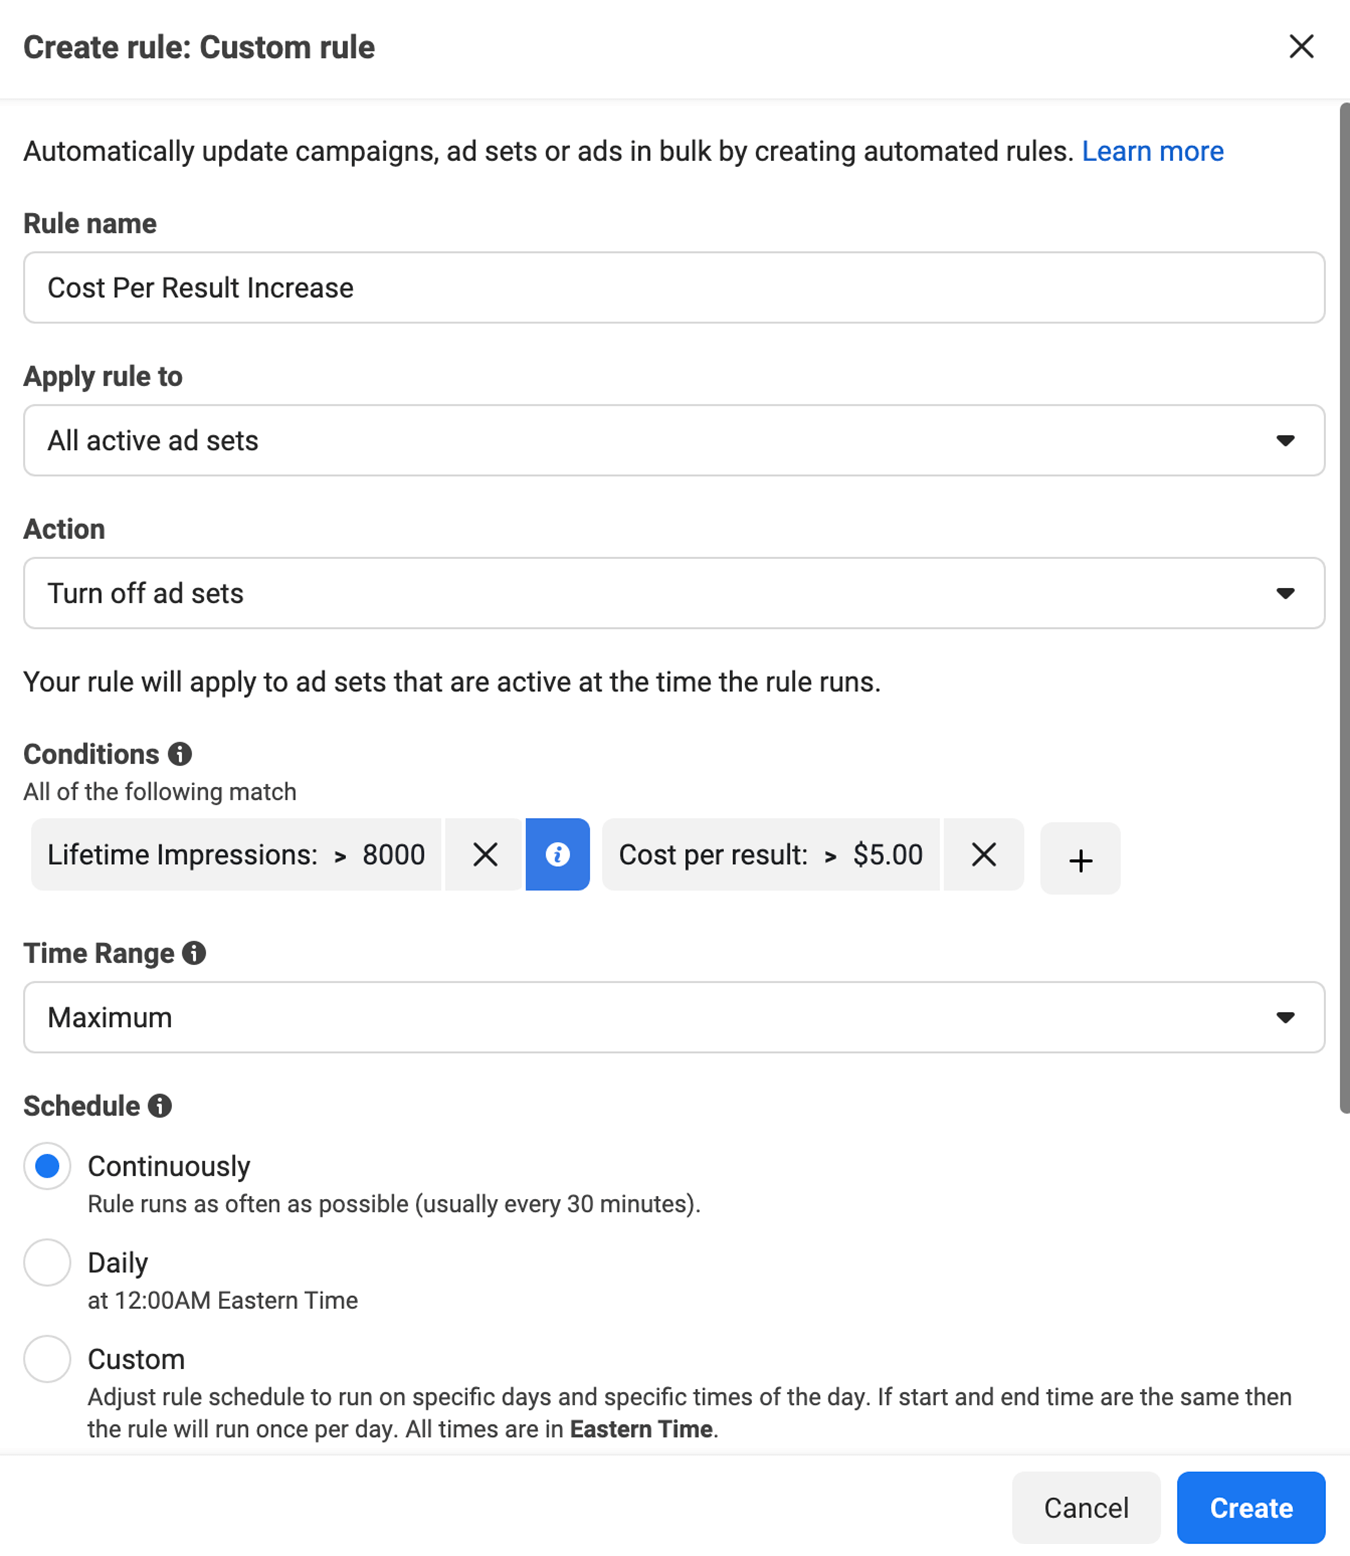
To start optimizing your Instagram automatically, click the Rules button in Ads Manager or go right to Automated Rules in Business Manager. Then click to create a new custom rule that triggers when campaign performance declines.
Select Turn Off Ad Sets if you want the rule to apply automatically or choose Send Notification Only if you want to review manually. Then set the conditions. For example, you may want to shut off ad sets when the cost per result exceeds a certain amount or if the frequency gets too high. Finally, choose the time frame for the rule—from today to the last week to the last 30 days.
Now you can feel confident that your Instagram ads won't get overly expensive or fail to meet campaign goals, even if you only check Ads Manager reports once a week at most. But what if you're more concerned about missing opportunities to scale your campaigns? You can also use automated rules to scale Instagram ads automatically.
First, choose the conditions. For example, you may want to scale an ad set if cost per result falls below a certain threshold. Then choose the automated action. For example, to scale an ad set, you may want to increase the daily budget.
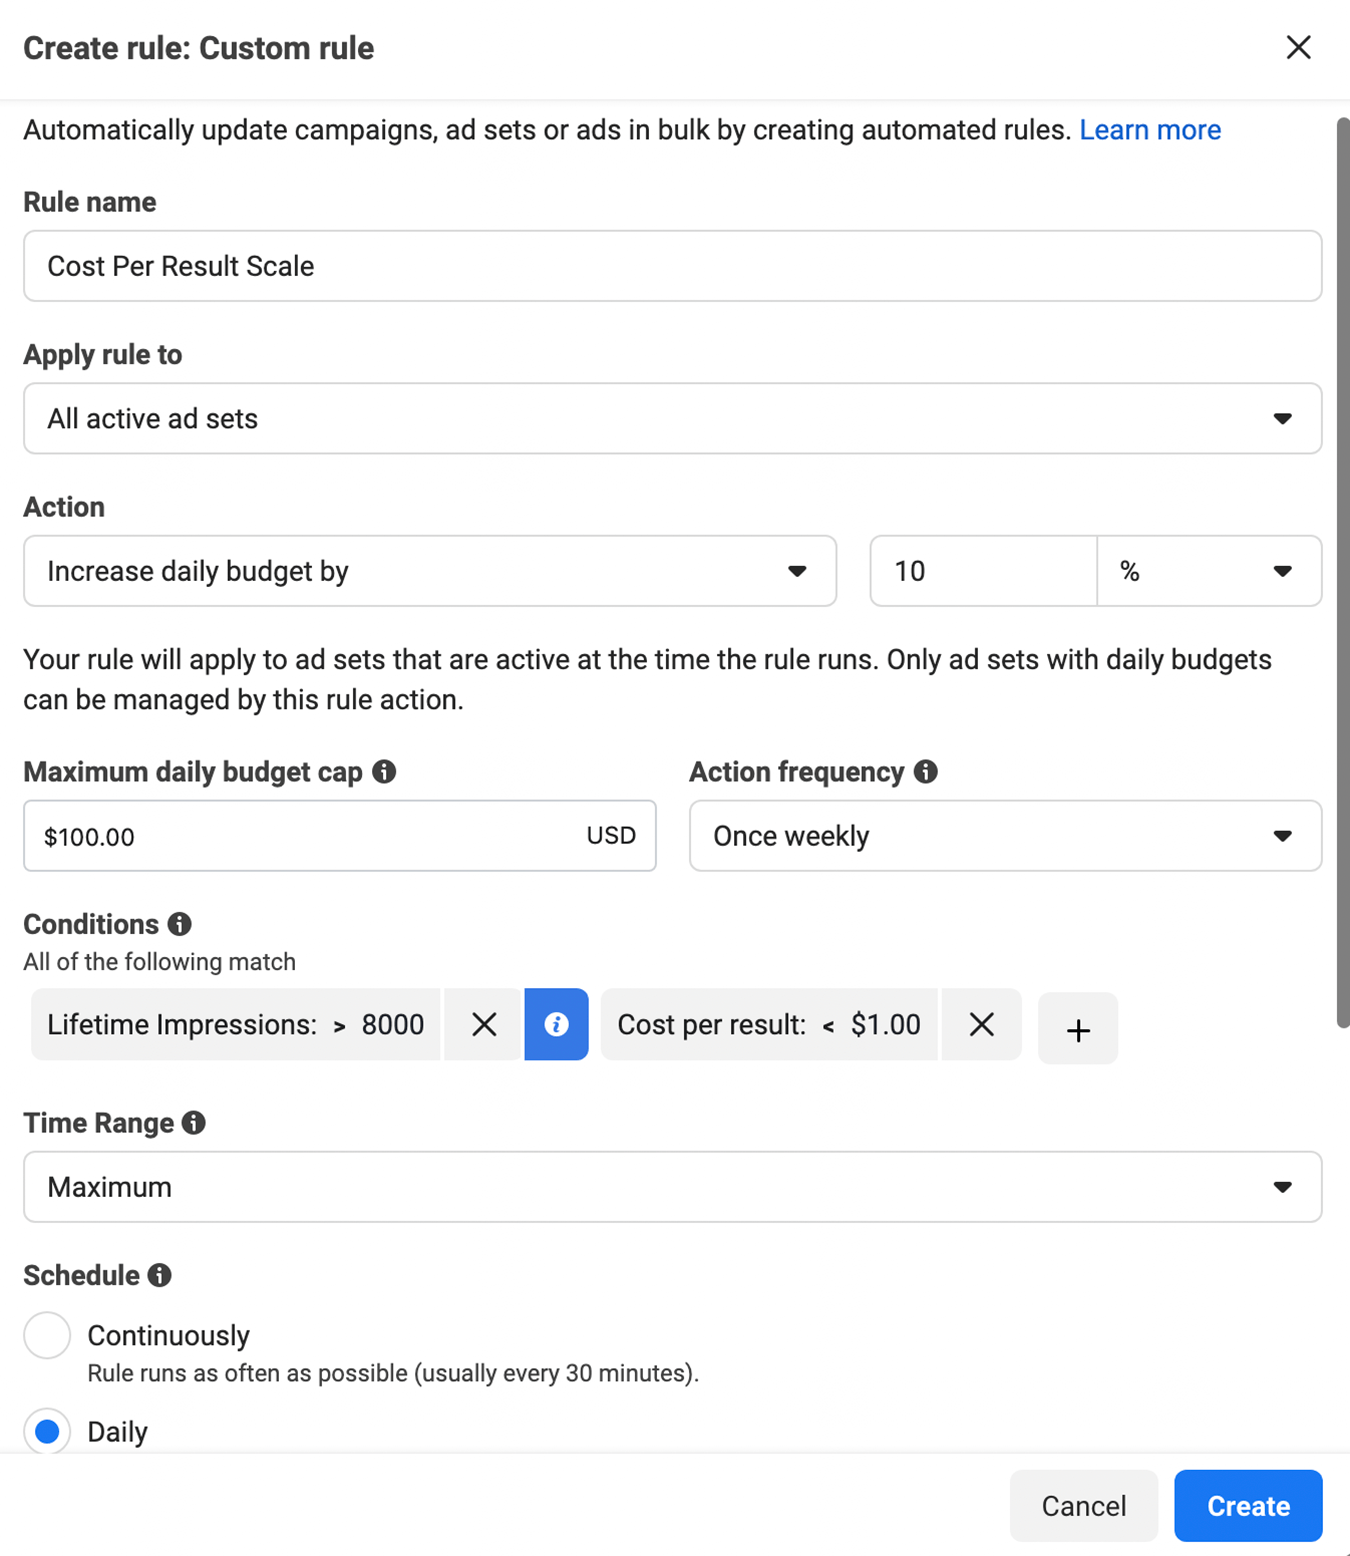
To prevent ad sets from overspending, you can set a maximum daily budget cap. You can also prevent them from scaling too quickly by increasing the daily budget by a modest amount. To avoid sending an ad set back to the learning phase, keep budget increases relatively low—such as 10% or 15% per week rather than 100% each day.
#6: Optimize Future Instagram Ad Campaigns With Current Split Tests
Now you know how to analyze and optimize Instagram ad campaigns to drive the best possible results. But what if you want to launch a new ad set to reduce ad fatigue in a long-term campaign or you want to see which ad sets perform best in a completely new campaign? Ads Manager's split tests can answer your questions efficiently.
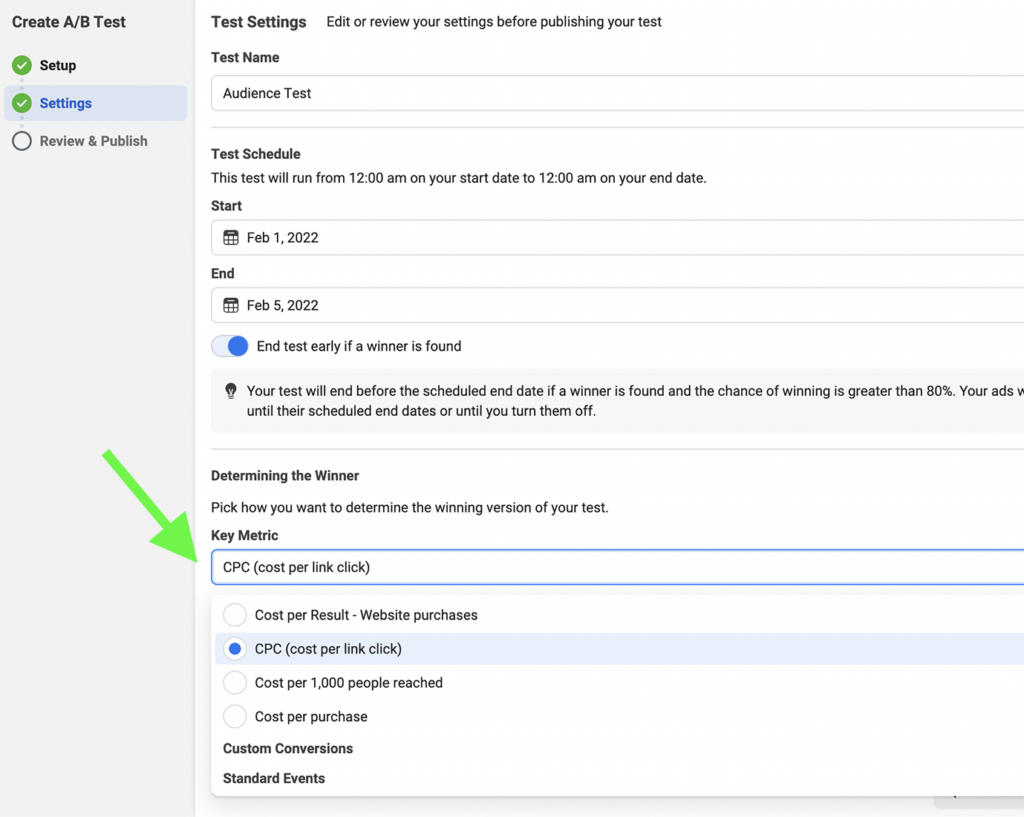
To get started, click the A/B Test tool in Ads Manager or go right to the Experiments panel. Choose two or more ad sets to compare, ideally with only one major difference between them. For example, you might choose ad sets with different creatives, audiences, or optimization events.
Then select the key metric to determine the winner of the A/B test. All options are cost-based metrics like CPC, cost per result, or cost per purchase to help you achieve the highest possible return on ad spend (ROAS).
Once the test concludes, you can find the results on the Experiments tab. Did one audience, placement, or creative far outperform the other? You can use your insights to create more effective Instagram ad campaigns. Don't hesitate to keep testing new ideas to ensure you're always using the latest data and making the best decisions for your ad account.
Conclusion
Analyzing and optimizing Instagram ads can be incredibly time-consuming and resource-intensive. But it doesn't have to be either. With automated rules, A/B tests, and streamlined reporting, you can analyze and optimize Instagram ads efficiently so you can get better results in less time and with fewer resources.
Get More Advice on Instagram Ads
- Optimize your Instagram ads creative.
- Target eight valuable Instagram ad audiences.
- Write Instagram ad copy that converts.
Stay Up-to-Date: Get New Marketing Articles Delivered to You!
Don't miss out on upcoming social media marketing insights and strategies! Sign up to receive notifications when we publish new articles on Social Media Examiner. Our expertly crafted content will help you stay ahead of the curve and drive results for your business. Click the link below to sign up now and receive our annual report!

Curious About How to Use AI?
Our newest show, AI Explored, might be just what you're looking for. It's for marketers, creators, and entrepreneurs who want to understand how to use AI in their business.
It's hosted by Michael Stelzner and explores this exciting new frontier in easy-to-understand terms.
Pull up your favorite podcast app and search for AI Explored. Or click the button below for more information.
