Are you using LinkedIn Creator Mode? Is your content reaching the right prospects?
In this article, you’ll discover how to use LinkedIn Creator Mode Analytics to assess your posts and improve your reach.
#1: How to Access LinkedIn Creator Analytics
As of December 2022, LinkedIn’s updated Creator Analytics is available for all personal profiles. To access these analytics, you first have to have Creator Mode turned on for your personal profile.
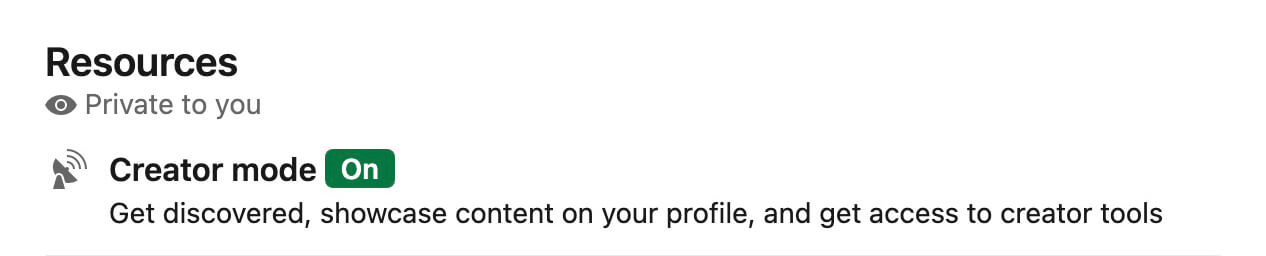
To turn on Creator Mode, go to your LinkedIn profile and locate the Resources panel. Make sure the Creator Mode section displays a green On label. If it doesn’t, open the Creator hub and switch on Creator Mode.
Once you enable Creator Mode, you’ll get access to the analytics data that LinkedIn rolled out in early 2022, as well as the updated analytics the platform introduced in December 2022. You can access these analytics on desktop and mobile from two key locations:
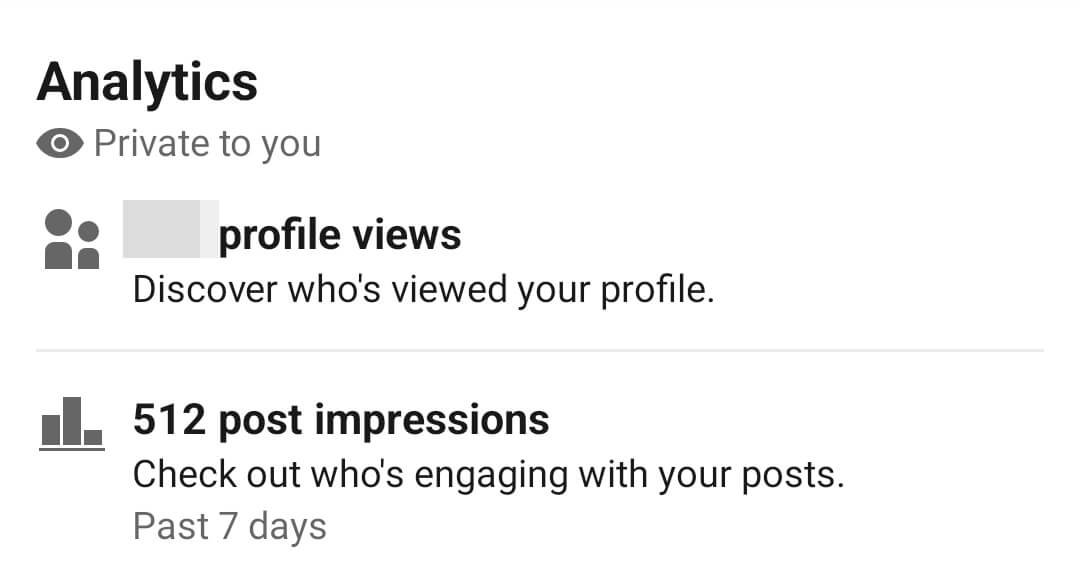
- The Analytics panel near the top of your LinkedIn profile
- The Analytics panel at the bottom of each LinkedIn post
#2: Using LinkedIn Creator Mode Analytics to Understand Your LinkedIn Audience
LinkedIn’s Creator Mode automatically enables a Follow option for your profile. Since it lets LinkedIn members follow you rather than requesting a connection, Creator Mode can help boost visibility for your profile and your content marketing.
On the one hand, that’s ideal for growing your influence and reaching more of your target audience. But expanding your audience quickly means you may lose sight of who’s following you and whether you’re publishing the optimal content. With the new Audience Analytics panel, you can more easily understand who your followers are and spot trends.
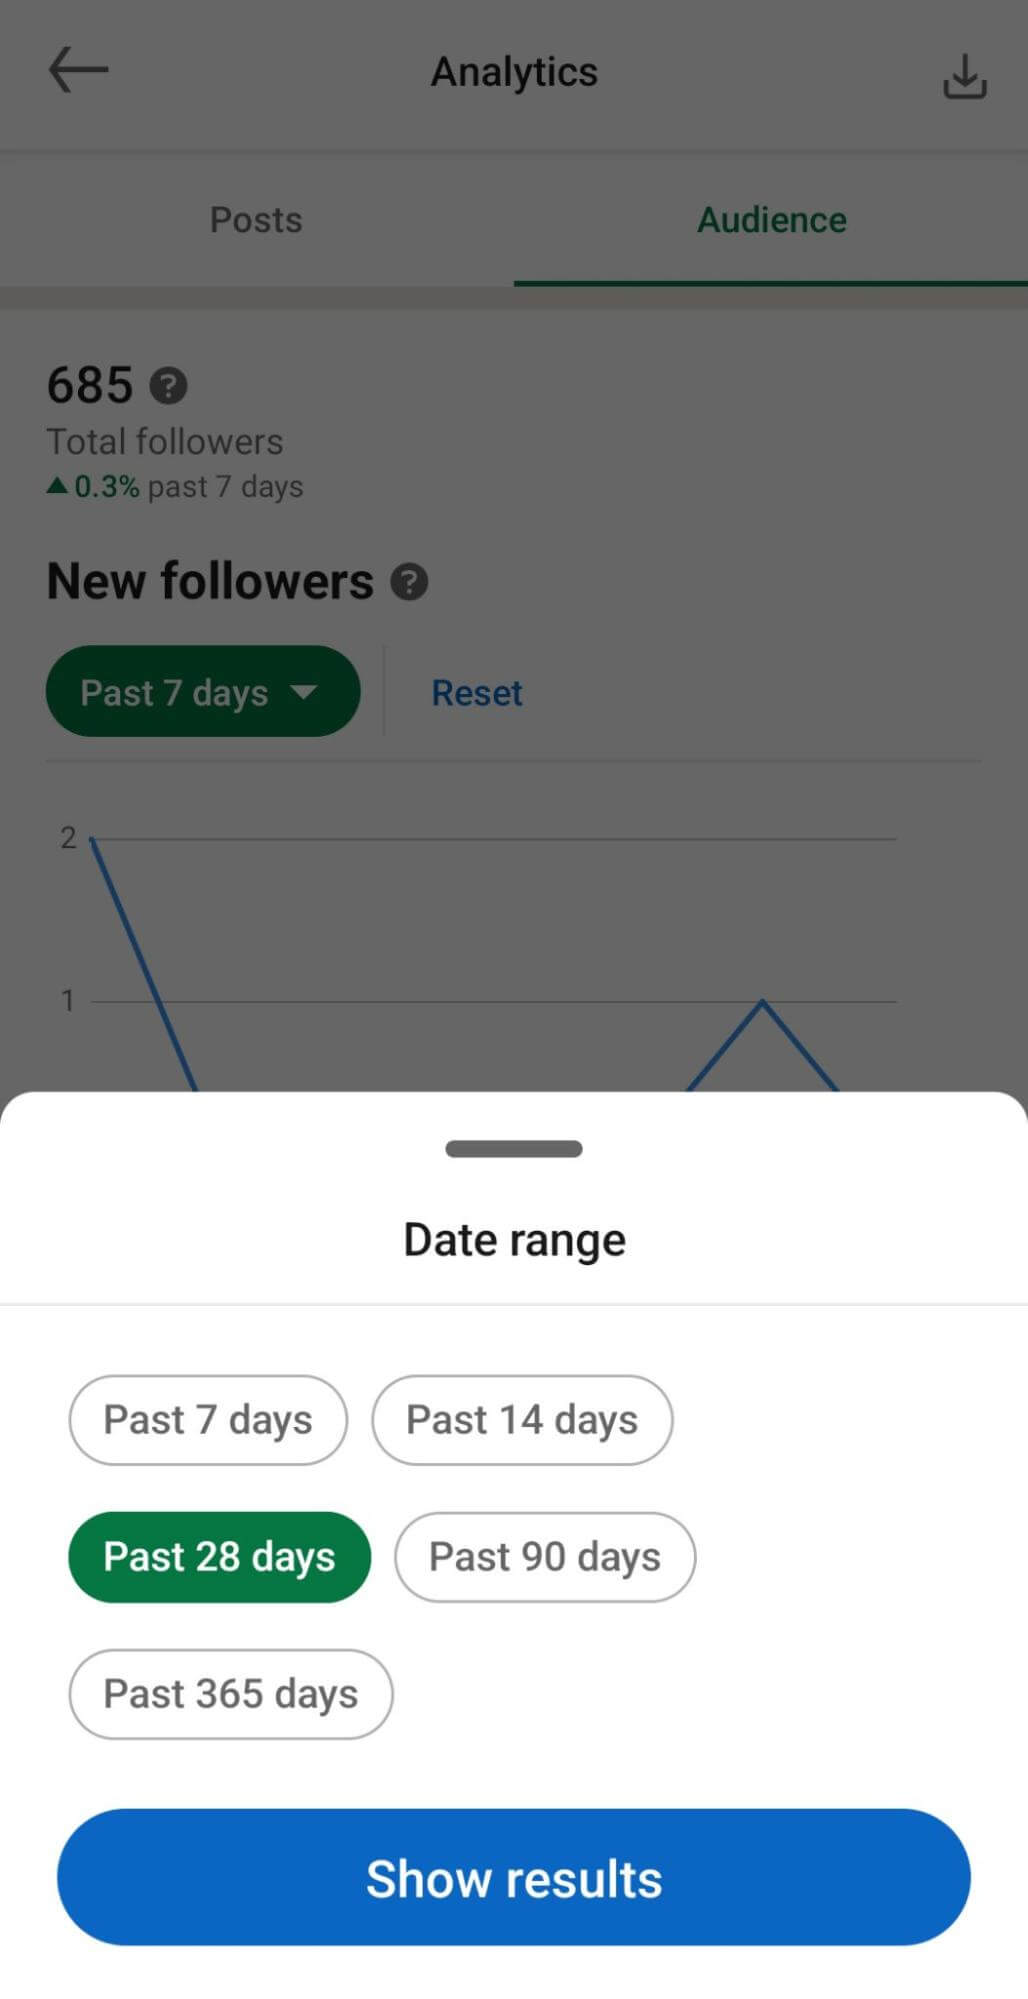
You can access these insights by tapping or clicking the Analytics panel at the top of your profile and going to the Audience tab. Click or tap the Past 7 Days drop-down menu to change the default timeframe.
Chart New Followers
How quickly is your audience growing? Are you meeting growth goals or falling short? By tracking new followers over time, you can better understand whether you’re successfully establishing influence and building an audience.
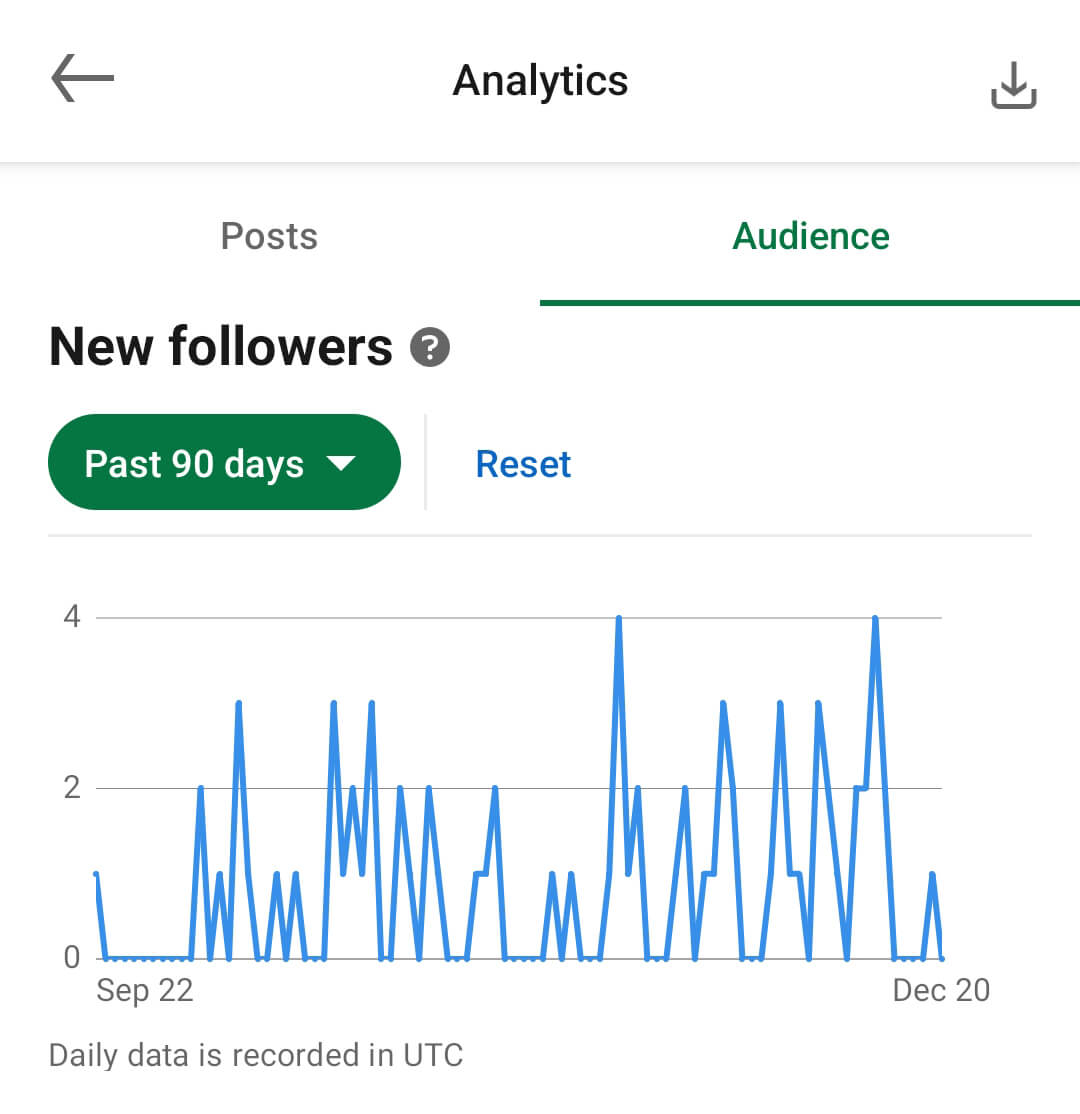
LinkedIn’s Audience Analytics panel displays the total number of followers you have now, along with the percentage you’ve gained or lost over the time period of your choice. Does it seem like your audience growth has slowed recently? It’s helpful to view different time periods and compare them against each other.
For example, you might notice that your annual audience growth rate is on track with your goals. But your growth rate for the past month may be significantly less than your annual average. The sooner you identify potentially problematic patterns, the faster you can pinpoint the source and address the issue before a slower growth rate becomes the norm.
You can also use LinkedIn’s Audience Analytics chart to find days when your follower number spiked or dropped suddenly. If you review your content analytics alongside your audience analytics, you may be able to identify the posts that attracted all of those new followers and use them as models for future content.
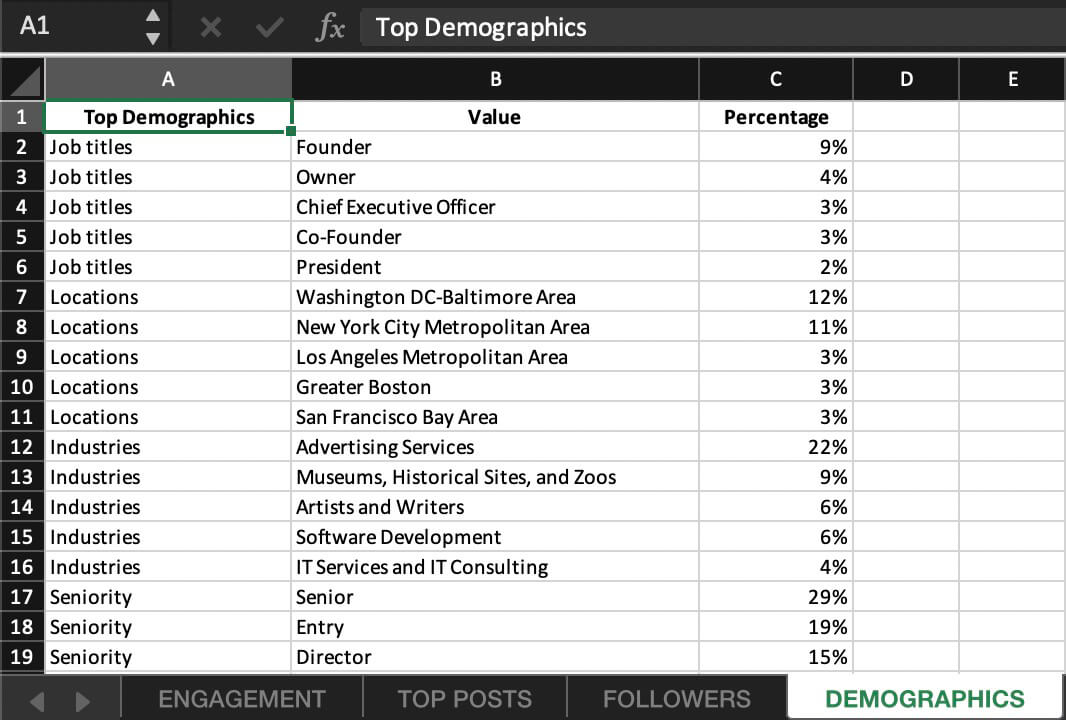
Find Top Demographics
Now you know how many people follow your account and how quickly your audience is growing. But how do you know if those followers align with your ideal customer profile?
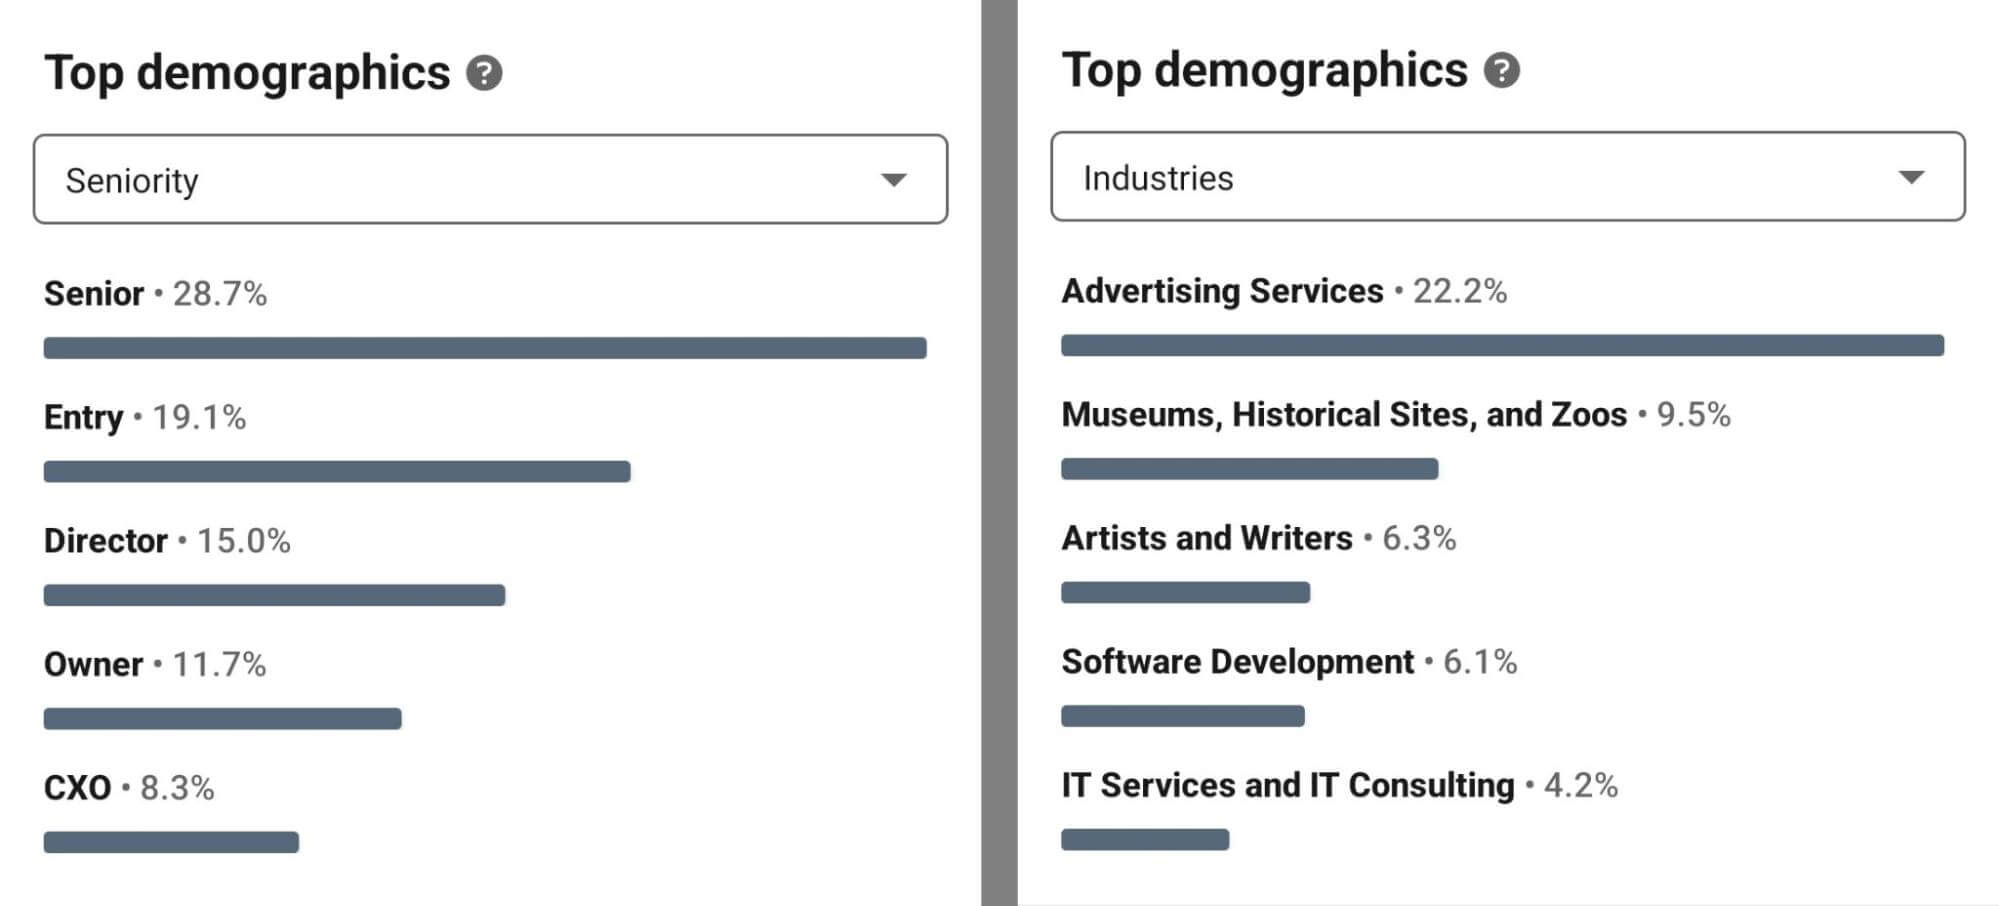
Below your Follower chart, LinkedIn displays a Top Demographics panel that breaks down key audience characteristics. You can use the drop-down menu to toggle among demographic options. Here’s what you can learn about your audience:
Which AI Moves Actually Matter?
That's what every marketer is wrestling with now. New AI strategies, new tools, new takes every week — but no clarity. Most marketers and business owners are trying to figure out AI alone.The AI Business Society is your trusted guide. Get expert-led training you can put to work immediately. Plus a community of marketers sharing what's actually working.
I'M READY FOR REAL AI RESULTS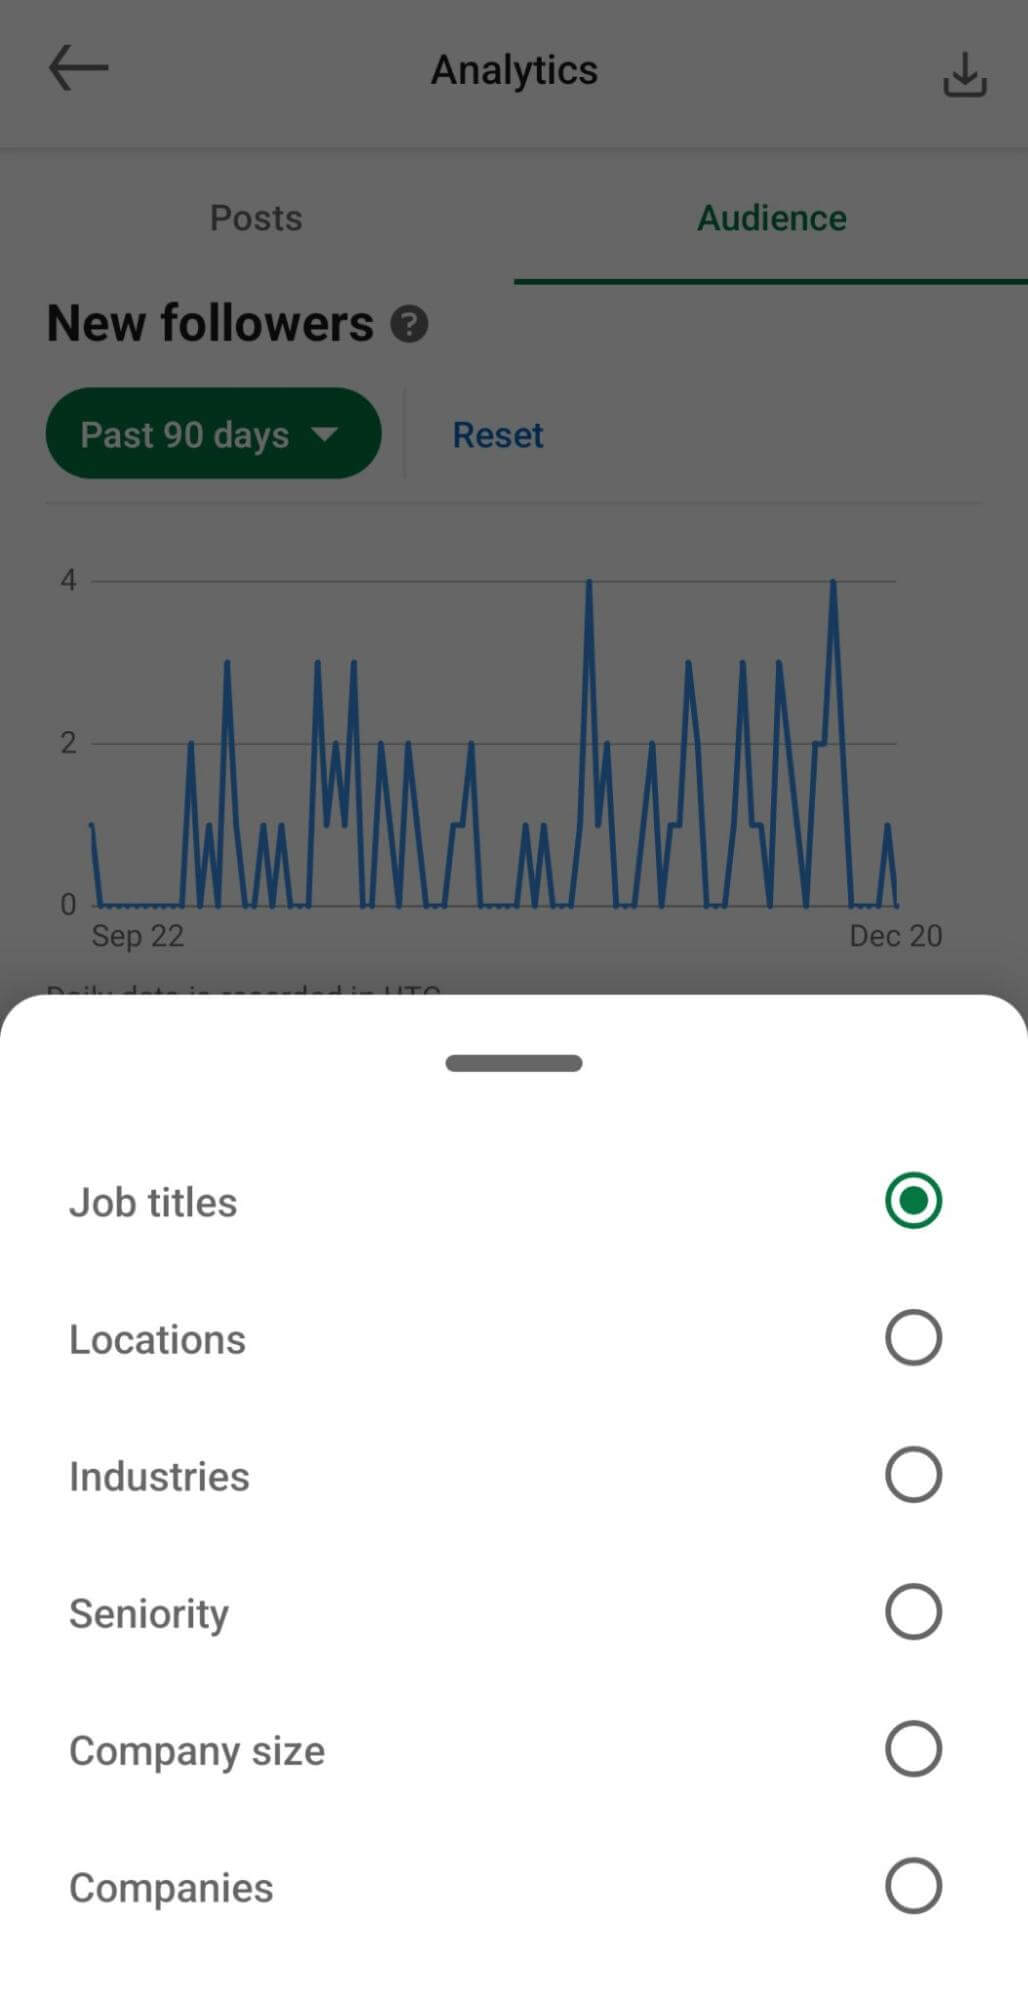
- Job titles like CEO and founder, which can help you determine if you’re reaching decision-makers, middle management, or entry-level employees.
- Seniority, which provides data points that complement job titles and help confirm that you’re attracting followers at the right corporate level.
- Locations and metro areas, which can confirm if you’re reaching people in your local region or your organization’s service areas.
- Industries, which can confirm if you’re connecting with followers in the fields your business typically serves.
- Company size, which reveal whether your content attracts followers who work for small, mid-sized, or large businesses.
- Companies, which list the employers of your followers and help you assess where you have the most influence with decision-makers.
You can use this demographic data in a few different ways. First, you can consider it as you create organic content. You can keep it in mind as you refine your messaging and position your organization.
Is your follower base gradually shifting away from your buyer persona? You might consider using this demographic data to create multiple buyer personas for your profile. Then you can create content that speaks to each customer profile in turn.
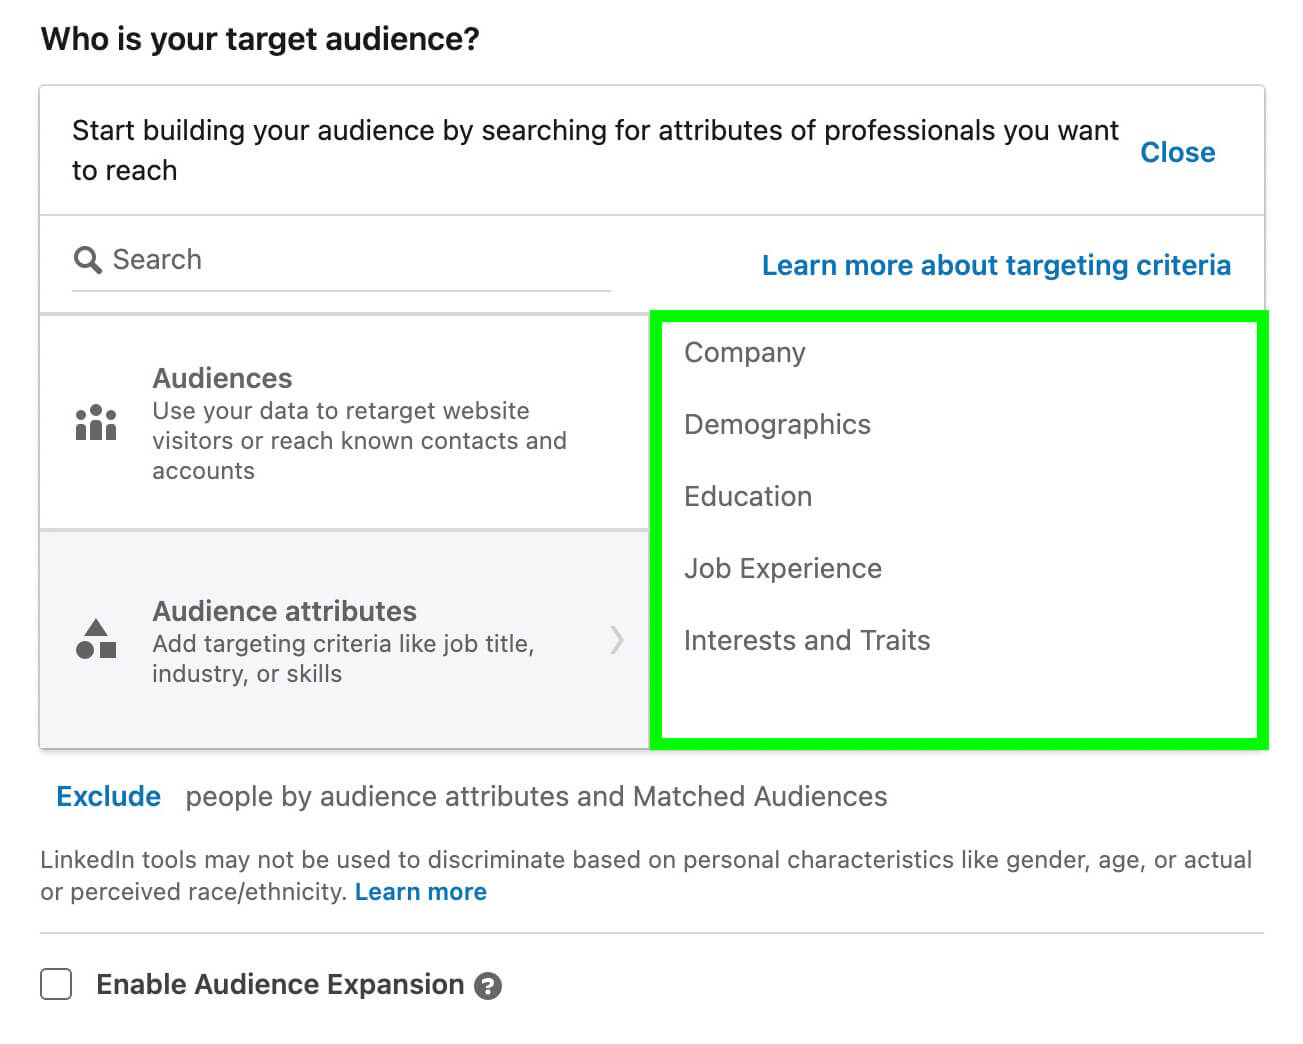
Whether your follower demographics align with your ideal audience or give you new targeting ideas, you can use them in paid LinkedIn campaigns. All of these audience demographics easily translate into targeting options in Campaign Manager.
In Campaign Manager, go to the Audience section of the campaign setup and locate the Audience Attributes panel. You can select demographics that match your current audience or choose related options to reach people similar to your current audience. For more accurate targeting, make sure to uncheck the Enable Audience Expansion option.
#3: Using LinkedIn Creator Mode Analytics to Identify Top-Performing LinkedIn Posts
With LinkedIn’s audience analytics, you can see who’s following your account. But how can you tell who’s interacting with your content? With LinkedIn’s updated creator post analytics, you can find your best content and get a glimpse of who’s engaging with it.
You can access post analytics for creators using the same workflow we covered above. Click or tap the Analytics panel near the top of your LinkedIn profile and navigate to the Posts tab.
Review Content Performance
Want a quick snapshot of your content performance? Use the Content Performance chart to get a general overview of how many people are seeing and engaging with your posts.
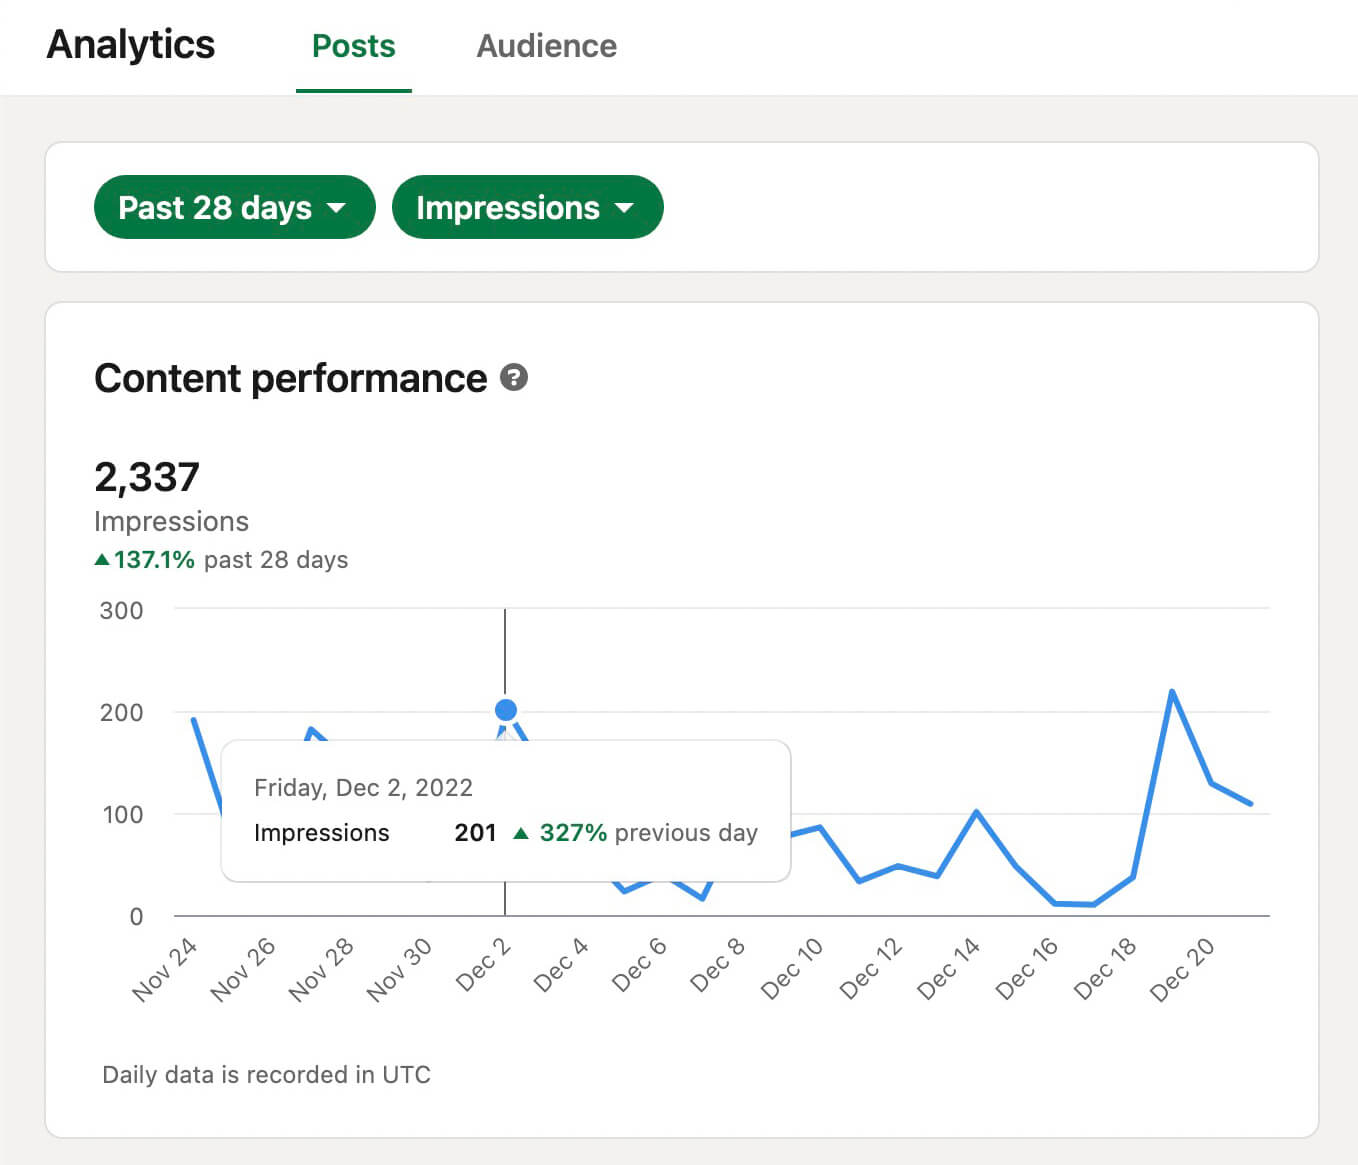
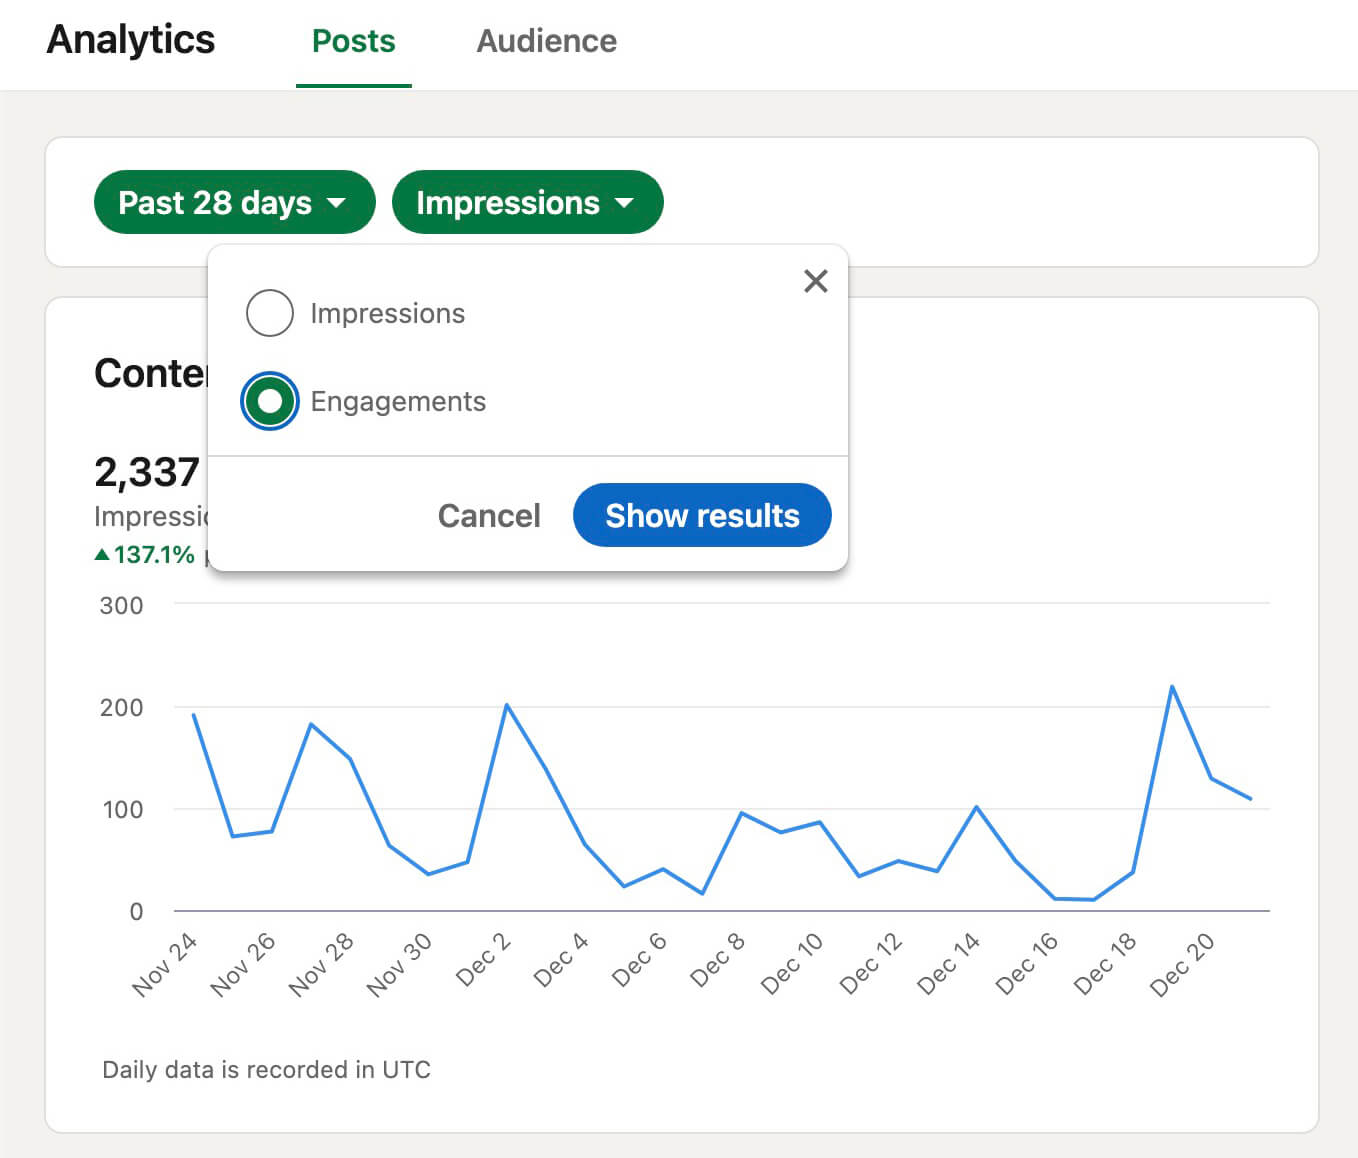
By default, the chart displays impressions for the past week. You can use the drop-down menus to change the timeframe and switch from impressions to engagements.
Similar to LinkedIn’s Audience Analytics for creators, the Content Analytics panel provides a total tally and comparison to the previous period. At a glance, you can see whether your content plan has improved results over time or if your posts aren’t quite hitting the mark.
3 Days of World-Class Training—Zero Travel!

Couldn't make it to Social Media Marketing World and AI Business World this year? Get all of the great content at a fraction of the price with a Virtual ticket.
That’s full access to recordings of every keynote, workshop, and session—the ones people travel thousands of miles to see. Don't wait. Get your Virtual ticket and enjoy actionable content that you can watch anytime, anywhere.
Since this panel includes a line chart, it lets you spot highs and lows easily. Were your post impressions or engagement statistics off the charts on certain days? Were these metrics relatively even over the entire timeframe?
Although you can hover over any date to see daily impression or engagement totals, this chart doesn’t offer much insight into why your content performed the way it did. For more details, scroll down to the Top-Performing Posts panel.
Find Your Best LinkedIn Content
Located below the Content Performance chart, the Top-Performing Posts panel automatically lists the top three posts during the timeframe of your choice. Note that you can use the drop-down menus to adjust the time period and the metric that determines the top posts.
To include additional data in this overview, click the Show More link at the bottom of the list. On this screen, you can see a complete list of all of the content you posted during the selected timeframe, organized in order of performance.
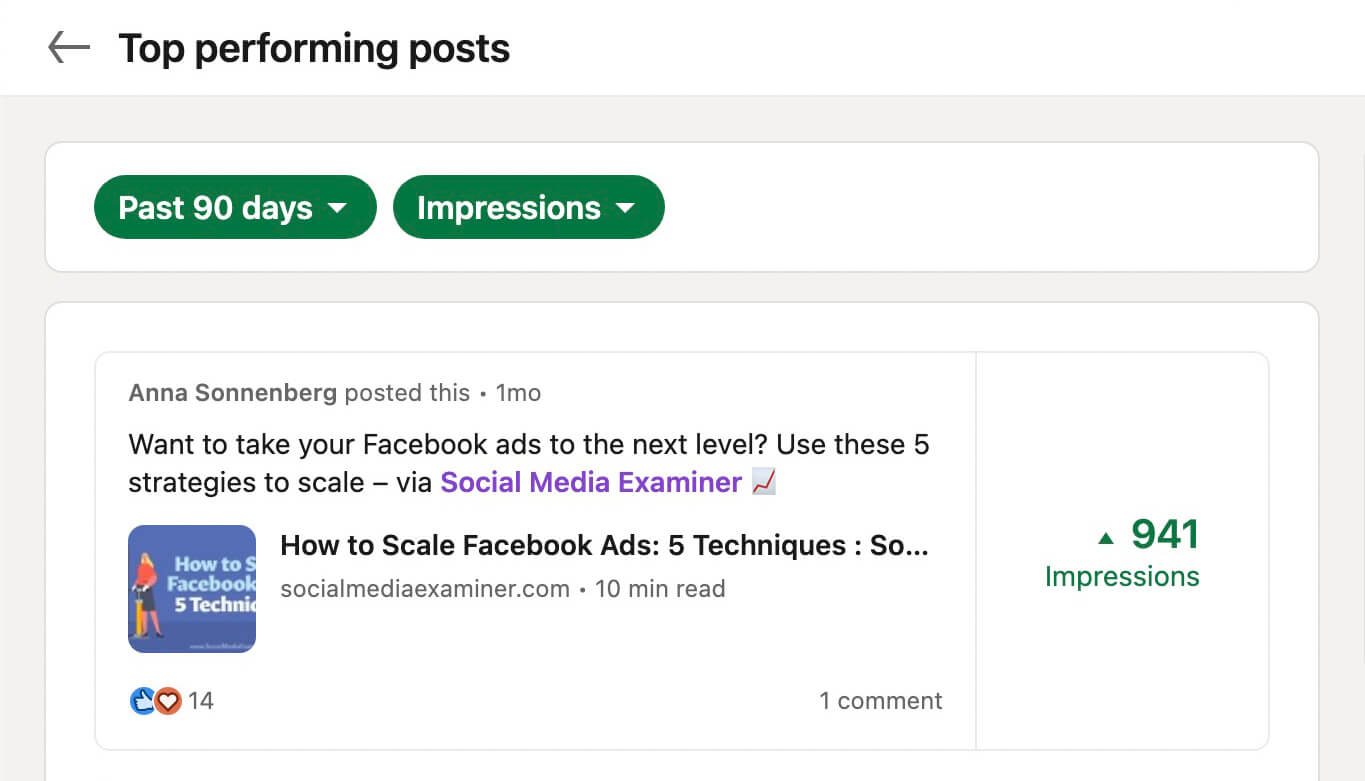
It’s helpful to compare top content for the two metrics. Do the lists match up or do some of your posts have a ton of impressions with minimal engagement? Make sure to focus your analysis on the metric that best aligns with your goals.
Analyze Top-Performing Posts
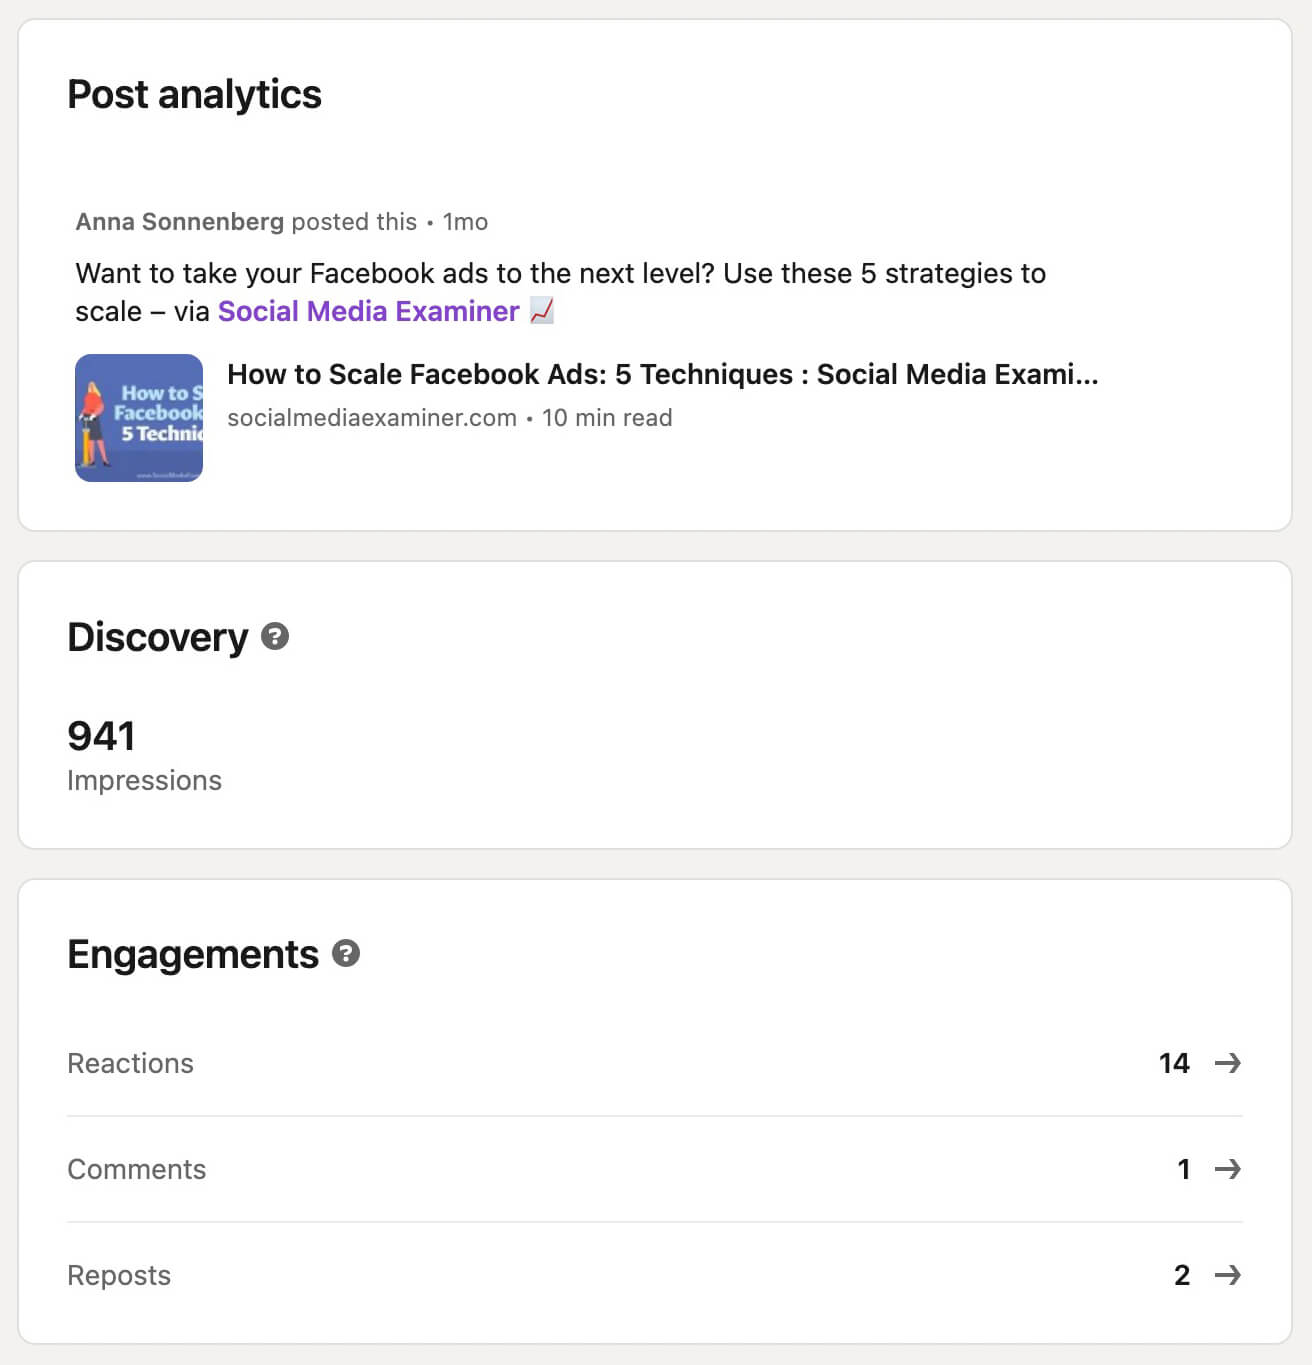
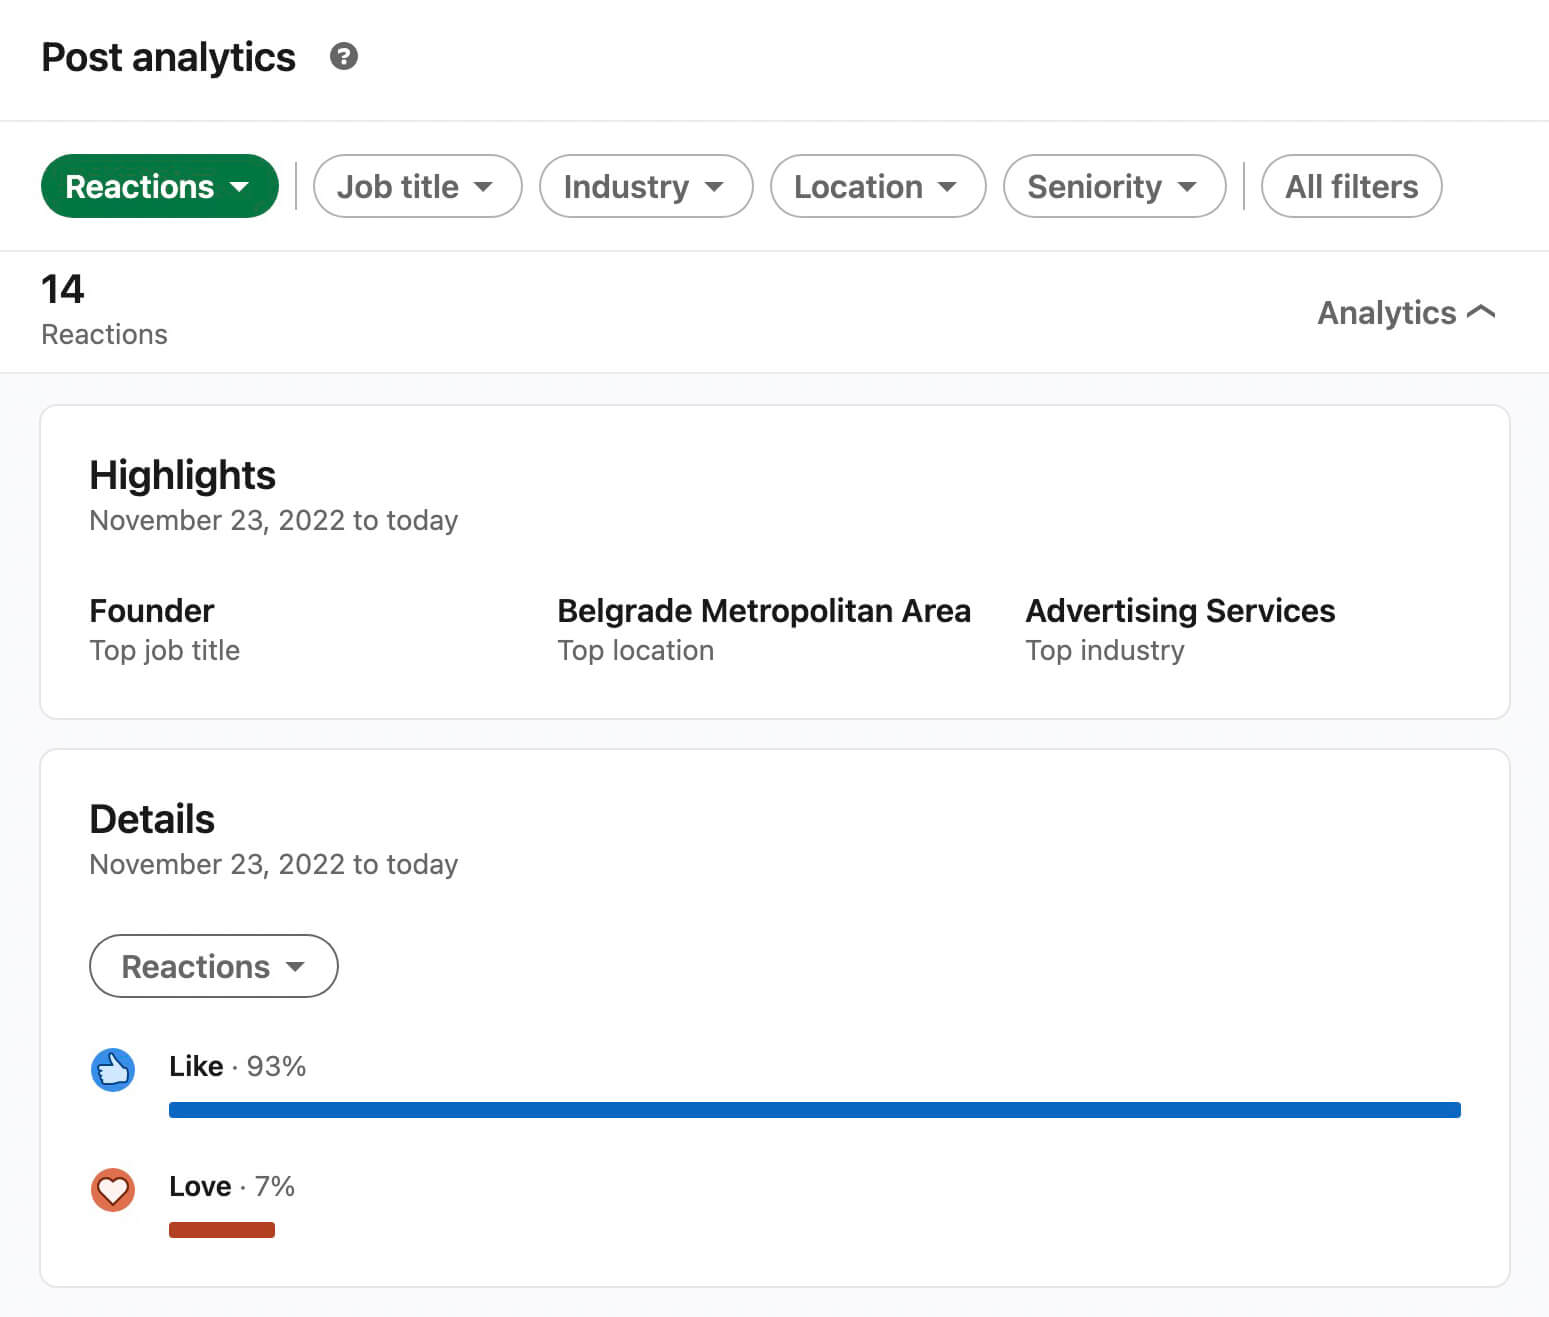
To dig deeper into this data, click or tap any content from the Top-Performing Posts panel. LinkedIn automatically takes you to the original post, where you can see the reactions and comments in context.
Below the post, click the View Analytics link to see details. The Post Analytics panel has a complete breakdown of all relevant discovery and engagement metrics. In addition to impressions, it tallies the total number of reactions, comments, reposts, and shares.
Want to know who saw a specific post? Scroll down to the Top Demographics of People Reached panel. Similar to the Audience Analytics we covered above, this panel displays key demographics for each individual post.
You can use the drop-down menu to review various demographics including job titles, industries, locations, and more. Note that for privacy purposes, company-specific data may be limited until the number of users exceeds a minimum threshold.
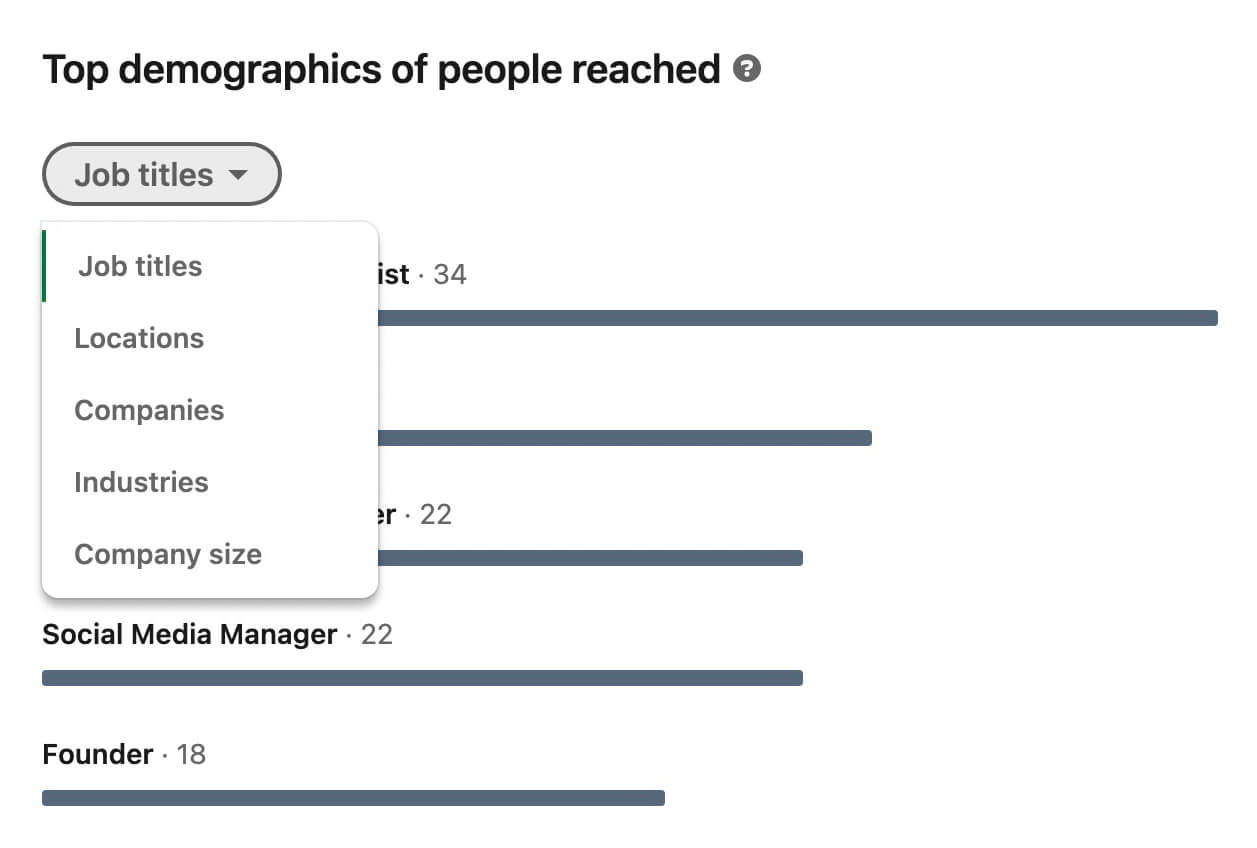
For more insights, select any engagement metric. Here, you can see a summary of the highlights for each metric. For example, you might see that founders and professionals in the advertising industry were most responsive to your content.
You can use the drop-down menu to select other available metrics or go back to the post analytics and select another metric to review. That way, you can see highlights for each engagement and discovery metric.
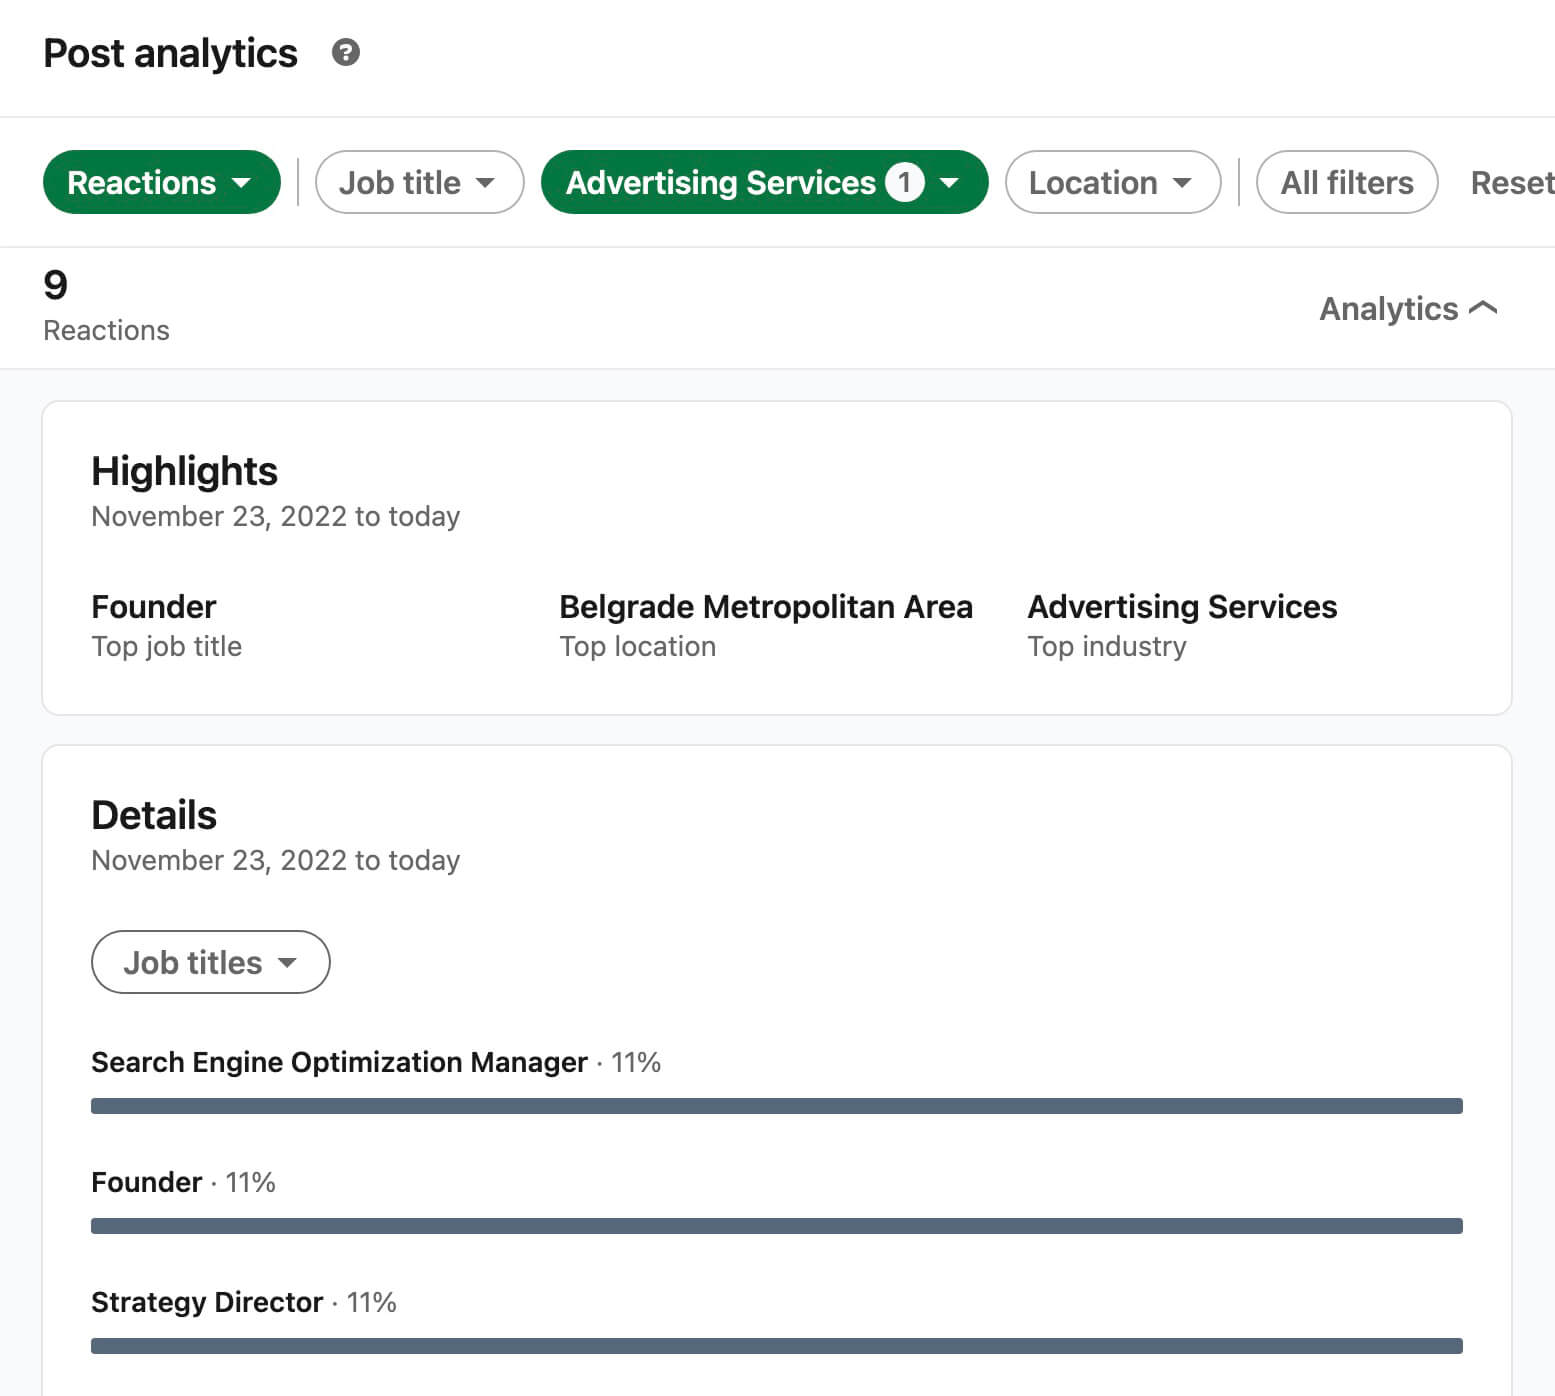
If your content generated a lot of engagement, you’ll also find LinkedIn’s filter options helpful. On the Post Analytics panel, select any demographic to zero in on various job titles, industries, or locations.
Then use the Details drop-down to select a demographic or type of engagement. Now you can drill down and see what kinds of users are engaging with your content and begin to brainstorm better ways to reach them.
Connect With Individual Engaged Users
The more filters you apply to the Post Analytics panel, the more you can learn about your audience. Want to find decision-makers who reacted to one of your top posts? Apply relevant filters and scroll down to the People Who Reacted list for the post.
You can click through to view each user’s LinkedIn profile and take steps to forge a relationship. From there, you can follow them, request a connection, or engage with the content they’ve posted.
Improve Your Content Strategy
LinkedIn’s Creator Analytics tools give you tons of helpful data. But they won’t tell you exactly how to improve your content or reach your audience more reliably. As you review your audience and content analytics, plan to devote some time to analyzing the data and developing an actionable plan.
To start, answer some questions about your most engaging posts:
- What demographic(s) did you most want to reach? What kinds of posts connected best with these groups?
- Which post formats performed best with your target audience? Did they prefer link shares, text posts, videos, documents, or something else?
- Which posts generated the most valuable engagement? Did you ask leading questions or simply share something interesting or surprising?
- What topics tended to drive the most engagement and impressions? How do they align with your target audience’s interests?
- Did your top-performing posts focus on your own original content or thought leadership? Or were they shares from industry figures and peers?
Now you can create a framework for developing more engaging content and avoid spending time publishing content that hasn’t worked in the past. But don’t get stuck in a content rut. It’s also helpful to brainstorm ideas for new topics and formats so you can continue publishing content that resonates with your LinkedIn audience.
#4: Export and Analyze LinkedIn Insights
LinkedIn’s Creator Analytics interface has several positive aspects. The charts and graphs are great for visualizing results and identifying patterns. Plus the Posts and Audience panels both automatically display comparative analytics to provide more helpful insights.
Yet LinkedIn’s native interface also has some downsides. It doesn’t allow you to choose custom timeframes, which means you’re stuck reviewing preset periods like the previous week, month, or quarter only. The Analytics interface doesn’t support custom sorting or filtering either, which can make it difficult to dig deeper into your data.
How to Download LinkedIn Creator Analytics
Fortunately, you can now download LinkedIn Creator Analytics by tapping or clicking the Export button in the upper-right corner of the interface. Both the mobile app and the desktop version support analytics downloads.
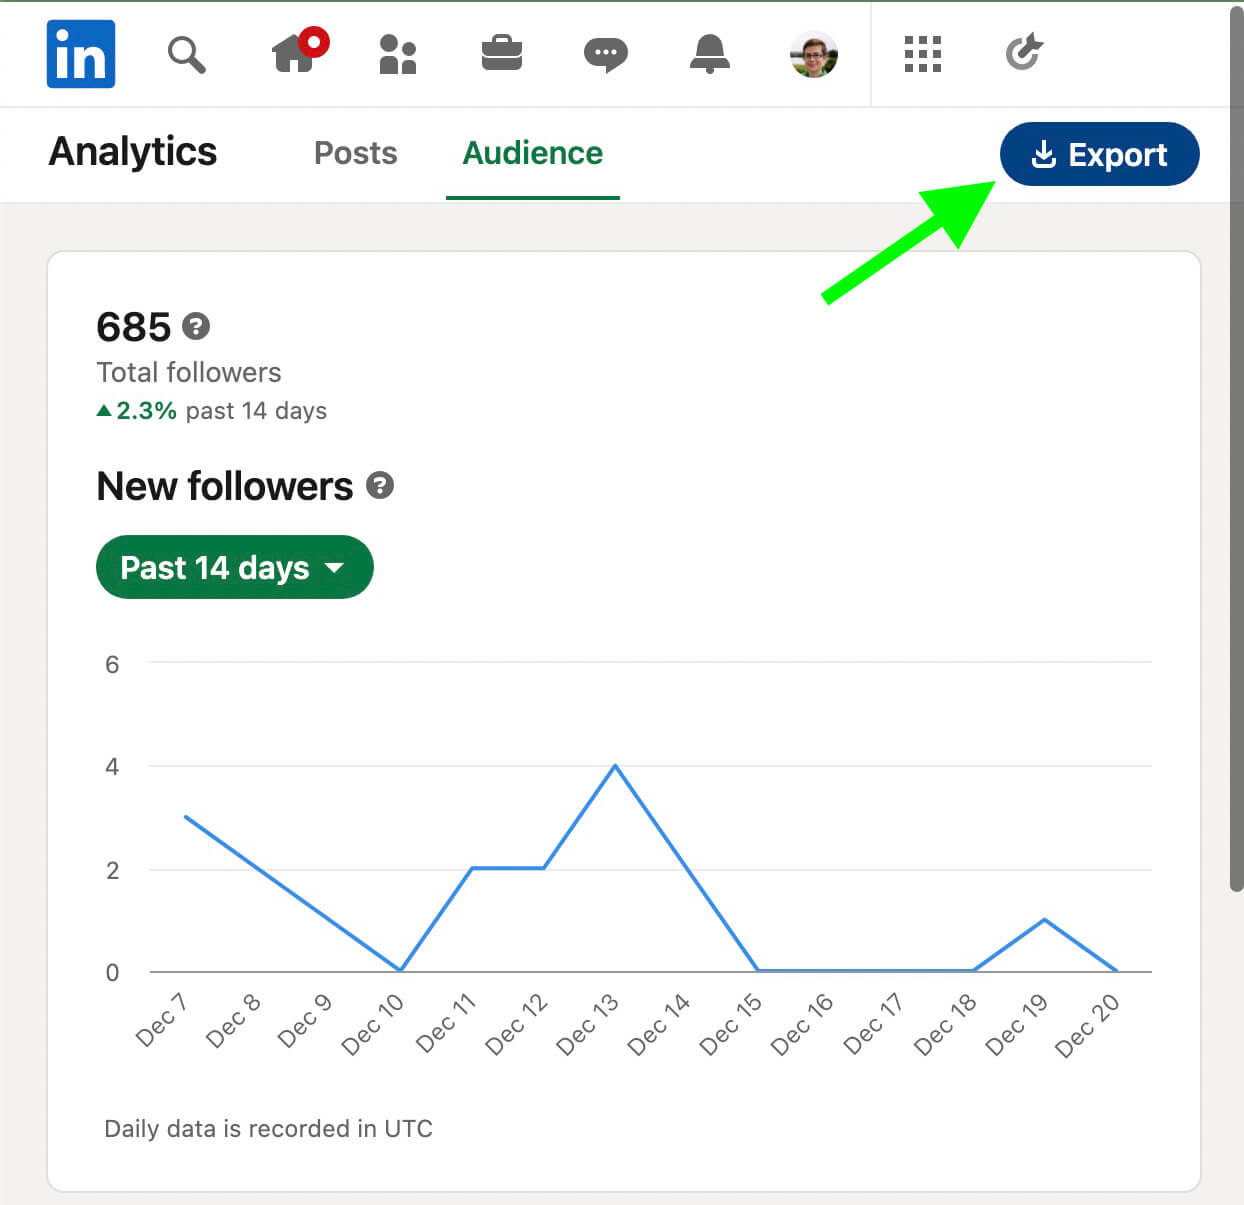
Note that you only need to export creator analytics a single time for a given time period. When you press the Export button, you automatically download both Post and Audience analytics for the selected timeframe.
Similar to company page analytics, LinkedIn only provides XLS file exports for Creator Analytics. That means exports don’t include the charts, graphs, or comparative data that the native interface displays.
How to Use Exported Creator Analytics
XLS files do however make it easier to analyze the data in spreadsheet apps like Google Sheets. For example, you can use these apps to isolate data from certain time periods or sort by the metrics that matter most to you.
In addition, you can use spreadsheet apps to create custom charts that highlight key metrics like impressions, reactions, or comments. With these added visualizations, you can better understand your data and identify trends.
If you use reporting tools that support Google Sheets integrations, you can also upload your LinkedIn Creator Analytics to third-party programs. Then you can include LinkedIn Creator Analytics in your standard weekly or monthly reports and take smarter steps toward reaching your goals.
Conclusion
LinkedIn’s updated Creator Analytics offers professionals increasingly helpful ways to evaluate performance and gain insights. With this data, you can better understand content performance and audience engagement so you can improve your strategy and make measurable progress toward your marketing goals.
Stay Up-to-Date: Get New Marketing Articles Delivered to You!
Don't miss out on upcoming social media marketing insights and strategies! Sign up to receive notifications when we publish new articles on Social Media Examiner. Our expertly crafted content will help you stay ahead of the curve and drive results for your business. Click the link below to sign up now and receive our annual report!

Curious About How to Use AI?
Our newest show, AI Explored, might be just what you're looking for. It's for marketers, creators, and entrepreneurs who want to understand how to use AI in their business.
It's hosted by Michael Stelzner and explores this exciting new frontier in easy-to-understand terms.
Pull up your favorite podcast app and search for AI Explored. Or click the button below for more information.
