Do you want to improve your organic Facebook activities? Are you taking advantage of Facebook Insights across Business Suite, Creator Studio, and your Facebook page?
In this article, you'll discover how to analyze your results and use your findings to improve your organic Facebook strategy.
#1: Facebook Business Suite Insights
Although Facebook Business Suite launched in September 2020, access to the platform is still gradually rolling out. Even if you don't have full Business Suite access yet, you can still use the platform's analytics tool via a desktop browser or the mobile app.
To access the desktop version, navigate to Facebook's business portal and select Insights from the menu. To access the mobile version, open the Business Suite app, tap the menu in the lower right, and select Insights.
Both versions automatically display analytics for both your Facebook page and your linked Instagram business account. For our purposes, we'll focus on Facebook Insights only.

Results Report
Are you curious how many people have seen your posts? The Results tab shows the total reach for your Facebook page, including how much this metric has increased or decreased compared to the previous time period. You can hover over any date to see daily reach metrics.
This report is essential for making sure your page is on the right track. For example, you can easily see if your reach has decreased or if it fell short of the goals your team set. You can also pinpoint days when reach was particularly high or low to understand audience behavior patterns.

Does reach tend to be highest on certain days of the week? You may want to focus on posting great content and cultivating engagement on days you're likely to achieve maximum reach.
It's important to note that the Business Suite Insights tool automatically incorporates reach from your paid campaigns, too. That means you'll need to factor in sponsored content and ad campaigns when gleaning insights from this report.
Content Report
The Content tab gives you more control over the metrics you see. For example, you can click the drop-down menu in the upper-right corner and select organic Facebook posts only. Then you can sort the columns by reach, reactions, comments, shares, or date to review key metrics.
Sort by reach to see which posts contributed most to brand awareness or sort by engagement to see the posts that drove consideration. Review the top-performing posts to get a better sense of the factors that amplified performance. Then keep those factors in mind when you brainstorm content for upcoming campaigns.

For example, you might find that user-generated content tends to excel at driving brand awareness. Along the same lines, you might notice that asking questions or requesting feedback in your post captions generates tons of engagement.
Audience Report
To get to know your followers better, navigate to your page's Audience report. Check the Current Audience tab for an age and gender breakdown along with a list of your audience's top cities and countries.
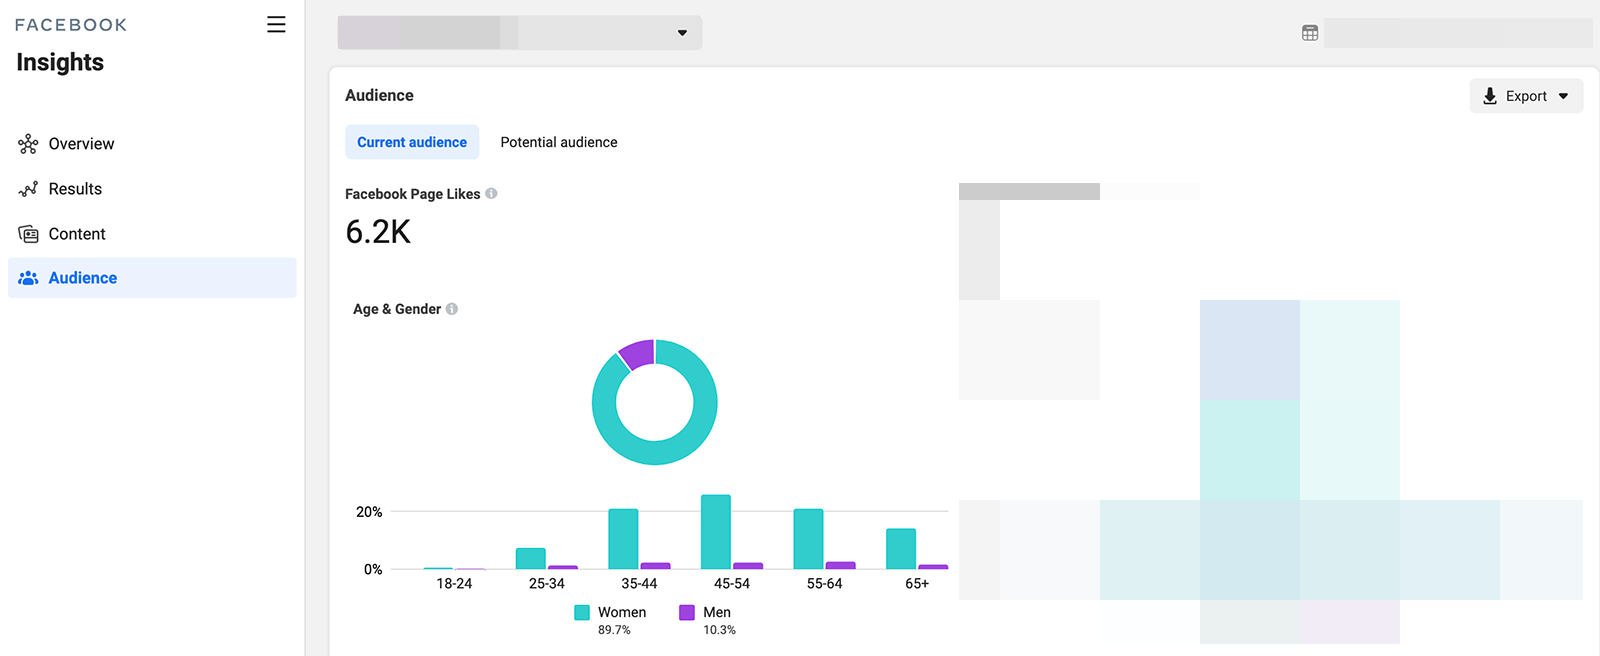
The more you know about your followers, the more you can create content that resonates with them. For example, you can use the age and gender data to shape the tone of your posts and the types of questions you ask. And the location data can help you create content that helps followers find and use your products and services effectively.
Get World-Class Marketing Training — All Year Long!
Are you facing doubt, uncertainty, or overwhelm? The Social Media Marketing Society can help.
Each month, you’ll receive training from trusted marketing experts, covering everything from AI to organic social marketing. When you join, you’ll also get immediate access to:
- A library of 100+ marketing trainings
- A community of like-minded marketers
- Monthly online community meetups
- Relevant news and trends updates
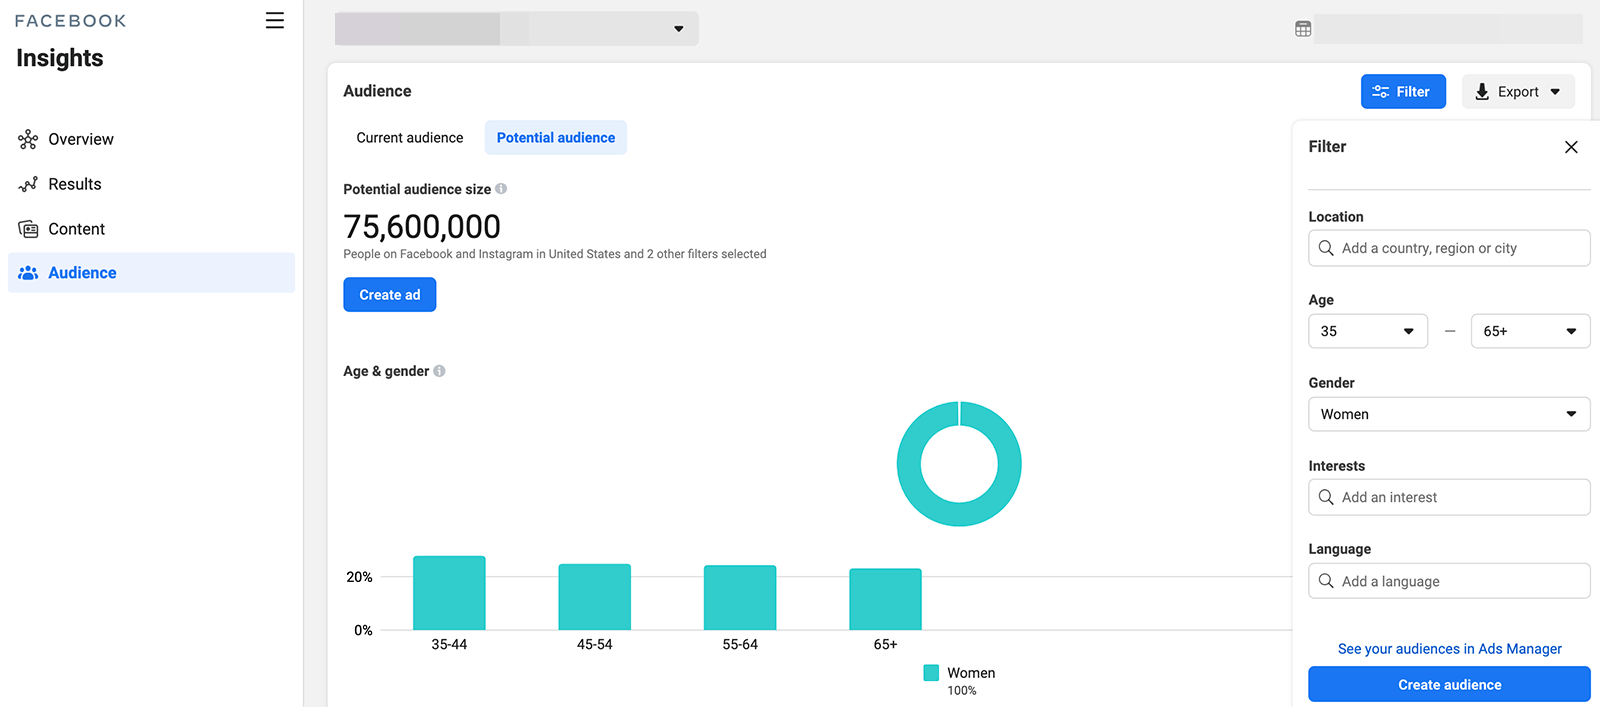
To learn more about the customers you could reach on Facebook, click the Potential Audience tab. Click Filter in the upper-right corner and enter some of your audience demographics. Then experiment with adding different interests to gauge the size of your potential audience. You can click the blue Create Audience button to add the targeting parameters to saved audiences in Ads Manager.
#2: Facebook Creator Studio Insights
Although Creator Studio launched only about 6 months before Facebook began rolling out Business Suite, Creator Studio is much more widely available. If you have a Facebook page for your business, you can use the Creator Studio desktop site or mobile app for content planning, scheduling, and analytics.
So what's the difference between the two tools? Creator Studio provides more in-depth analytics and video-focused insights for your Facebook page and linked Instagram business account. That means you can gather even more useful insights from this data.
Page Overview
Creator Studio's Page Overview tab looks similar to Business Suite's Results report, at least at first glance. You can see cumulative reach for any time period or hover over the graph to see metrics for any specific day.
But Creator Studio enhances and simplifies comparative data. The graph includes lines for both the current and comparative time periods so you can see how performance has changed. Hover over any day, and you can instantly see reach metrics for that day and the previous time period.
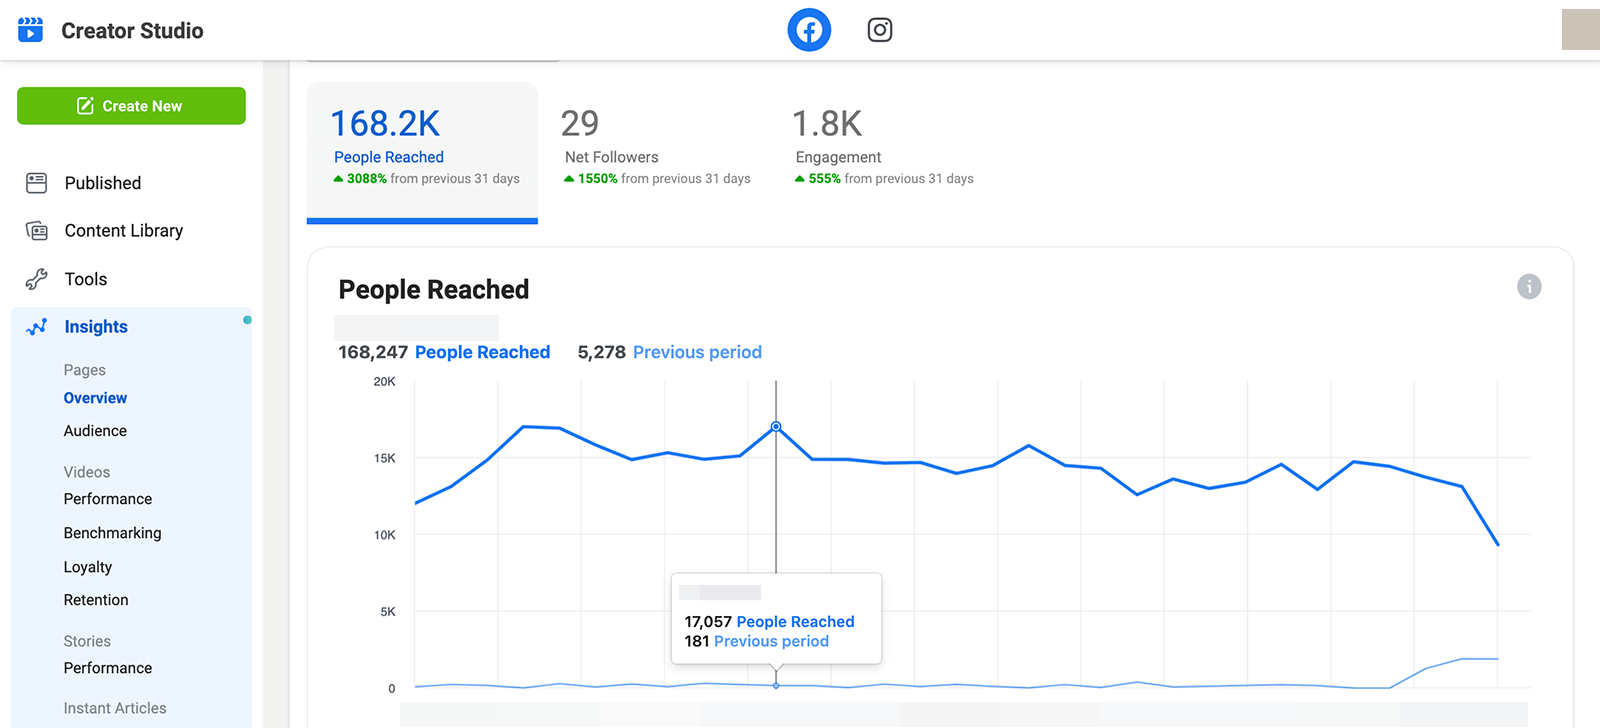
You can use this data to get a more nuanced look at your page's performance. Are you steadily connecting with more Facebook users week over week or is reach declining? To improve performance, you may need to dig deeper into your content analytics or consider supplementing your organic strategy with paid posts.
To get a better sense of how and when your audience responds to your content, check the Engagement tab of your Overview report. Similar to the Reach tab, the Engagement tab shows daily and cumulative data so you can pinpoint good and bad days and compare performance over time.
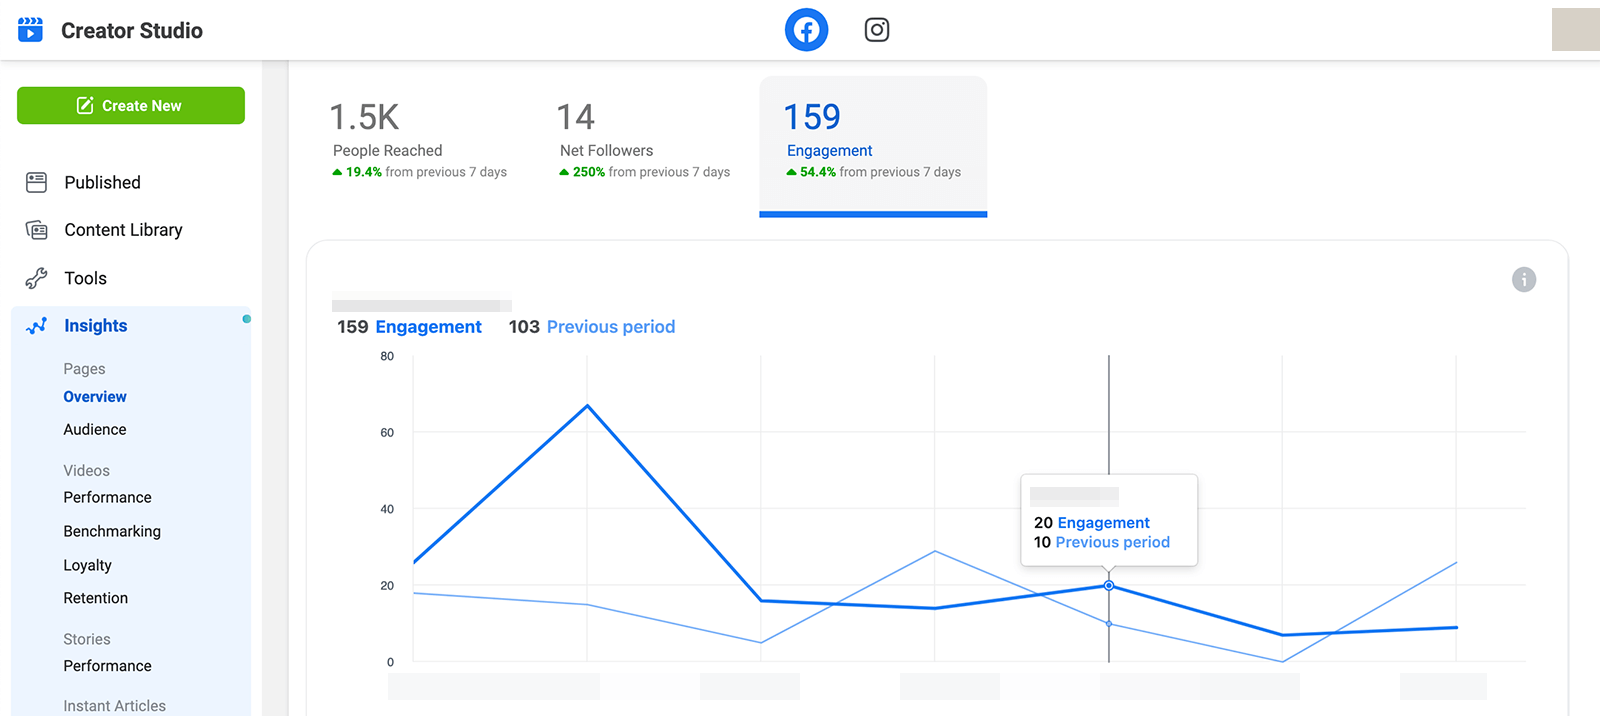
Creator Studio also tracks audience growth so you can see when your business gained or lost the most followers. Use these metrics to understand what drives Facebook users to like or unlike your business.
Creator Studio won't tell you exactly what prompted each follow so you'll have to do additional research using your page's activity, your content calendar, or a social listening tool. For example, a mention by an influencer or another brand may generate follows, while a controversial post or excessive posting may lead to unlikes.
Audience Analytics
For more insight into your page's followers, check the Audience tab and click Total Followers. Like Business Suite, Creator Studio provides age, gender, and location data.
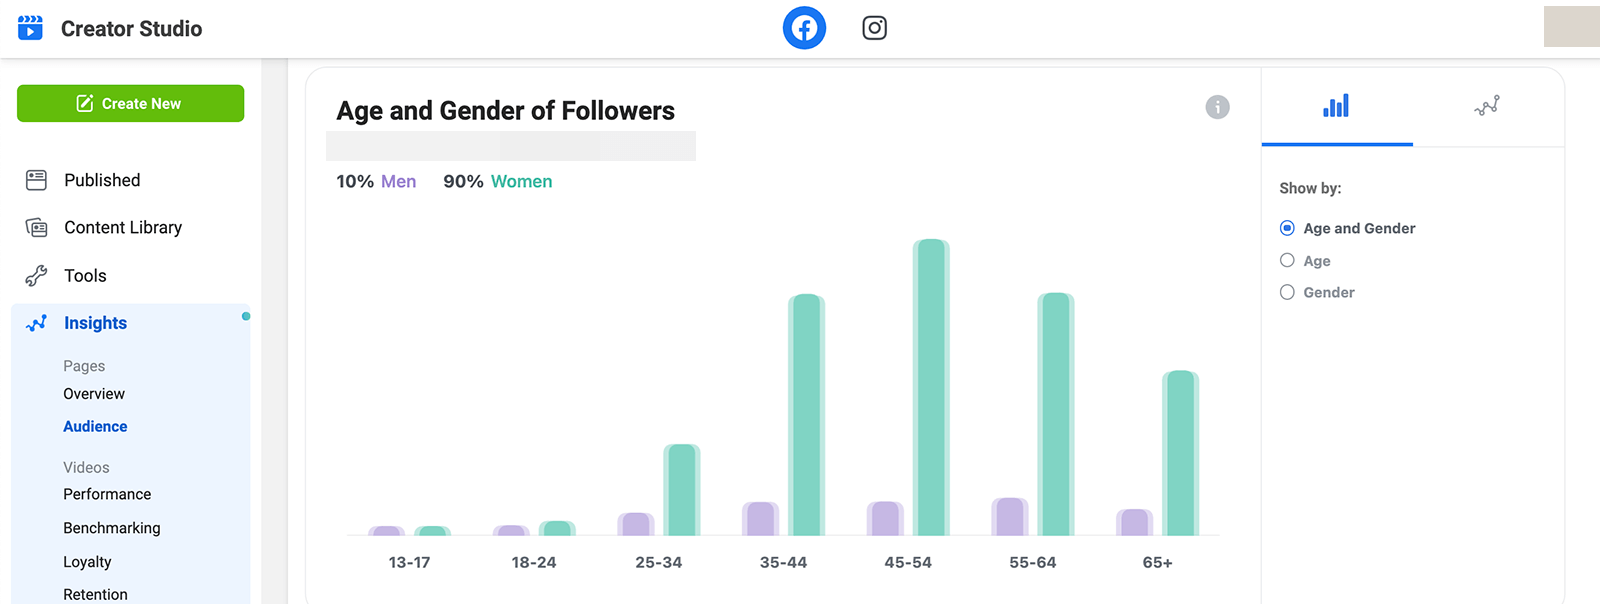
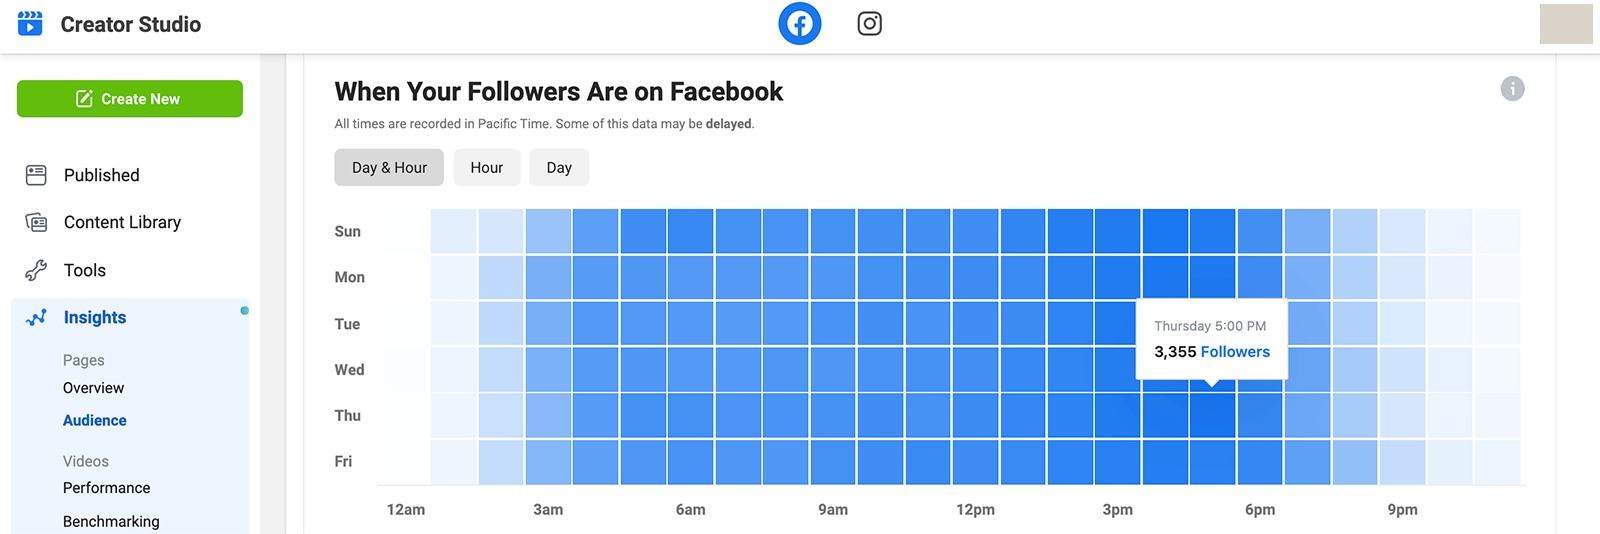
Keep scrolling, and you'll find much more information about your audience. For example, you can see the day and time your followers are most likely to use Facebook, including a color-coded hourly breakdown. Use this data to find the best times to post or schedule content for your page.
Video Insights
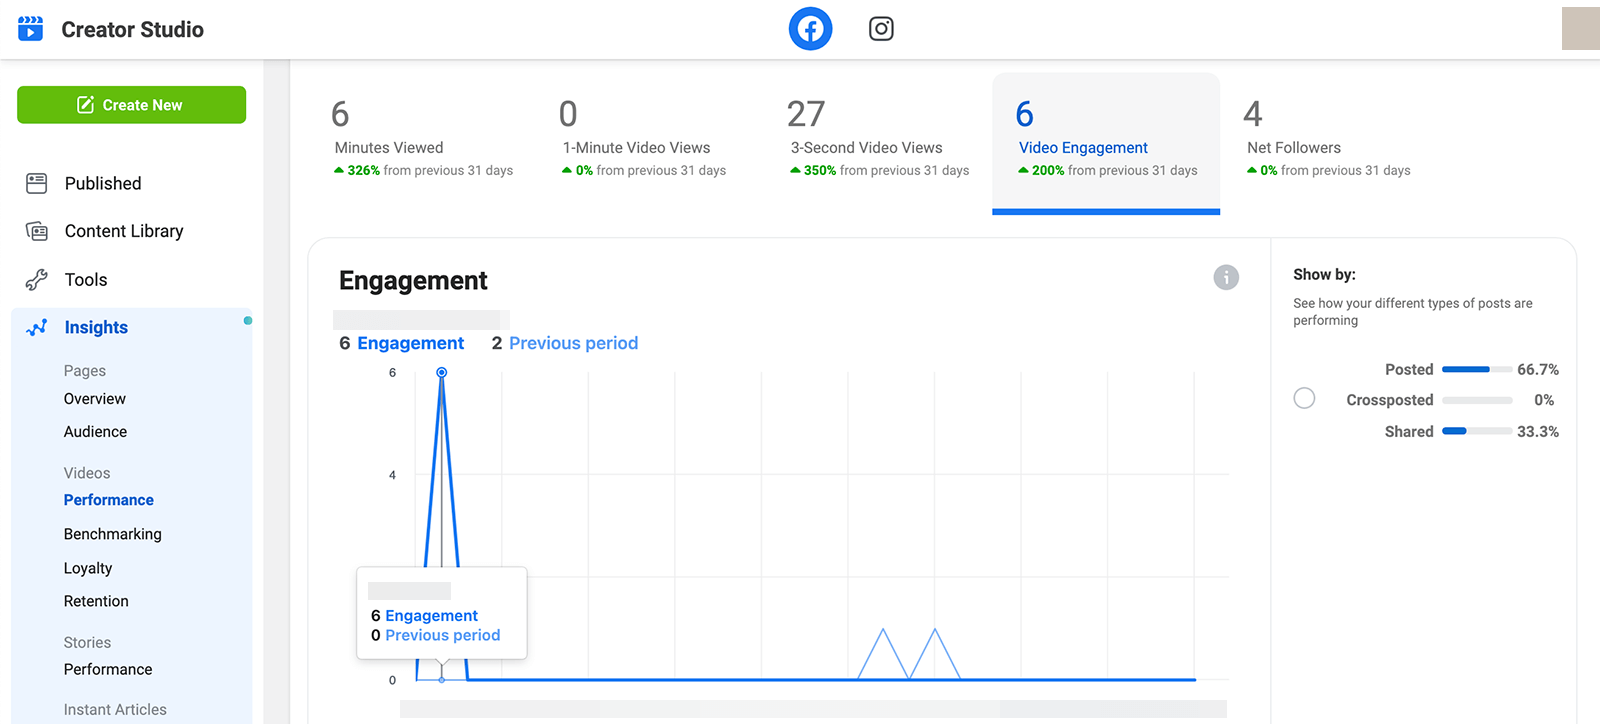
If you use native video to achieve your Facebook marketing goals, then you'll appreciate Creator Studio's extensive video metrics. Under Video reports, select the Performance tab to see the total number of minutes viewed, 1-minute video views, and 3-second video views. Hover over any day to see comparative metrics and get a better sense of how your page's video performance has changed over time.
You can also check the Video Engagement tab to compare likes and comments over time. Scroll to the bottom of the report to see top videos for the time frame. Use this data to pinpoint your top-performing videos and make more in the same style or on similar topics in the future.

Discover Proven Marketing Strategies and Tips
Want to go even deeper with your marketing? Check out the Social Media Marketing Podcast! Publishing weekly since 2012, the Social Media Marketing Podcast helps you navigate the constantly changing marketing jungle, with expert interviews from marketing pros.
But don’t let the name fool you. This show is about a lot more than just social media marketing. With over 600 episodes and millions of downloads each year, this show has been a trusted source for marketers for well over a decade.
Click the Benchmarking tab to compare your page against peers in your category. You can see how your page compares in terms of watch times and engagement and use this data to inform your video strategy. For example, if you rank behind other pages in your category, you may want to consider publishing more videos or creating more of the video content that has historically driven engagement for your page.

On the Loyalty and Retention tabs, Creator Studio reveals how many viewers return to see more and how long they consume your page's video content. The Retention report is particularly helpful for understanding how viewers find you and how long they stick around. For example, if you learn that shares have driven the most views, you may want to test various ways to get viewers to share your videos more often.
Story Performance
Have you published Facebook stories or shared story content from Instagram? Creator Studio provides story performance metrics but only for a limited time. Check this report regularly because the data is only available for the previous 28 days.
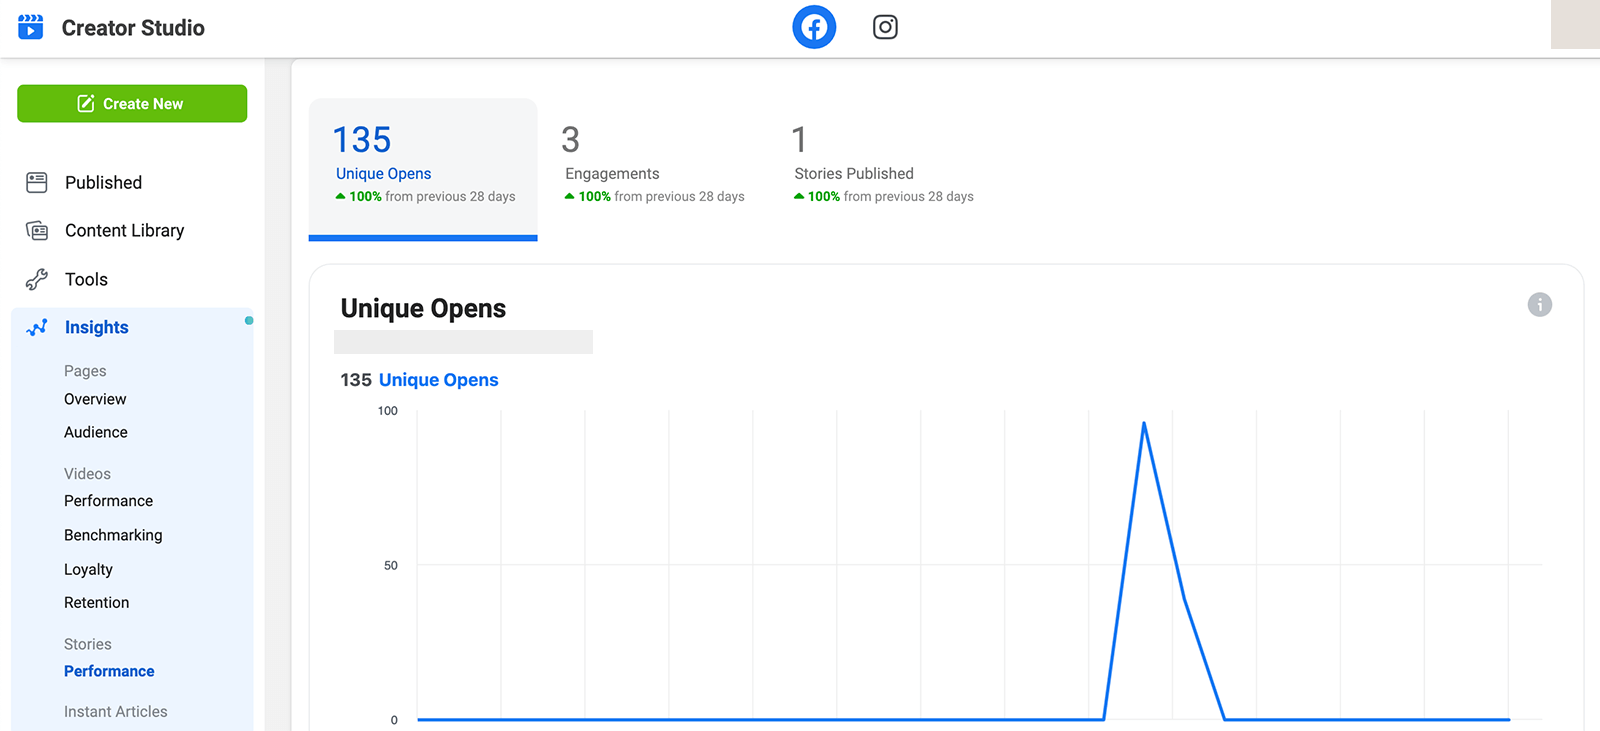
Using Creator Studio's Story report, you can view open and engagement analytics, including comparative metrics. This report only shows daily metrics but you can see individual story reports on the Published tab.
Content Insights
To assess post performance, open the Published tab in Creator Studio and select the type of content you want to evaluate—including photos, links, text, videos, and stories. Then scroll right to see impression, engagement, and link click metrics for each individual post.
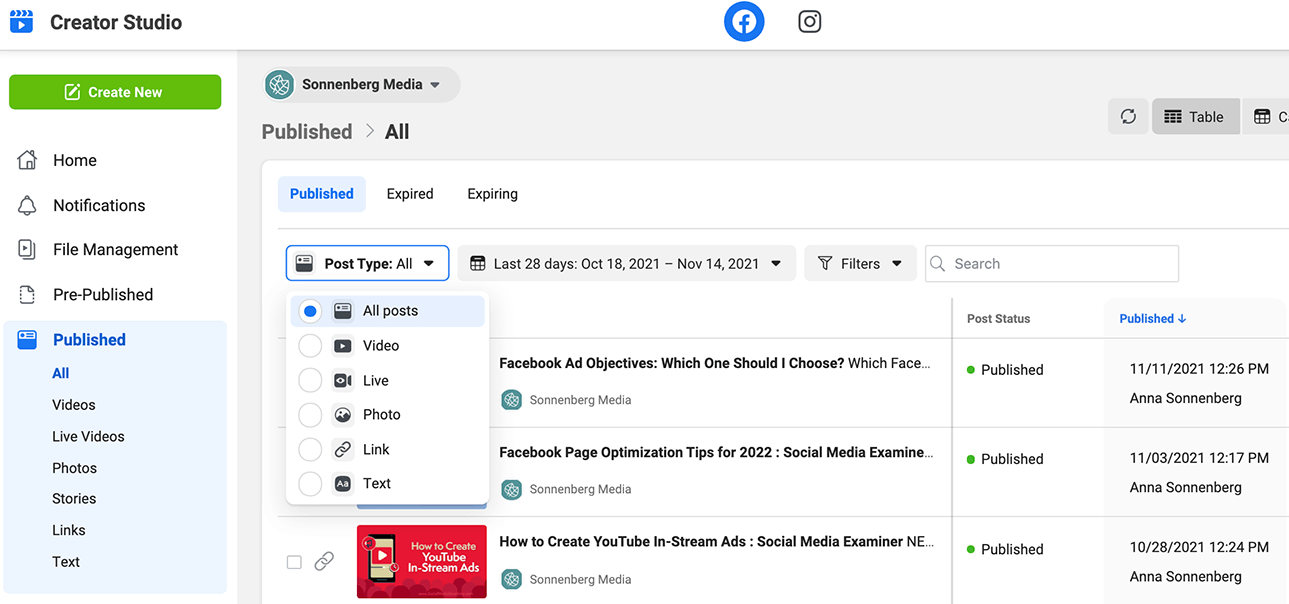
Click any post to see a complete list of insights, including reach, engagement, clicks, and negative feedback. Use this data to understand what works best for your audience and what causes followers to hide your content from their news feeds. Then use your analysis to plan content that's more likely to help you reach your goals.
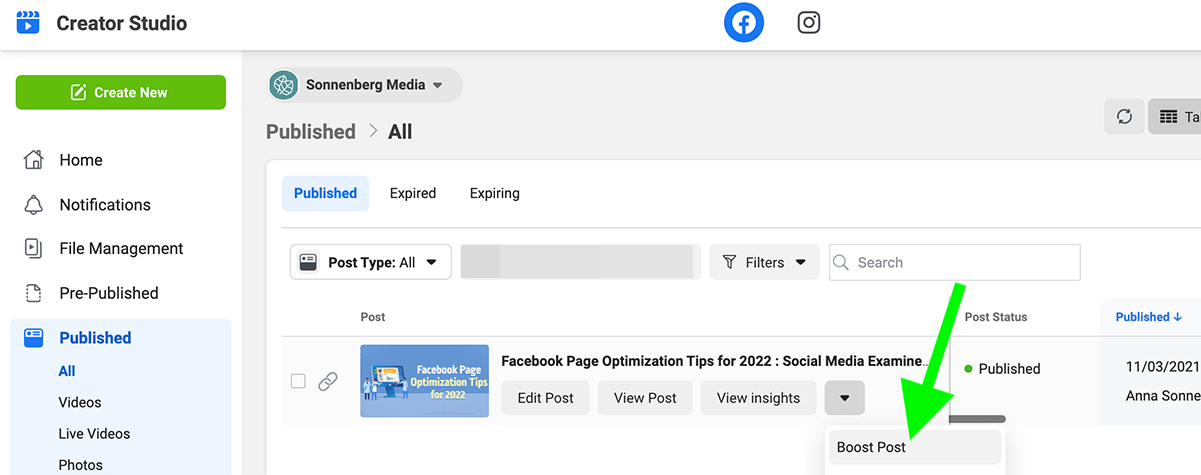
Do you want to get more traction from your top-performing posts? You can click to boost any published post directly from Creator Studio.
#3: Facebook Page Insights
If you're used to relying on Facebook's Page Insights tool, you can still use it to access analytics as of November 2021. But when you open your page in Business Manager and navigate to Page Insights, you'll get prompts to try both Business Suite Insights and Creator Studio Insights instead—suggesting that this older tool may be transformed or phased out in the future.
As of November 2021, Page Insights still offers data on page performance, going way beyond content and audience metrics. If you want more data on the actions visitors have taken on your page, you'll find tons of insights here.

People Reports
At first glance, the audience reports you can access in Page Insights look similar to those from Creator Studio. But Page Insights offers much more detailed data on the tool's People tab.
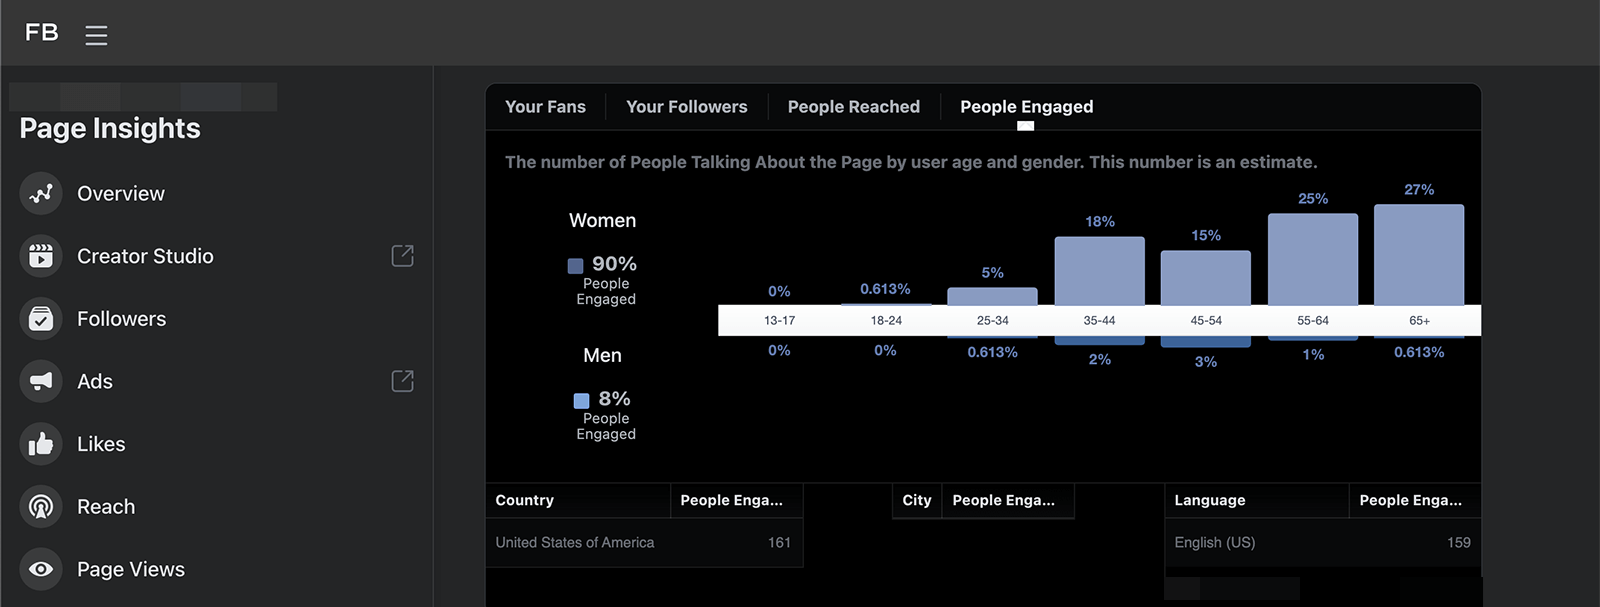
In addition to providing demographic data for your fans and followers, Page Insights analyzes the people your content has reached and the users who have engaged with your posts. Use the People Engaged report to see who's responding to your content—and keep these demographics in mind as you brainstorm more posts and campaigns.
Page Actions and Views
Are you curious what people are doing on your page? Select the Actions on Page tab to see when visitors took steps like clicking through to your website and clicking your call to action (CTA) button. Scroll down and you can even see an age and gender, location, or device breakdown for each action.

Select the Page Views tab to learn more about what people saw when they visited your page. You can check whether they read reviews, viewed posts, browsed photos, or read your About page. You can see a demographic and device breakdown for each section.
These insights can give you a better sense of the information people want about your business and the ways they prefer to contact you. You can use them to set up your page more effectively and guide followers toward more helpful content. For example, if you learn that users tend to head straight for the review section, you may want to encourage customers to leave feedback so you can keep your reviews fresh.

Page Likes and Followers
Whether you track likes (people who are fans of your page) or followers (people who see your content in their news feeds), you can monitor both with Page Insights. In addition to showing your total audience size over time, this tool indicates when your page gained or lost likes and followers, and whether they were organic or paid.

Page Insights also helps you understand how your page acquired new followers or likes. For example, on-page content or page suggestions may have helped you grow your audience more than other tactics.

Post Reach
In addition to showing your page's total reach, Page Insights breaks down total engagement per day. That way, you can see when your audience is most likely to react, comment, or share and get a sense of how these different actions compare.

Page Insights also shows a daily breakdown of negative feedback. You can see when Facebook users hid your posts, unliked your page, or reported your content as spam. Keep an eye on this negative feedback tracker to determine what not to do when publishing content.
Post Engagement
For content analytics, click the Posts tab. You can see the average reach and engagement for each post type and identify the type of content your audience responds to best including photos, videos, and links.
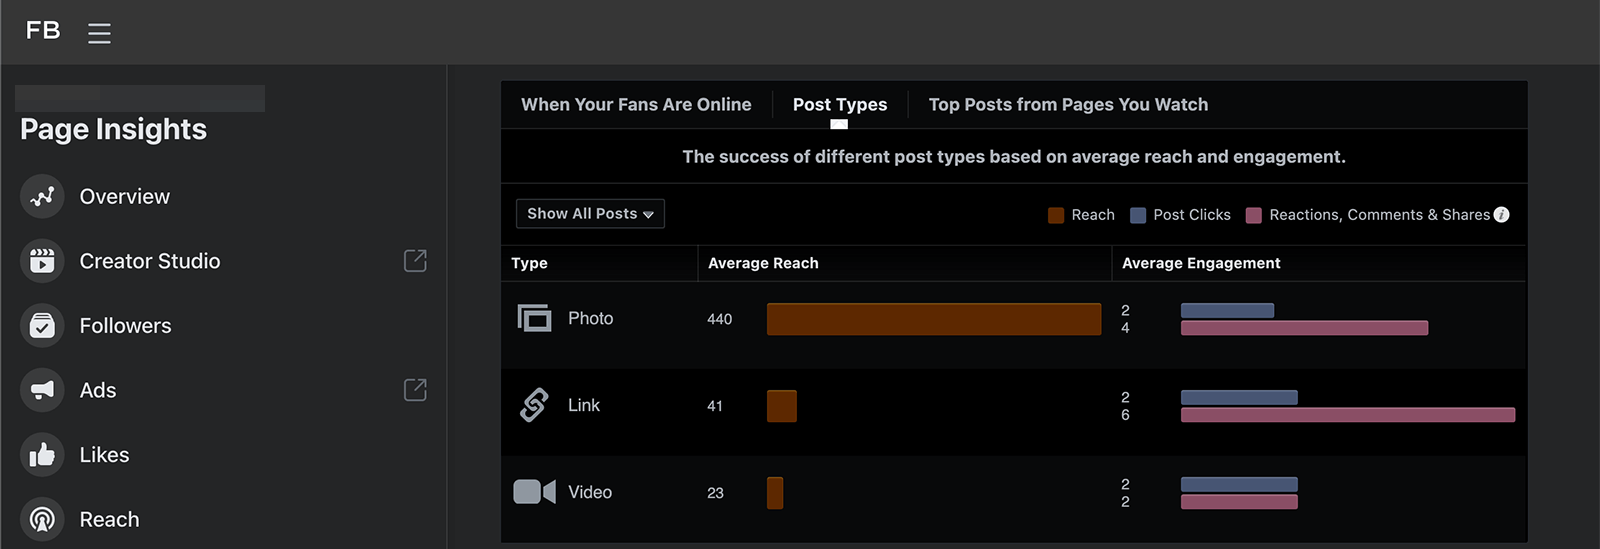
You can also click to see metrics for each individual post. Similar to Creator Studio, Page Insights shows engagement, reach, clicks, and negative feedback for every piece of content you publish.
For video and story metrics, you can access more in-depth reports. Click the Video tab to see how many minutes your page's videos tallied and identify top-performing videos.
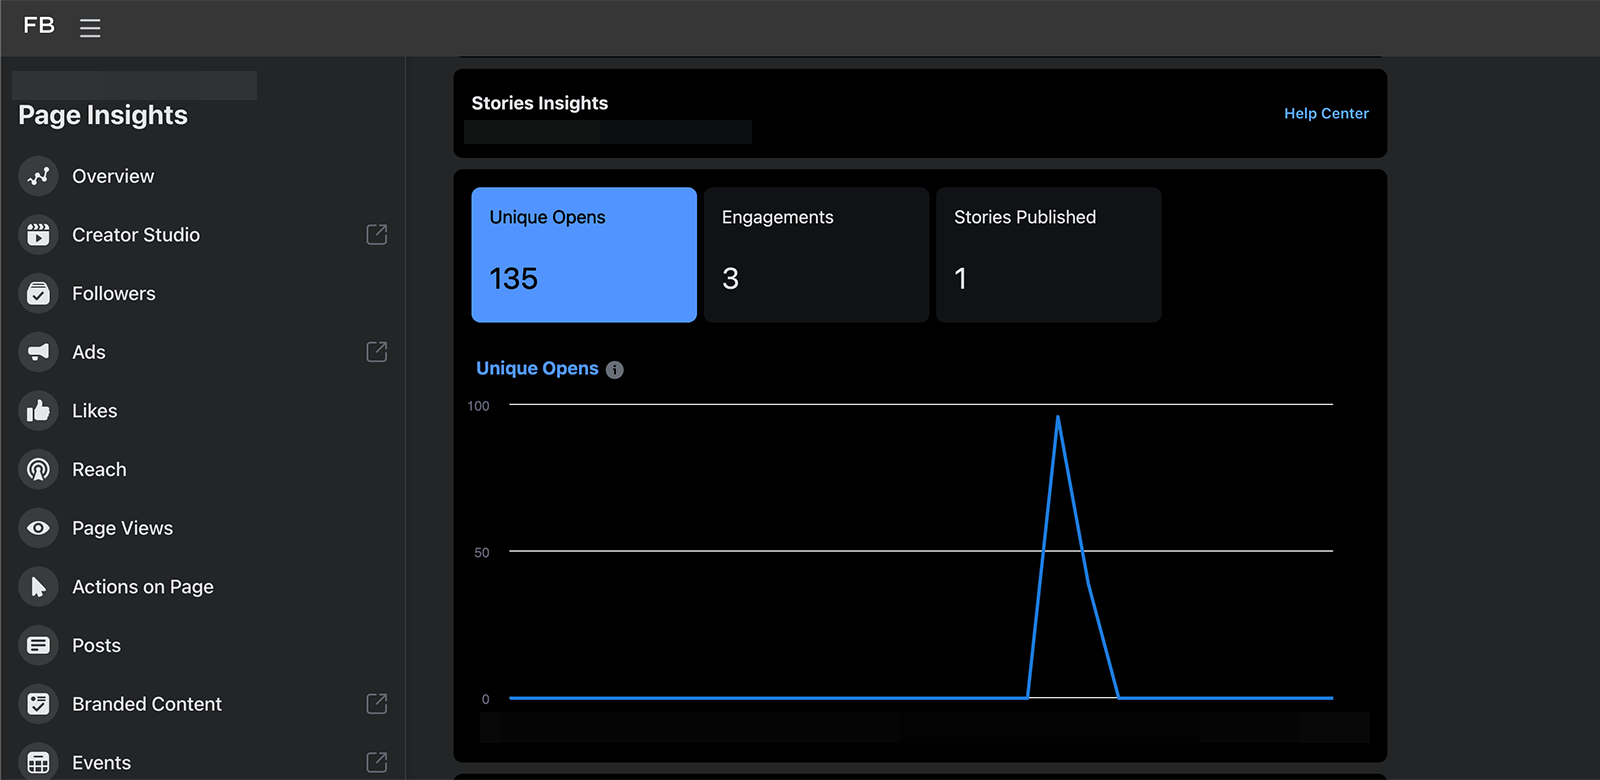
Navigate to the Stories tab to see a daily breakdown of opens and engagement. You can also see audience demographics for your stories to better understand who's engaging with your ephemeral content.
Conclusion
With so many native Facebook insights tools to choose from, it isn't always easy to know which one can answer your questions. Whether you need one, two, or all three, make sure you're using the right tool for your business so you get the analytics you need to keep improving your Facebook marketing strategy.
Get More Advice on Facebook Marketing
- Optimize your Facebook page for 2022.
- Split test your Facebook organic content.
- Improve your Facebook organic reach with a three-step system.
Attention Agency Owners, Brand Marketers, and Consultants

Introducing the Marketing Agency Show–our newest podcast designed to explore the struggles of agency marketers.
Join show host and agency owner, Brooke Sellas, as she interviews agency marketers and digs deep into their biggest challenges. Explore topics like navigating rough economic times, leveraging AI, service diversification, client acquisition, and much more.
Just pull up your favorite podcast app, search for Marketing Agency Show and start listening. Or click the button below for more information.

