 Are your social media marketing efforts working?
Wondering which key performance indicators (KPIs) matter on each platform?
In addition to revenue, there is real value in knowing how many people engage with your social media posts.
In this article, you'll discover which KPIs to track for Twitter, Facebook, LinkedIn, and Instagram.
#1: Delve Into Twitter Analytics
Twitter provides some interesting statistics in the Analytics dashboard. On the Home tab, you'll find performance numbers for the last 28 days, as well as your top tweets.
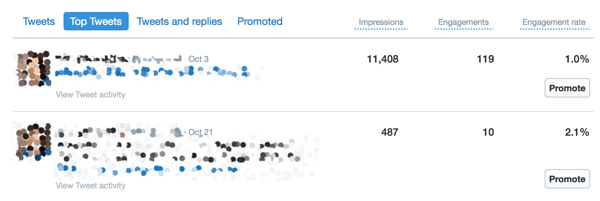
If you dig deeper into your tweets on the Tweets tab, you can see how well people are engaging with your content. View a list of your most recent tweets along with numbers on impressions, engagements, and engagement rates.
Impressions
Impressions is the number of people who have seen your tweets. That doesn't mean people actually read them; they may have simply scrolled past them. For this reason, impressions is just a vanity metric.
Engagement
The engagements and engagement rates are what matter. These happen when people click on, favorite, retweet, or reply to your tweets. You can see your 28-day average and compare that against individual tweets to find the best ones.
Consider setting KPIs for increasing your engagement rates. Pick the tweets that perform well and then try to duplicate their success. The graph in your dashboard will show if you're heading in the right direction.
You may notice that engagement is higher during certain times of the day or days of the week. Take this information into account and tweak your posting schedule accordingly.
Audiences
Which AI Moves Actually Matter?
That's what every marketer is wrestling with now. New AI strategies, new tools, new takes every week — but no clarity. Most marketers and business owners are trying to figure out AI alone.The AI Business Society is your trusted guide. Get expert-led training you can put to work immediately. Plus a community of marketers sharing what's actually working.
I'M READY FOR REAL AI RESULTSGo to the Audiences tab to find out more about your followers. You can see a breakdown by interests, buying style, household income, and net worth.
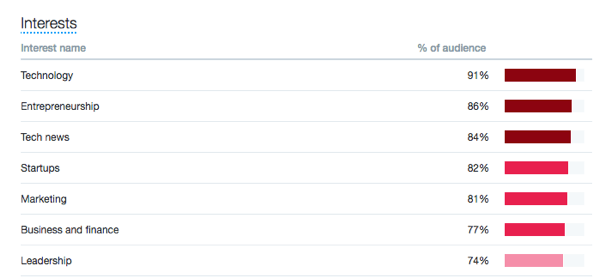
It's important that you're reaching your target audience. If you aren't, set KPIs for targeting the right people and getting your audience where you want it to be.
#2: Discover What's Working on Facebook
Facebook pages provide some incredibly detailed analytics. To access this data, log in as a business manager of the page and head to the Insights tab.
Right away, you'll see a dashboard of important metrics. Two of the most important are Actions on Page (the number of times people have clicked a call to action on the page) and Post Engagements (the number of times people have liked, commented on, and shared your posts).
The metrics Reach, Page Views, and Page Likes are meaningless if no one is engaging with you or taking action on your page.
Post Engagement
Your primary KPI should be to increase post engagements and actions on your page. Look through your previous posts to find those that have performed well and try to duplicate their success.
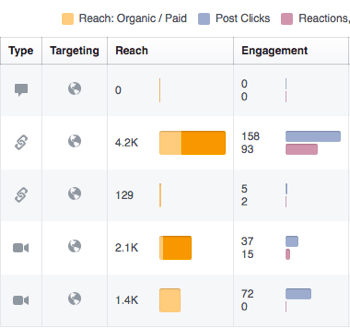
Facebook categorizes post types as Video, Photo, Link, or Status, and shows engagement data by category.
Competitor Tracking
Another interesting Facebook analytics feature is the ability to track competitors. Facebook will provide engagement performance for any other pages you choose to watch. This information helps you set industry-standard benchmarks and targets. You can also view your competitors' top-performing posts if you're looking for content ideas.
Actions on Page
The Actions on Page report drills down into who clicked on links in your page, such as your website. You can track the overall growth, plus see a breakdown by location, device, age, and gender.
Pair the Actions on Page report with the Page Views report to determine if page visitors are converting. You can see the source of your views and break them down.
You may find that page views are increasing but actions aren't, in which case you'd need to work on making your content more compelling.
3 Days of World-Class Training—Zero Travel!

Couldn't make it to Social Media Marketing World and AI Business World this year? Get all of the great content at a fraction of the price with a Virtual ticket.
That’s full access to recordings of every keynote, workshop, and session—the ones people travel thousands of miles to see. Don't wait. Get your Virtual ticket and enjoy actionable content that you can watch anytime, anywhere.
#3: Review Key LinkedIn Metrics
LinkedIn company page analytics may not be the most in-depth, but there's enough good data for you to set some real KPIs. LinkedIn breaks down the data into three sections: Updates, Followers, and Visitors.
Updates
Updates is where you can determine how well your posts are performing. View data on impressions, clicks, interactions, followers acquired, and engagement. LinkedIn also displays the data as a graph to show trends over time.
The engagement rate is what you should focus on. It represents the total number of clicks, interactions, and followers your post received divided by total impressions.
Set KPIs around the engagement rate and try to replicate the success of your most popular posts to keep increasing that number. The graph will show you if you're moving in the right direction over time.
Followers
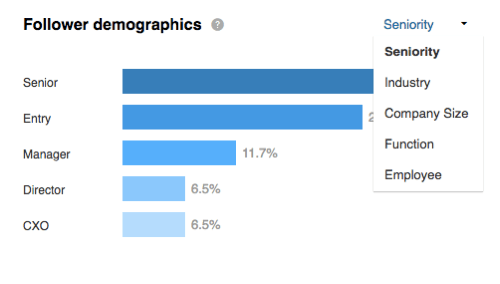
The Followers section reveals how you acquired your page followers. You can also view demographics and follower trends.
The demographics data is especially useful for B2B because you can view follower data by seniority, industry, company size, and function. This information helps you determine if you're attracting the right people.
To set realistic benchmarks, LinkedIn lets you compare your performance to your competitors'.
Visitors
The Visitors report provides a demographic breakdown of who's looking at your company page. When you use this report in conjunction with the Followers report, you'll get a good idea of which segments are converting into followers. If those are the segments you want to target, set KPIs around increasing them.
LinkedIn's built-in analytics platform is not the best, so you may want to augment it with a tool like Simply Measured or Quintly.
#4: Analyze Instagram Performance
Instagram recently came out with their own built-in business analytics. It may not be as powerful as third-party tools like Keyhole and Sprout Social, but it does provide some interesting data on your followers and the best times to post.
It's no secret that Instagram usually has better engagement rates than other social media platforms, but that doesn't count for much if traffic isn't coming back to you.
Traffic
Because Instagram doesn't allow links within posts, engagement is defined as likes or comments and doesn't say anything about clicks back to your site. The only place you can link to your site is in your bio, so make the most of that link.
Best practices dictate using a custom tracking link in your bio, like Bit.ly or Google's UTM links. This way, you'll know if people are coming back to your site. You can even set up a custom landing page and track conversions through that.
Engagement and Demographics
Don't completely ignore your engagement and demographics data from Instagram. For example, the data about the location of your followers is valuable because it helps you know when to schedule your posts and reveals your most important geographic locations.
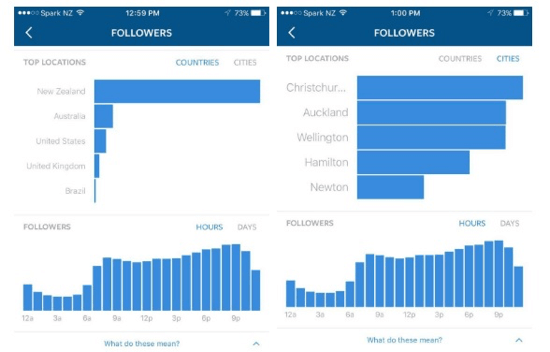
In your Instagram post analytics, find out when your followers are most active and which posts resonate best. This data helps you optimize your posts to grow your Instagram presence.
Conclusion
In a study of over 11 million user interactions on social media, Forrester found that businesses had an engagement rate of less than 0.2% across social networks, with Instagram being the exception. In other words, you may have a million followers, but fewer than 2,000 people interact with your posts.
These insights confirm that follower counts are just a vanity metric, and in this age of “always be helping,” you need to look deeper than that and set new KPIs.
The first step is to perform a social media audit to find out what's working and what isn't. Then you can start setting new objectives. Ultimately, you want to get to a place where you're reaching the right people and the right people are engaging with you. That means they're taking the desired action on your posts.
What do you think? Which KPIs do you focus on for Twitter, Facebook, LinkedIn, and Instagram? Please share your thoughts in the comments below.

Curious About How to Use AI?
Our newest show, AI Explored, might be just what you're looking for. It's for marketers, creators, and entrepreneurs who want to understand how to use AI in their business.
It's hosted by Michael Stelzner and explores this exciting new frontier in easy-to-understand terms.
Pull up your favorite podcast app and search for AI Explored. Or click the button below for more information.
