 Want a better way to report on and visualize your social media campaign data? Have you considered Google Data Studio?
In this article, you'll discover how to use Google Data Studio to create easy-to-update reports on your website, Facebook, or Instagram marketing.
#1: Import Data Sources Into Google Data Studio
Google Data Studio is a free tool that lets you import and visualize data to create stunning and insightful reports. You can share reports with clients and team members, and import data from multiple sources to gain a holistic, 360-degree view of your digital activities.
Google Data Studio works with different data sources such as Google Analytics; Facebook, Instagram, and Google ads; and any other source you can think of that offers data, making it essential for both small and large businesses.
The first thing you need to do is import your data into Google Data Studio.
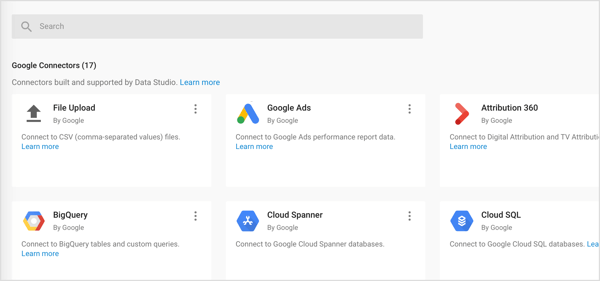
“Connectors” are the mechanisms through which the platform establishes connections to specific types of data (like Google Analytics). You can import three different types of connectors: Google Connectors, Partner Connectors, and Open Source Connectors.
Import Google Analytics Data
Because Google Analytics and Google Data Studio are both Google products, there's a seamless transfer of data from the source (Google Analytics) to the reporting platform (Google Data Studio).
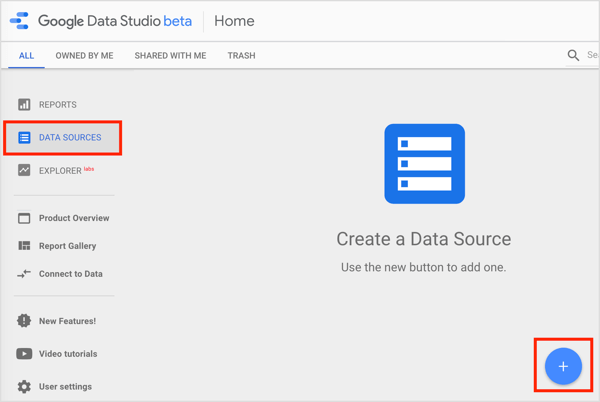
To access Google Analytics data from Google Data Studio, you need to create a data source with the desired data. To do this, open Google Data Studio, and on the left, click the Data Sources tab. Then click the + button on the right.
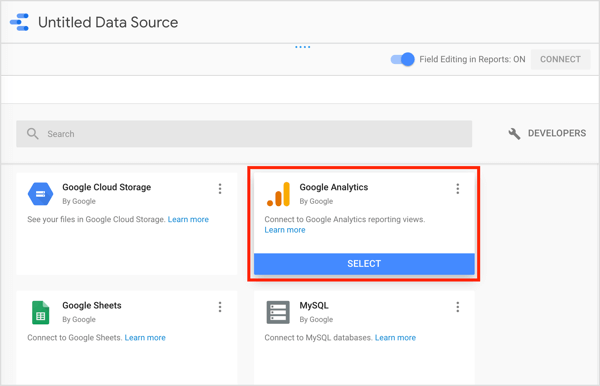
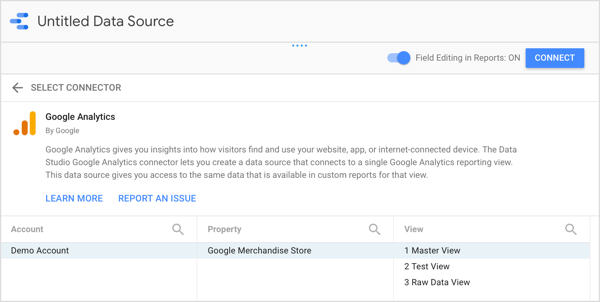
On the next page, scroll down and select Google Analytics.
Which AI Moves Actually Matter?
That's what every marketer is wrestling with now. New AI strategies, new tools, new takes every week — but no clarity. Most marketers and business owners are trying to figure out AI alone.The AI Business Society is your trusted guide. Get expert-led training you can put to work immediately. Plus a community of marketers sharing what's actually working.
I'M READY FOR REAL AI RESULTSThen choose the Google Analytics Account, Property, and View you want to use and click Connect.
After you click Connect, you see the fields panel, which contains the dimensions and metrics from your data source.
Import Facebook, Instagram and Other Non-Google Data
What happens when the information you're interested in comes from sources outside Google? That might be the case if you want to evaluate Facebook/Instagram ads or your Facebook page using Facebook Insights.
While Facebook isn't a Google property, it does allow you to export Facebook Insights data. You can then view Facebook analytics data in Google Sheets. Upload your Facebook data to Google Sheets, and then use the Google Sheets connector to import your Facebook data into Google Data Studio.
The problem with this approach is that it can be time-consuming. You'd need to manually export data from Facebook and import it into the Google Sheets reports you want to analyze in Data Studio.
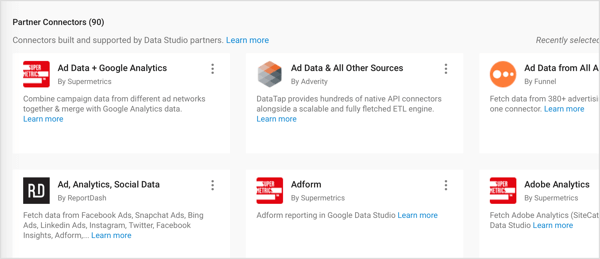
Alternatively, you can use Partner Connectors built by Google's partners. These connectors let you connect several data sources to Google Data Studio. This can be done, for example, by providing you with a Google Sheets template that will pull data from different sources and update them automatically. The Google Sheet is connected to Google Data Studio and lets you access an automatically updated report with different data sources.
#2: Create Your First Report in Google Data Studio
Once you've connected your data source with Google Data Studio, you're ready to create your first report. You can adjust the data sources in this workflow to create a report on Facebook or Instagram campaigns.
The reports in Google Data Studio aren't the typical tables and graphs you're accustomed to seeing. With endless customization options, you can tailor reports to your specific needs and tell your story in a uniquely visual way.
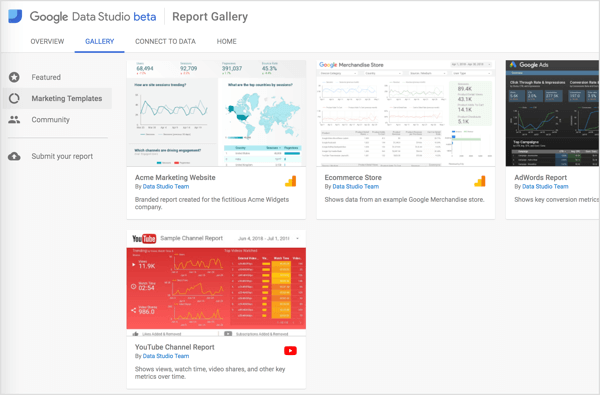
If you find the number of options overwhelming, Google and the Google Data Studio community provide pre-built templates you can start with.
Start a New Report From Scratch
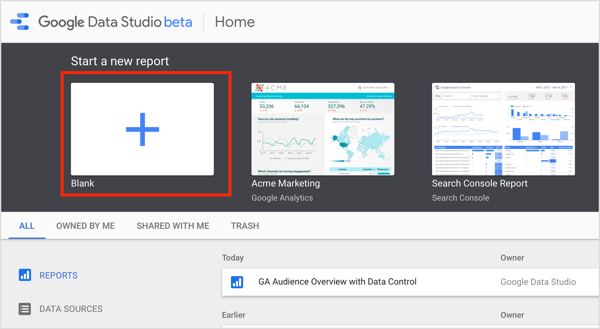
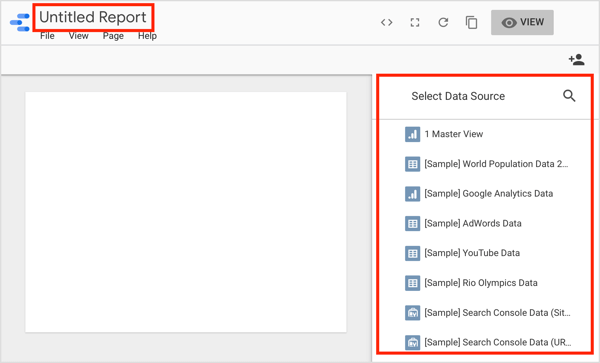
If you want to create a new report from scratch, go to the Google Data Studio home page and click Start a New Report on the Report tab.
On the next page, select your data source on the right and click Add to Report in the pop-up window. Then type in a report name at the top of the page.
Work From a Template
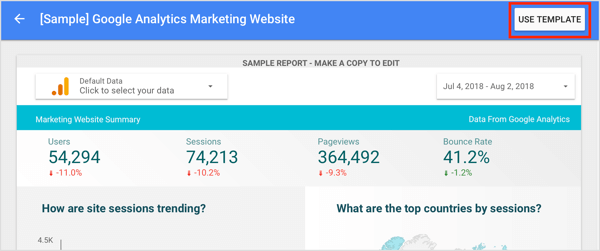
If you'd rather work from a pre-built template, click the template you want to use on the Google Data Studio home page. On the next page, click Use Template.
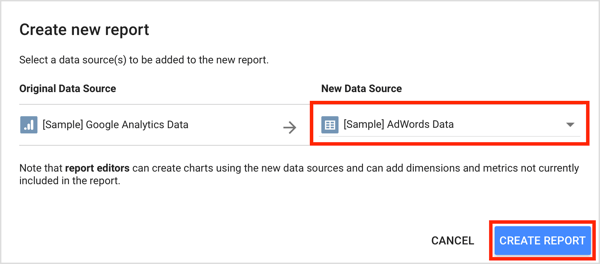
In the Create New Report dialog box, select your data source from the drop-down menu on the right and click Create Report. Data Studio then replaces the template data with your data.
From here, you can customize your new blank report or template to suit your business needs. The rest of this article shows you how.
#3: Add Charts and Tables to Your Report
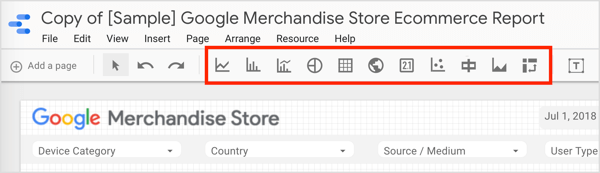
Data Studio offers an array of tools you can use to customize your reports. In the toolbar at the top of the report, you'll find icons that let you add different types of charts and tables. From left to right, they are:
- Time Series
- Bar Chart
- Combo Chart
- Pie Chart
- Table
- Geo Map
- Scorecard
- Scatter Chart
- Bullet Chart
- Area Chart
- Pivot Table
Most of the charts offer various breakdowns to choose from, depending on the dimensions you're interested in. All of the usual spreadsheet features like pivot tables are easy to create.
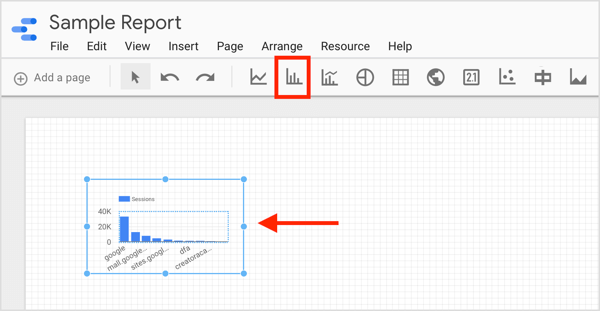
To add a chart or table, click the icon for the element you want to create. Then draw a box in the area of the report that will host the chart. Google Data Studio then adds the chart or table to your report and automatically selects the dimension and metric. You can customize these settings as described in the next section.
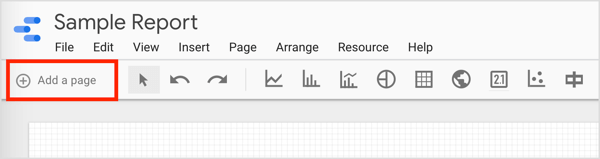
Tip: If you want to provide an in-depth analysis of different aspects of your report, you can create a multi-page report. To add a new page to your report, click the Add a Page option in the upper left.
#4: Customize the Dimensions and Metrics for Components in Your Report
You can use two types of parameters in your reports: dimensions and metrics. Metrics are quantitative pieces of data such as the number of clicks, or the total cost or CPM. Dimensions are categories that define the metrics in relation to them. Popular dimension choices are day/campaign/device.
You can opt to aggregate metrics using various methods (SUM, AVERAGE, COUNT, COUNT DISTINCT, MIN, MAX) and display metrics differently based on what you'd like to see in the report. To illustrate, select Percent of Total to see how much each dimension contributed to a common goal.
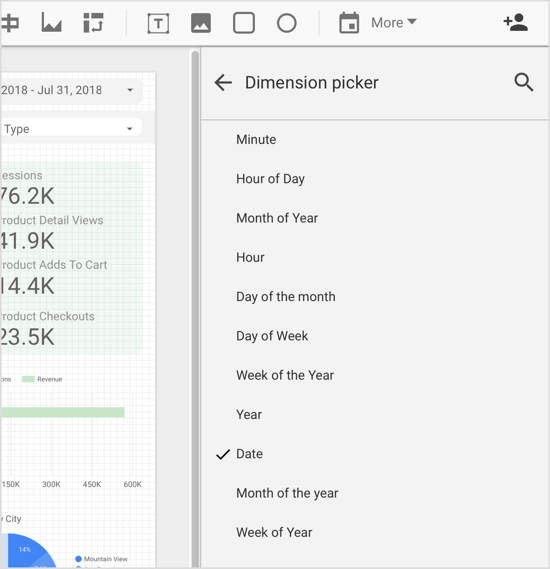
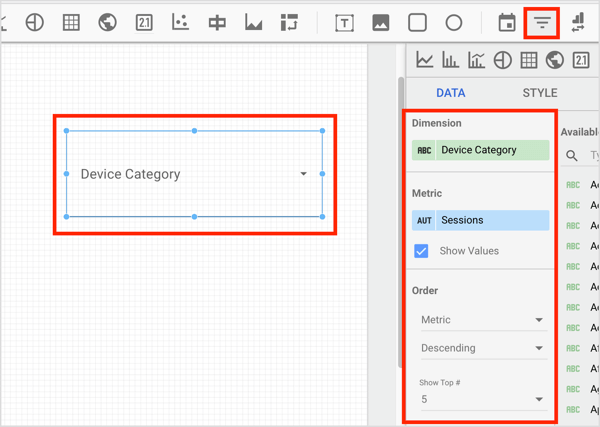
To see the dimension and metric for a component in your report, click to select the component such as the chart shown below.
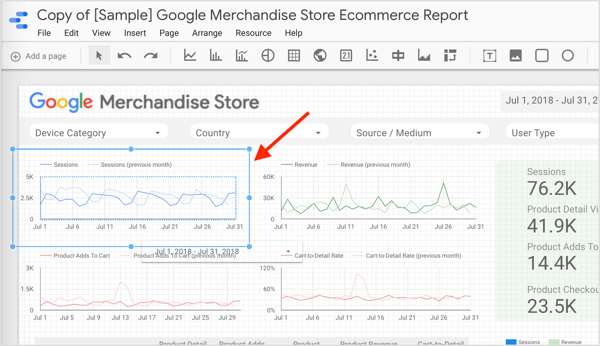
The component properties panel opens on the right side of the screen. Click the Data tab to see the dimension and metric for the component you've selected.
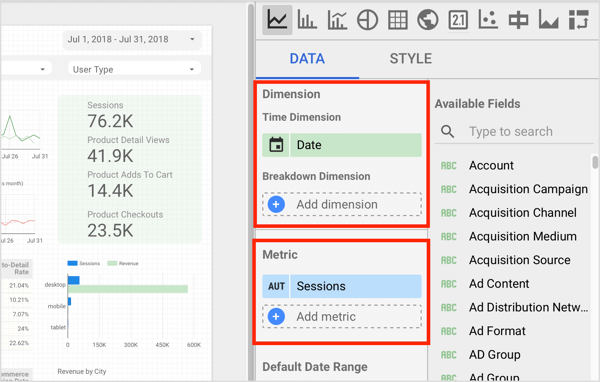
If you want to change the dimension for the selected component, click the current dimension (Date, for instance) and Data Studio will display a list of eligible fields. Now select the dimension you want to report on.
You can change the metric used for the selected component in a similar way. Click the metric to see a list of eligible fields to choose from.
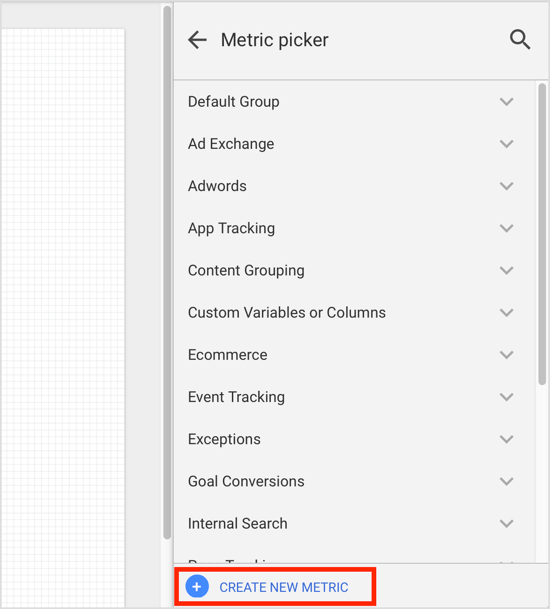
If the metric you want to use doesn't exist by default, you can create the metric as a calculated field. To do this, click Create New Metric at the bottom of the Metric Picker (as shown above).
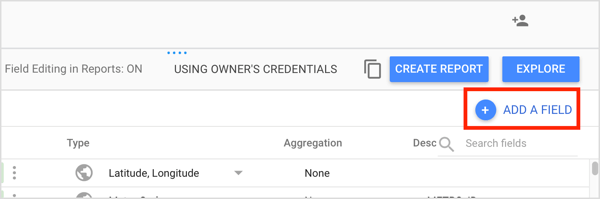
Alternately, navigate to the main Google Data Studio page, click the Data Sources tab, and select your data source. On the next page, click Add a Field in the upper-right corner.
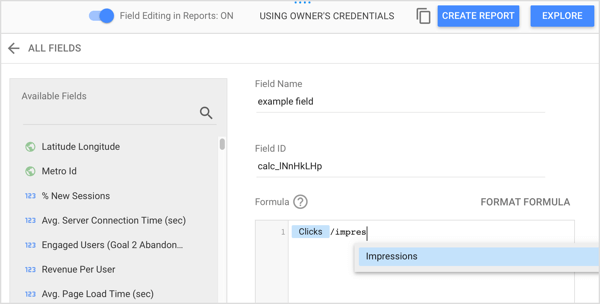
Now type in a field name and build your formula in the Formula box.
There are several things you can do with a custom field. The most basic one is to use existing numeric fields for mathematical calculations. You can also apply functions to create advanced calculated fields and include parameters like time and location. Or you can create CASE statements to use conditional logic (if/then/else) to determine the field values.
3 Days of World-Class Training—Zero Travel!

Couldn't make it to Social Media Marketing World and AI Business World this year? Get all of the great content at a fraction of the price with a Virtual ticket.
That’s full access to recordings of every keynote, workshop, and session—the ones people travel thousands of miles to see. Don't wait. Get your Virtual ticket and enjoy actionable content that you can watch anytime, anywhere.
When you're done setting up your calculated field, click Save. Now you can use this new field in your report.
#5: Tweak the Report's Layout and Theme
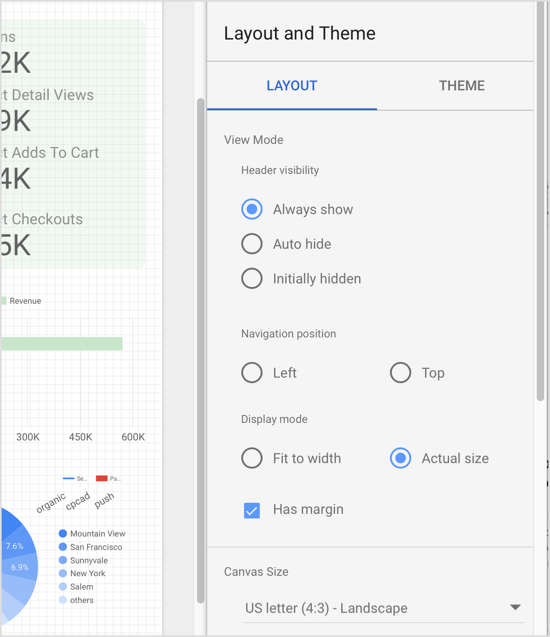
When no component is selected in your report, you see the Layout and Theme tab in the right panel. The options on these tabs control how your report is displayed.
On the Layout tab, you can tweak aspects of the report like the view mode and canvas size. In the View Mode section, you can control the visibility of the report header, where page controls appear, and how the report is displayed in your browser window.
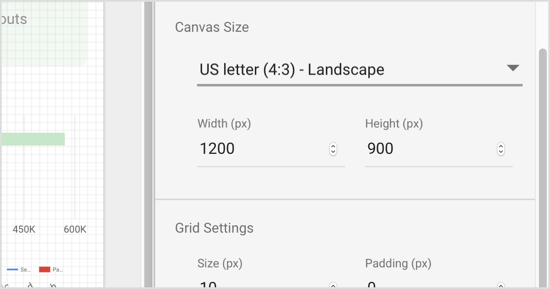
Canvas Size lets you select from default sizes or enter your own custom dimensions.
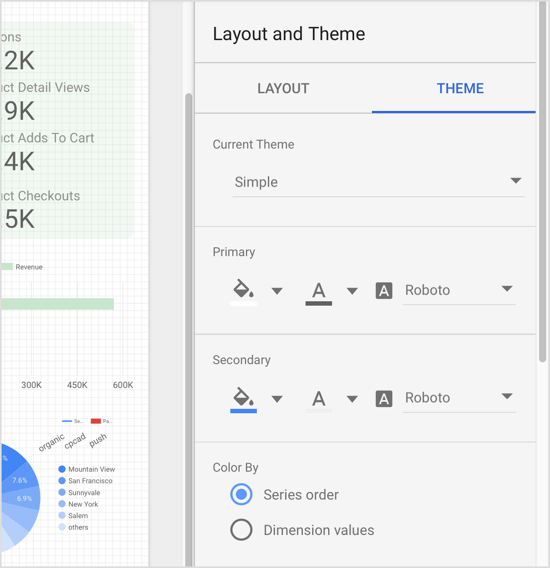
On the Theme tab, you can choose from different themes (dark/light) that control how your report is displayed, as well as select the color palette and fonts used in your report.
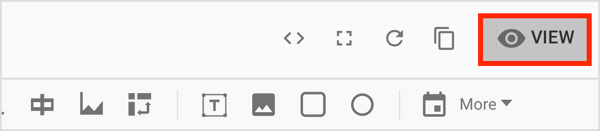
Tip: Use the View/Edit toggle button in the top-right corner of the page to switch between View and Edit mode. Edit mode lets you edit your report and View mode lets you preview what others will see when viewing your report.
#6: Filter the Data in Your Report for Facebook Campaigns
Naturally, you can import images and shapes into your reports, but the most important features are filters and date ranges, which let you refine the data that appears in your report.
Add Filter and Date-Range Controls
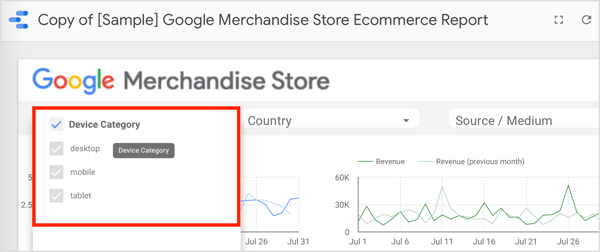
First, let's look at filter controls and date-range controls. If users select a filter control when viewing your report, they see a list of options that control the data that's displayed in the report.
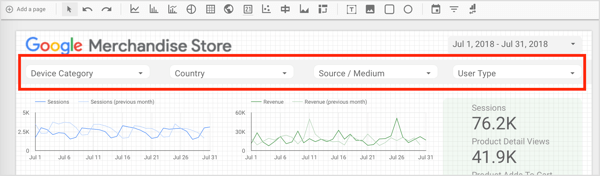
To demonstrate, if a filter parameter is a Device Category, the user can isolate a specific device or a combination of devices.
Similar to filters is the concept of date-range controls, which let you control the time period you want to focus on. This feature is particularly useful when you have an ongoing campaign and have to create monthly reports. If you include a date-range control in your report and set it to the desired month, your report will show only the data for the selected time period.
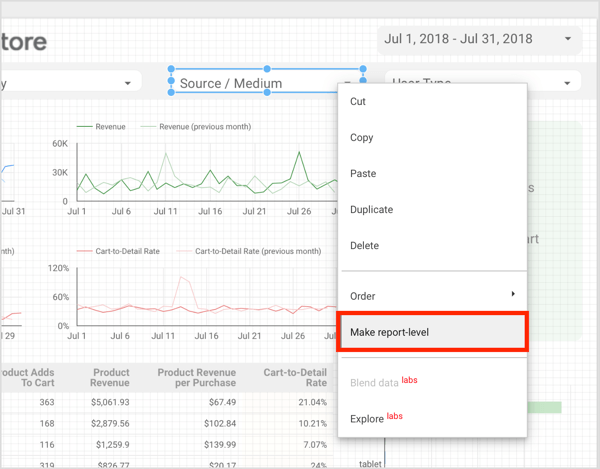
You can set filters and date-range controls at the page or report level. By default, they operate at a page level. If you want to change to the report level, right-click on the control and select the pertinent option when editing the report.
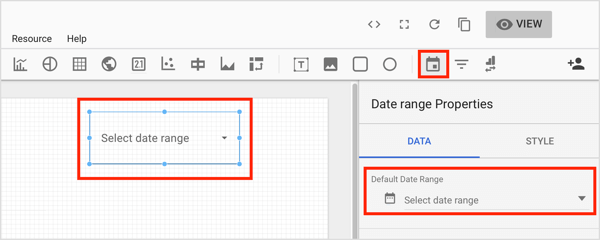
To add a date-range control to your report, click the Date Range tool on the toolbar and draw a box in the area of the chart where you want to add the control. Then select the default date range in the properties panel.
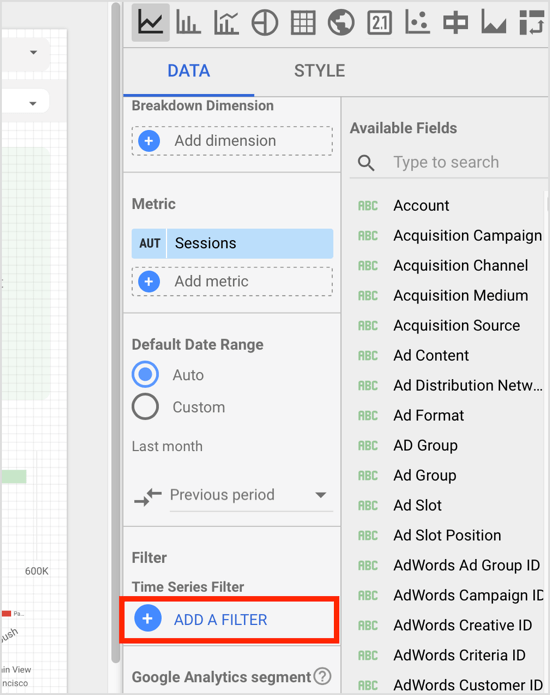
To add a filter control to your report, click the Filter Control button on the toolbar and draw a box where you want this control to appear on your report. Then use the properties panel to configure the filter control's settings.
Add a Filter
Now let's look at how to create filters with the Filter Manager.
Suppose you're trying to build a report on a Facebook campaign that consists of six different campaigns: two Reach campaigns, one product catalog Conversions campaign, one non-dynamic Conversions campaign, and two Video Views campaigns. You need to report on the campaign as a whole but also report the Conversions-Reach-Video Views campaigns as categories and each campaign on its own.
How do you do this when the data source is an ad account with multiple other campaigns contaminating your data? Date-range controls won't suffice because you might have different active projects during the same period. What you need to do is filter the data you want so the report includes only that data.
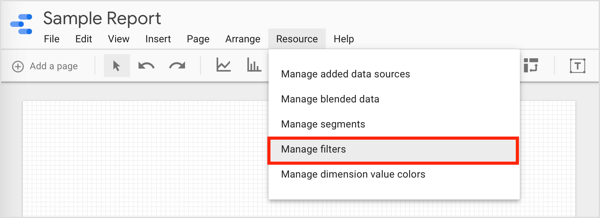
To filter data and create groups you can use, click Resource on the menu bar and select Manage Filters from the drop-down menu.
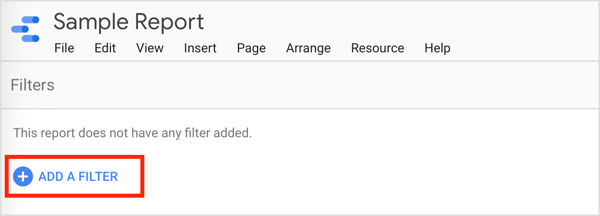
On the next page, click Add a Filter.
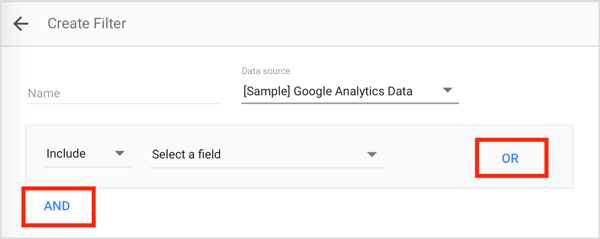
On the Create Filter page, name this group of data and select the parameters that will filter your desired result. Click OR or AND to add parameters as needed.
For this example, you need four groups of filters: one group for Conversions campaigns, one for Video Views campaigns, one for Reach campaigns, and one for the entire activity.
Name the first group Conversions, and in the parameters that the group will be based on, enter the Campaign ID for each Conversions campaign. Use the OR function to combine the different campaigns. When you're done, save the filter.
Repeat this process for the other groups and include the campaign IDs in each group. You can use AND instead of OR if you want to exclude information to narrow your scope.
Now you can apply this filter to any chart, scorecard, or table you wish. Simply click the element to which you want to tie a specific filter. Then from the component properties panel, click the Add a Filter option on the Data tab.
Then choose the desired filter from the Filter Picker. Now the selected component will depict only data that correlates with that filter.
#7: Blend Multiple Data Sources
One of the many benefits of Google Data Studio is the ability to combine, or “blend,” multiple data sources. This is helpful if you want to move away from a segmented approach to analyzing your digital activities; integrate multiple data sources to gain a holistic and unified view of your online presence.
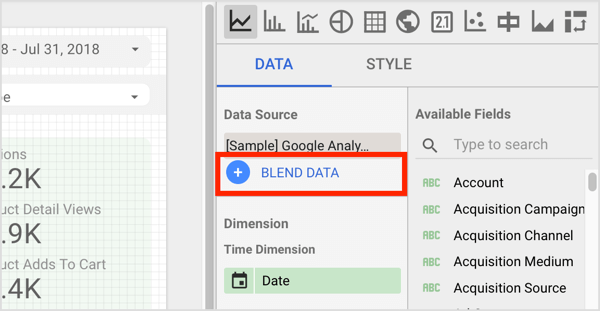
To blend data from different data sources, select the component in your report and then click Blend Data on the Data tab on the right.
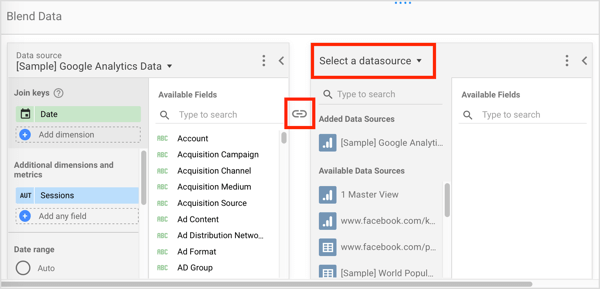
Then choose the additional data source and the way in which the data sources are connected.
The ability of Google Data Studio to combine data sources opens up new possibilities for businesses of all sizes. Combining different data sources gives you a superior picture of where your business stands, rather than by looking at different segmented reports from different media, which gives you a narrow, siloed view.
#8: Share Your Report With Team Members or Clients
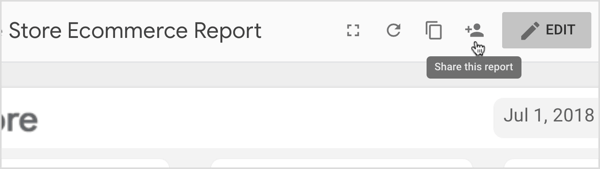
Sharing a report with team members or clients is easy. Simply go to View mode and click the Share This Report icon in the upper-right corner.
In the pop-up window, select how you want to share the report. You have two options: enter the names or email addresses of the recipients, or get a shareable link to distribute.
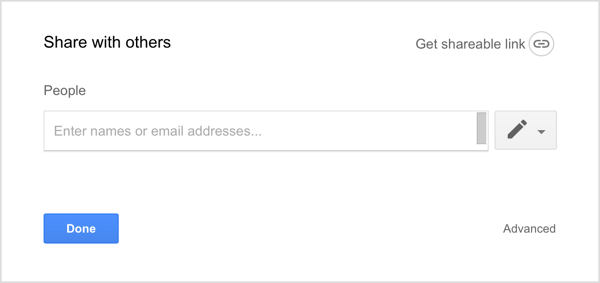
In both cases, you need to decide whether the recipients will be able to only view, or view and edit the report. Generally, when sharing with clients, Can View is recommended, and when sharing with team members, Can Edit is the norm.
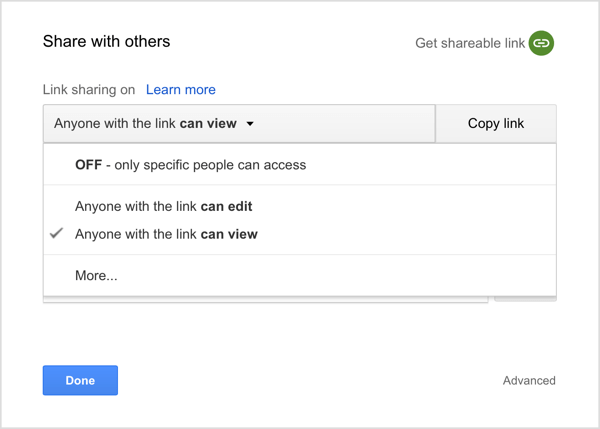
When you generate a shareable link, you also have the option to edit the link-sharing permissions by clicking More. Be careful not to choose to make your report Public on the Web. You want to limit access rights to only those who have the link, unless of course you want to make the report publicly accessible.
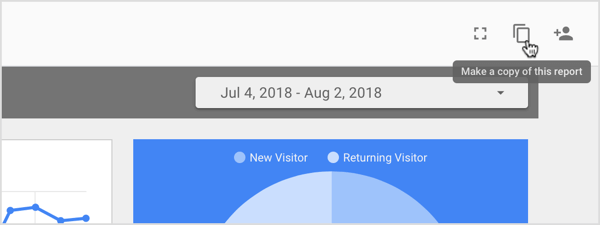
#9: Use Your Report as a Template
When you're finished customizing your report, you can use it as a template for future reporting.
To do this, open the report on which you want to base a new report and click the Copy icon in the upper-right corner. In the Create New Report dialog box, select the data source(s) to use and choose Create Report.
Real-Time Reporting
Real-time reporting with Google Data Studio is easy. If you deal with clients who require new reports frequently, the functionality is invaluable. When an activity you want to reach has been enabled, prepare a report.
Choose a date-range control and select the period you want to examine. Set the end of the activity as the end date to ensure that no other data after that date will be included in your report and share the report with the client. That's it. The report will be automatically updated with data in real time.
Click here to find articles and resources on Facebook advertising.
What do you think? Do you use Google Data Studio? Do you use the pre-built templates or create your reports from scratch? Let us know in the comments below.

Curious About How to Use AI?
Our newest show, AI Explored, might be just what you're looking for. It's for marketers, creators, and entrepreneurs who want to understand how to use AI in their business.
It's hosted by Michael Stelzner and explores this exciting new frontier in easy-to-understand terms.
Pull up your favorite podcast app and search for AI Explored. Or click the button below for more information.
