Looking for advanced insights in YouTube Studio? Want to analyze groups of YouTube videos based on content categories or funnels, rather than playlists?
In this article, you'll discover six ways to use YouTube Analytics groups to analyze and improve your YouTube content.
What Are YouTube Analytics Groups and Why Should Marketers Care?
In YouTube Studio, groups are collections of videos you can create from your channel's Analytics tab. They're for purely analytical purposes. Any videos you add to a group won't appear connected in any publicly visible way such as a YouTube playlist.
Individual videos aren't the only type of content you can include in a group. You can add any combination of videos, playlists, or even entire channels to a single group. The only limit is the total number of items: groups support up to 500 videos.
So what can you do with YouTube groups? They're ideal for:
- Comparing content categories or themes
- Measuring organic campaign performance
- Analyzing organic video funnels
Think of them sort of like publishing tags you can add to Youtube video content. They can help you organize content into topical or campaign-based collections so you can build more nuanced reports.
Since group analytics are visible to collaborators with eligible roles across your channel, they also allow your team to evaluate content collections together. Using your takeaways, you can take steps to improve your YouTube channel strategy and meet more ambitious marketing goals.
If you aren't using groups, then YouTube's options for analyzing multiple pieces of video content are pretty limited. In most cases, your only options are looking at a channel overview or evaluating individual videos or posts.
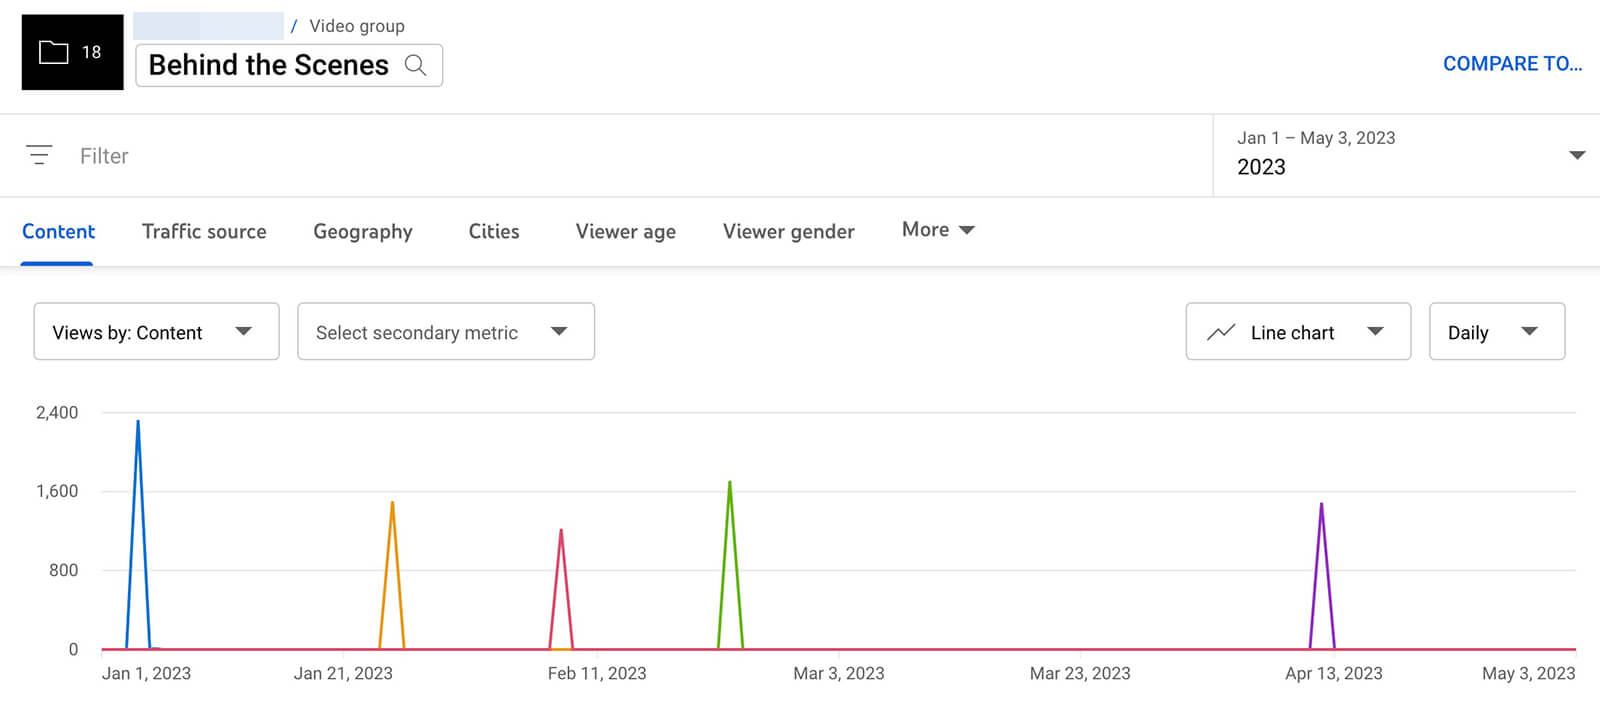
That is, unless you've developed playlists. YouTube does have playlist analytics that help you understand what's happening across all of the videos you've added. They can give you useful insights into how certain video topics or styles are performing. The only catch is that playlists are publicly visible so you wouldn't want to create a playlist for analytical purposes.
How to Set Up Analytics Groups in YouTube Studio
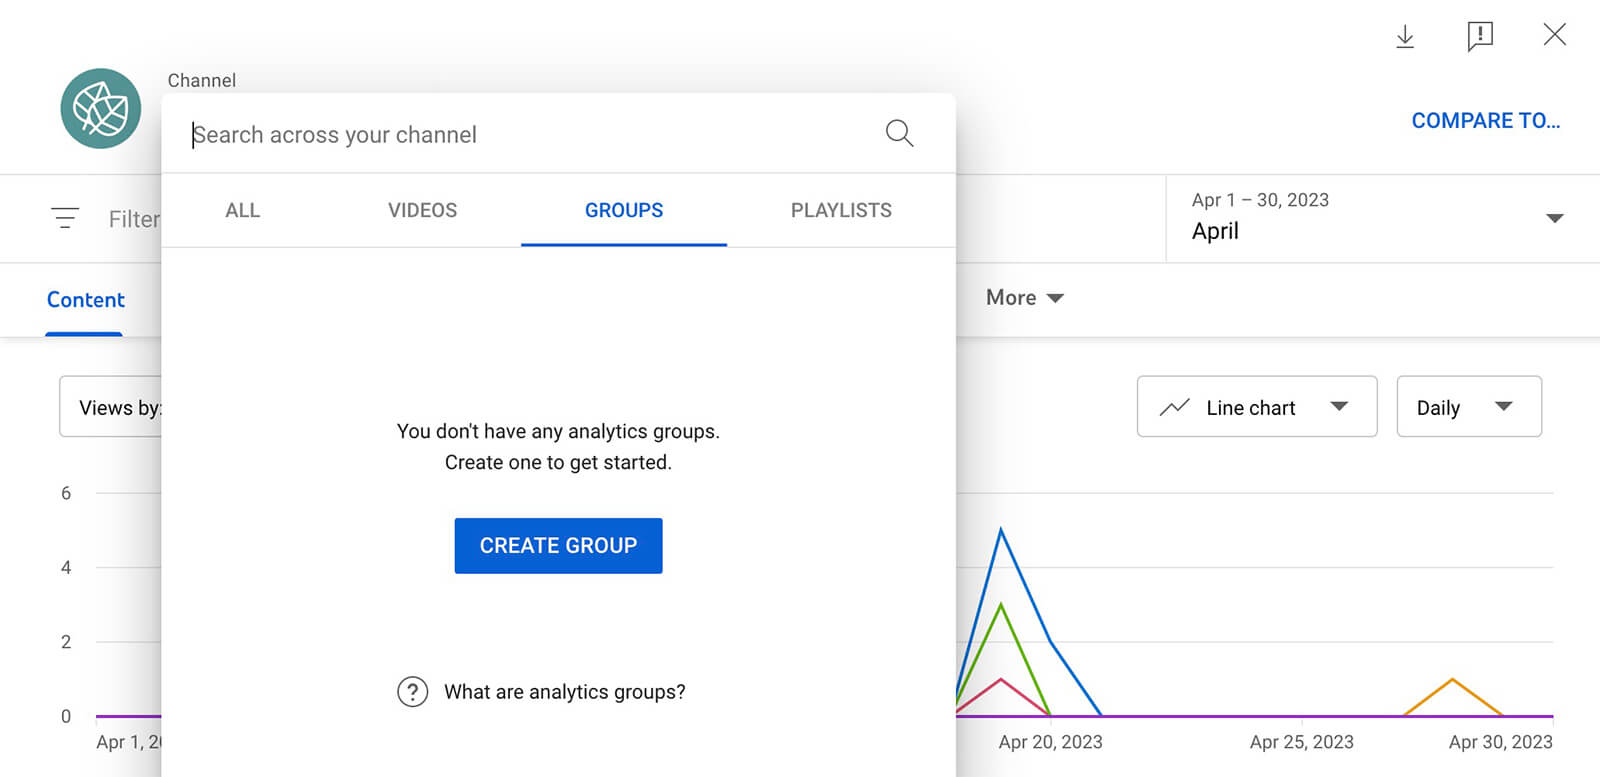
To create an analytics group, open YouTube Studio in a desktop browser. Go to the Analytics and click the Advanced Mode link in the top-right corner. Then click on your channel name in the upper-left corner.
Although it's technically the search bar, it also contains handy lists of all of your channel's videos, playlists, and groups. Click the blue Create Group button to set up your first collection.
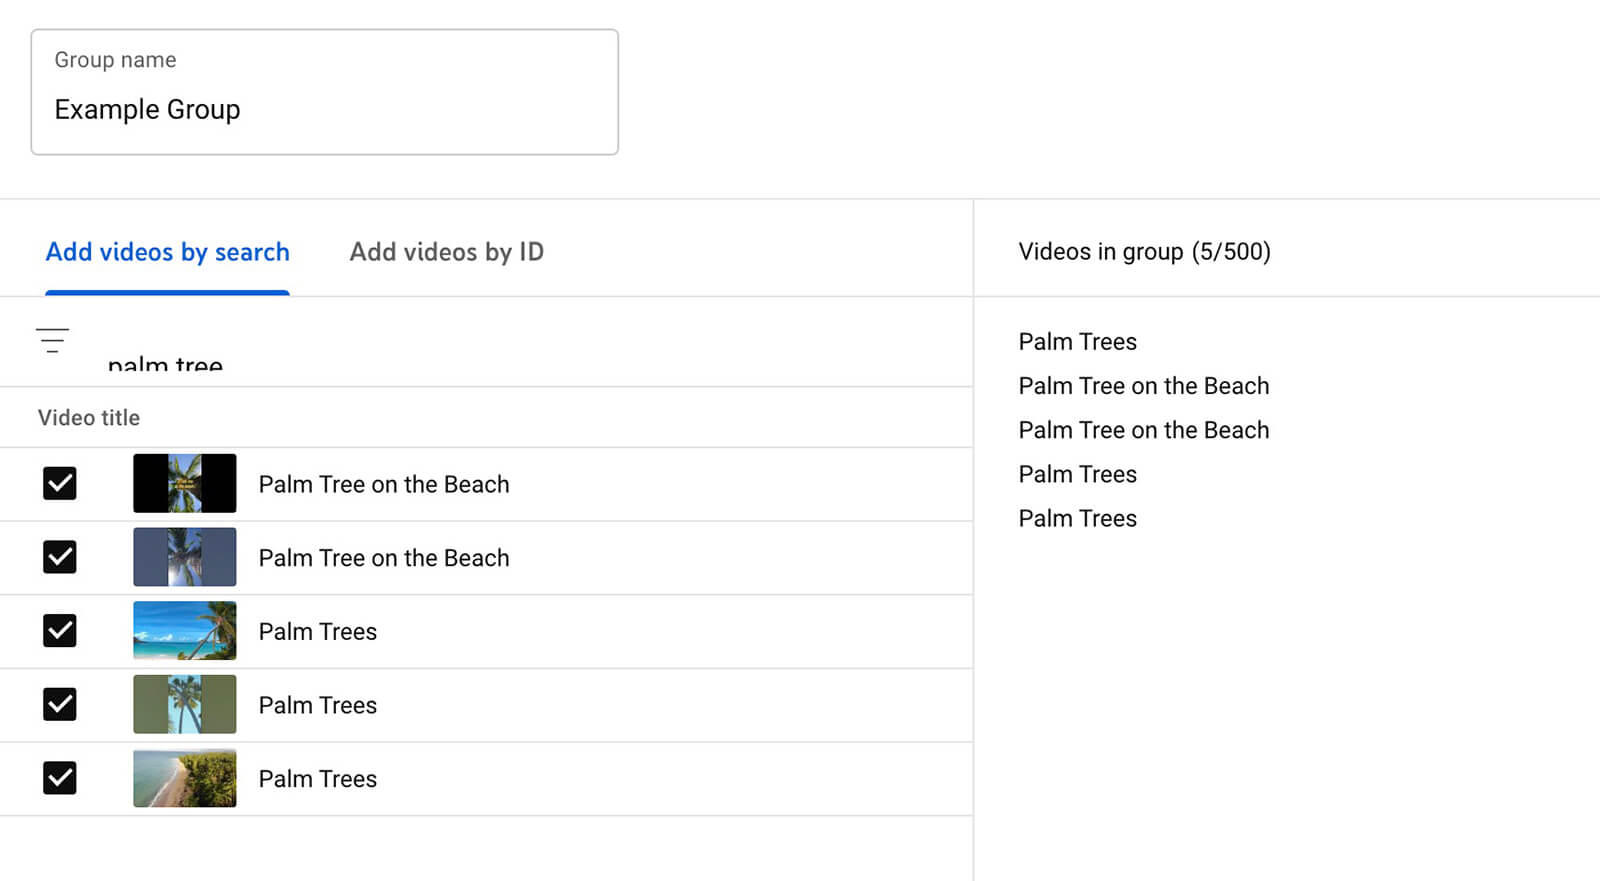
By default, your channel's recent public videos will display in chronological order, starting with the newest. You can scroll through the list and manually check the box next to every video you want to add. If the list is too long to browse or if you're looking for older content, use the search bar to look up content by title.
If you have a much longer list of content to add, it's easier to find videos by ID. For example, this option works well if you want to add several playlists to a collection. Keep in mind that it isn't possible to search by playlist so you need to know the individual videos to add.
Note that you can add any of your channel content to a group, regardless of the status. That includes public, private, unlisted, and even draft content. When you're finished setting up the group, click Save to add it to your account. You'll be able to see it on the Groups tab in Advanced Mode search.
Get World-Class Marketing Training — All Year Long!
Are you facing doubt, uncertainty, or overwhelm? The Social Media Marketing Society can help.
Each month, you’ll receive training from trusted marketing experts, covering everything from AI to organic social marketing. When you join, you’ll also get immediate access to:
- A library of 100+ marketing trainings
- A community of like-minded marketers
- Monthly online community meetups
- Relevant news and trends updates
It's easy to update a group you've created at any time. Open Advanced Mode analytics, and click to access the search bar. On the Groups tab, hover over the group you want to edit. Click the pencil icon, add or remove any content from the list, and save to apply the new settings.
From the Groups tab, you can also click Create New Group to set up a new collection.
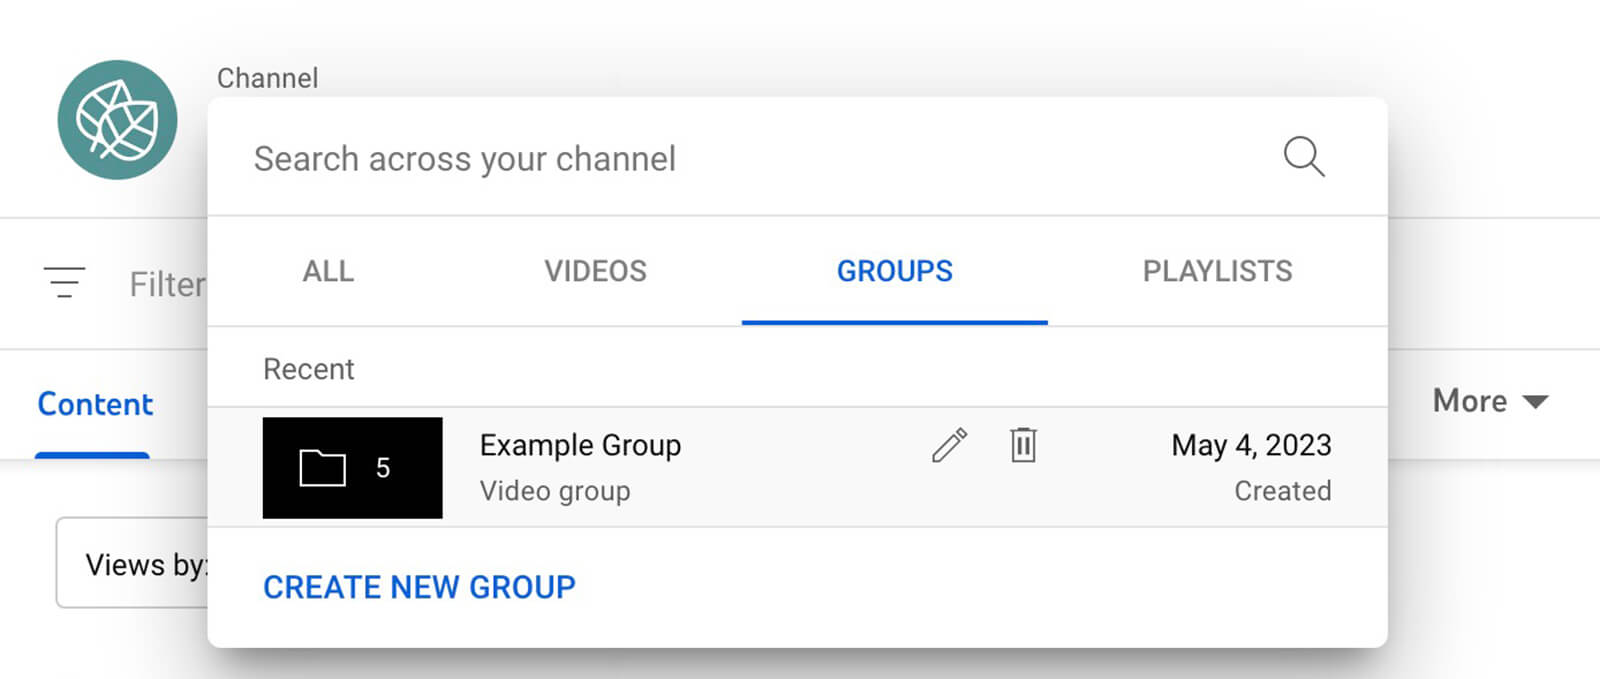
There's no published limit on groups, so you can create as many as your channel needs. If a collection is no longer useful to your team, you can always clear it from your list by clicking the trash can icon.
Not sure where to start? Try grouping your YouTube videos by:
- Campaigns
- Funnel stages
- Video formats (i.e., shorts vs. full-length videos)
- Topics (i.e., behind the scenes, explainers, or lifestyle)
- Content styles
- Thumbnail designs
- Hook concepts
- End screen formats
6 Questions You Can Answer Using YouTube Analytics Groups
When you view video groups in Advanced Mode, you can create custom reports that offer much higher-level insights than what you'd find in YouTube Studio's regular analytics. Note that all of the reports are available in various visual chart formats in YouTube Studio. You always have the option to export these reports but only in spreadsheet format. Let's take a look at what you can learn from these reports.
#1: Are Viewers Watching More or Less of This Content Over Time?
In many cases, videos might drive the most views in the first 24 hours or week after you publish. But if you're publishing videos on certain topics regularly, then you can probably expect to see consistent views over time.
Checking analytics for individual videos won't tell you much. But if you create a group of content on a certain topic, you can use the Views report to look for patterns. You might still see spikes if you typically get a lot of views right after publishing content. You can track patterns over time to see whether interest is growing or fading.
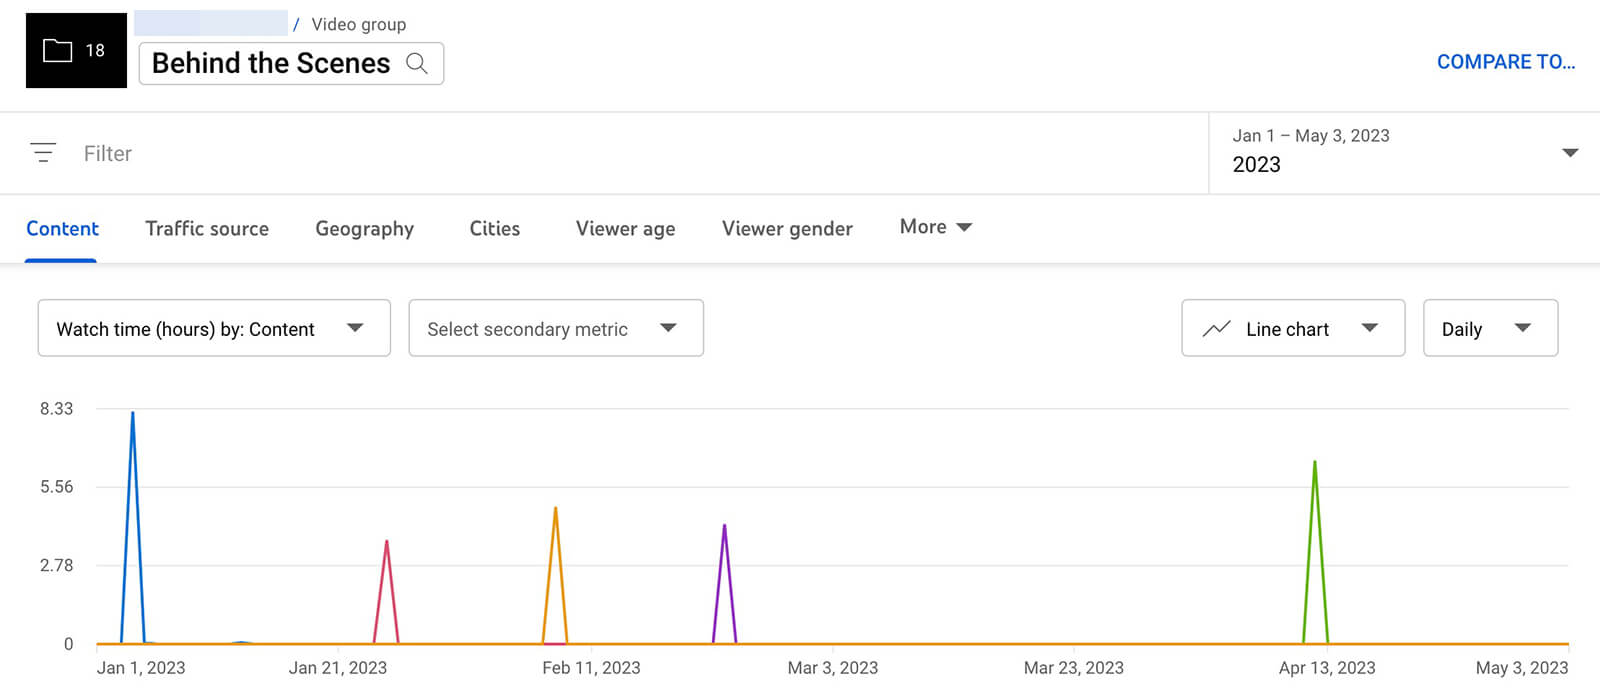
The Watch Time and Average View Duration can tell you even more about how viewers are consuming your videos and whether topics or styles appear to be taking off or becoming less interesting to your audience. The former reveals the total amount of time (in hours) that viewers are watching videos in the group per day.
The Average View Duration report shows the average amount of time viewers spend on group videos each day. If you group videos of a similar length (i.e., 15-second shorts or 5-minute explainers), this report is particularly helpful for spotting view-related patterns.
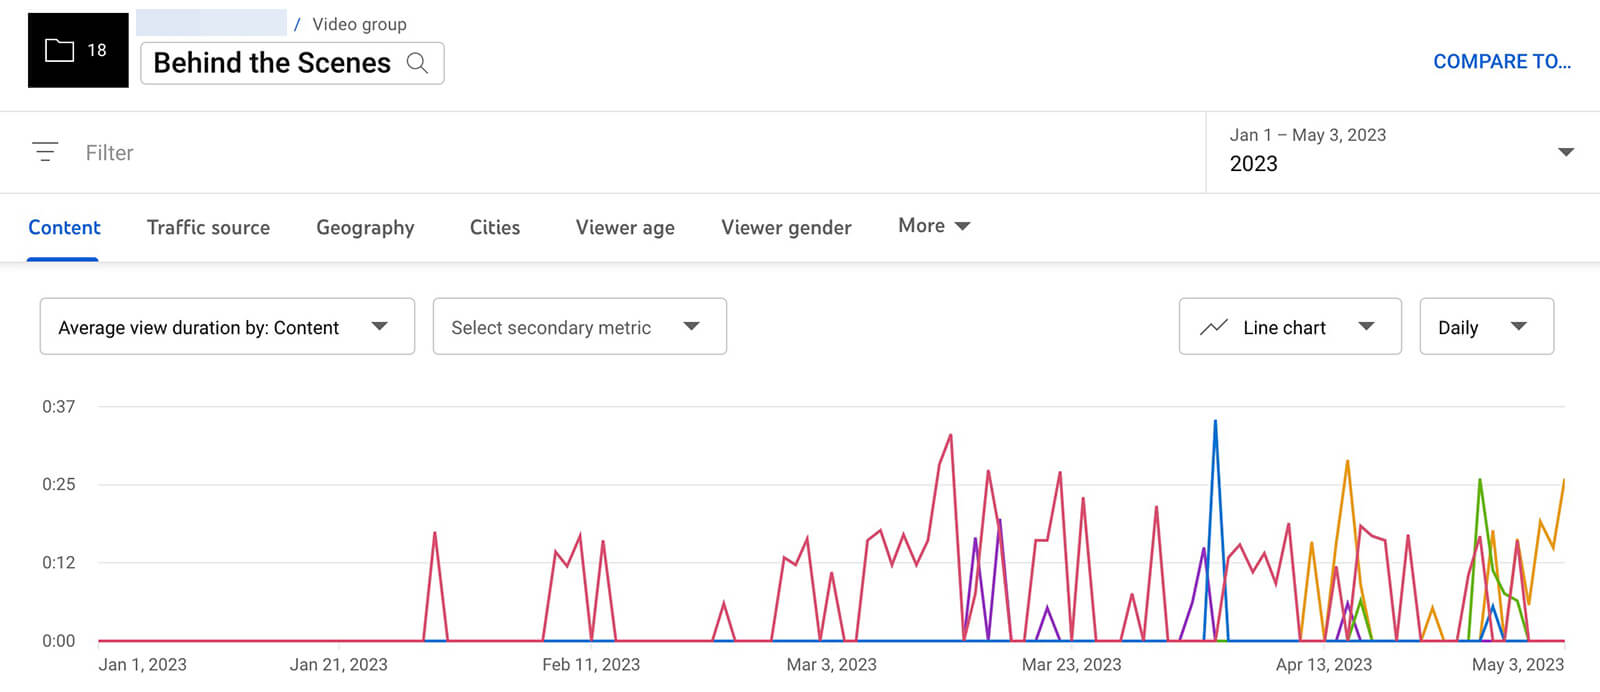
As you analyze these reports, make sure the nature of the group informs your insights. For example, say the group includes several similar videos that appeal to bottom-of-funnel viewers and you find that video views are increasing. That may be a sign that you've successfully built your funnel and it's time to focus on conversions. You can use these insights to ensure the next videos you produce are as valuable as possible to your business.
#2: How Are Viewers Responding to This Type of Content?
Do viewers engage with your content or do they watch passively before scrolling away? The Likes and Comments reports can give you a sense of how these metrics are trending over time. But they only tell part of the story.

Discover Proven Marketing Strategies and Tips
Want to go even deeper with your marketing? Check out the Social Media Marketing Podcast! Publishing weekly since 2012, the Social Media Marketing Podcast helps you navigate the constantly changing marketing jungle, with expert interviews from marketing pros.
But don’t let the name fool you. This show is about a lot more than just social media marketing. With over 600 episodes and millions of downloads each year, this show has been a trusted source for marketers for well over a decade.
For example, if likes have generally decreased over time, are you also seeing declining views and watch time? (Revisit the reports above.) That could signal the topic or style you're analyzing is losing steam. Changing up how you cover a topic or updating your video style might help you turn these trends around.
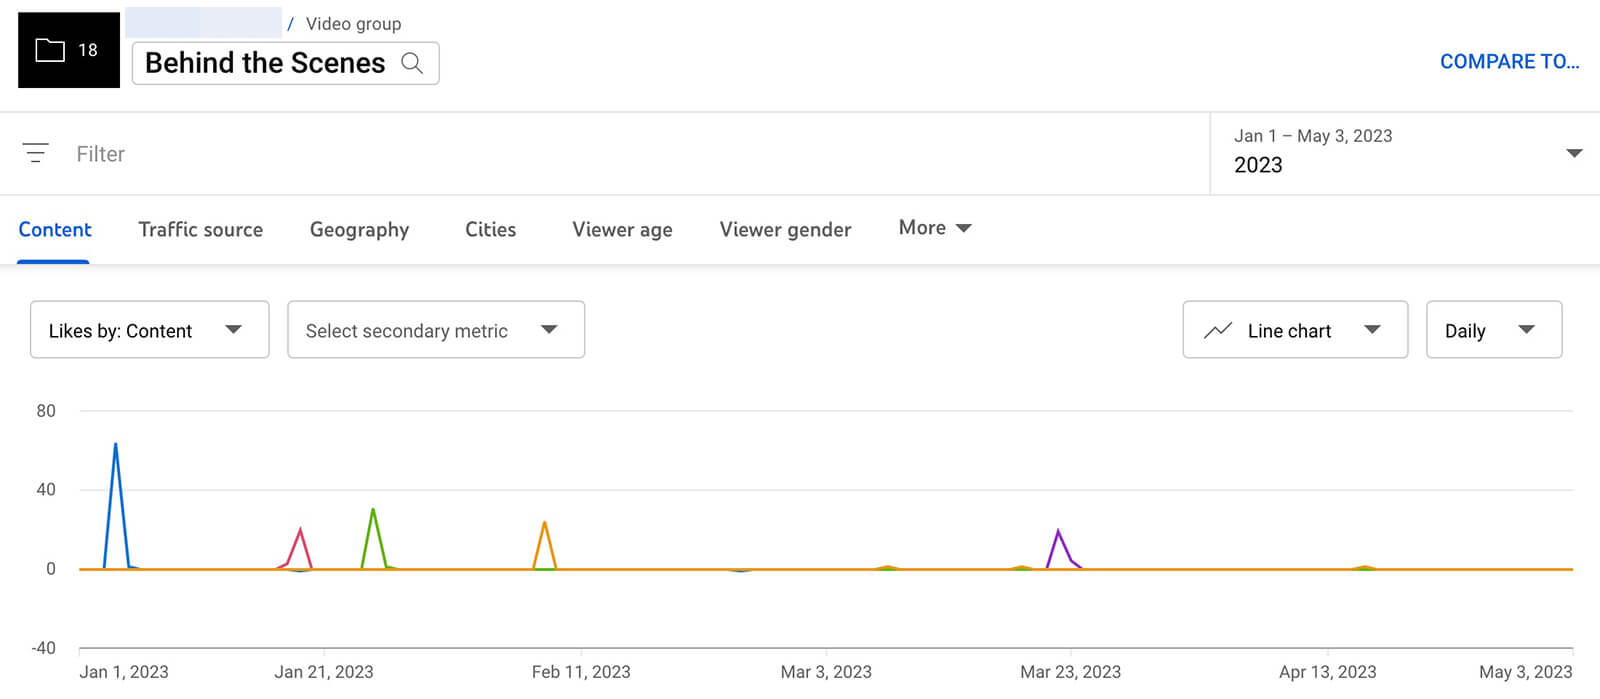
Likewise, decreasing comments may indicate declining interest in the topic or style you're analyzing. Yet takeaways really depend on the nature of the comments that the videos in the group generally receive. It may be helpful to do some manual analysis so you can dig deeper into the sentiment and then adjust your strategy accordingly.
Wondering whether your audience has started to actively dislike your videos? The Likes vs. Dislikes report can help you keep an eye on this important ratio. A low-performing video here or there shouldn't be cause for concern but a general trend toward more dislikes than likes probably warrants making some changes to your YouTube channel strategy.
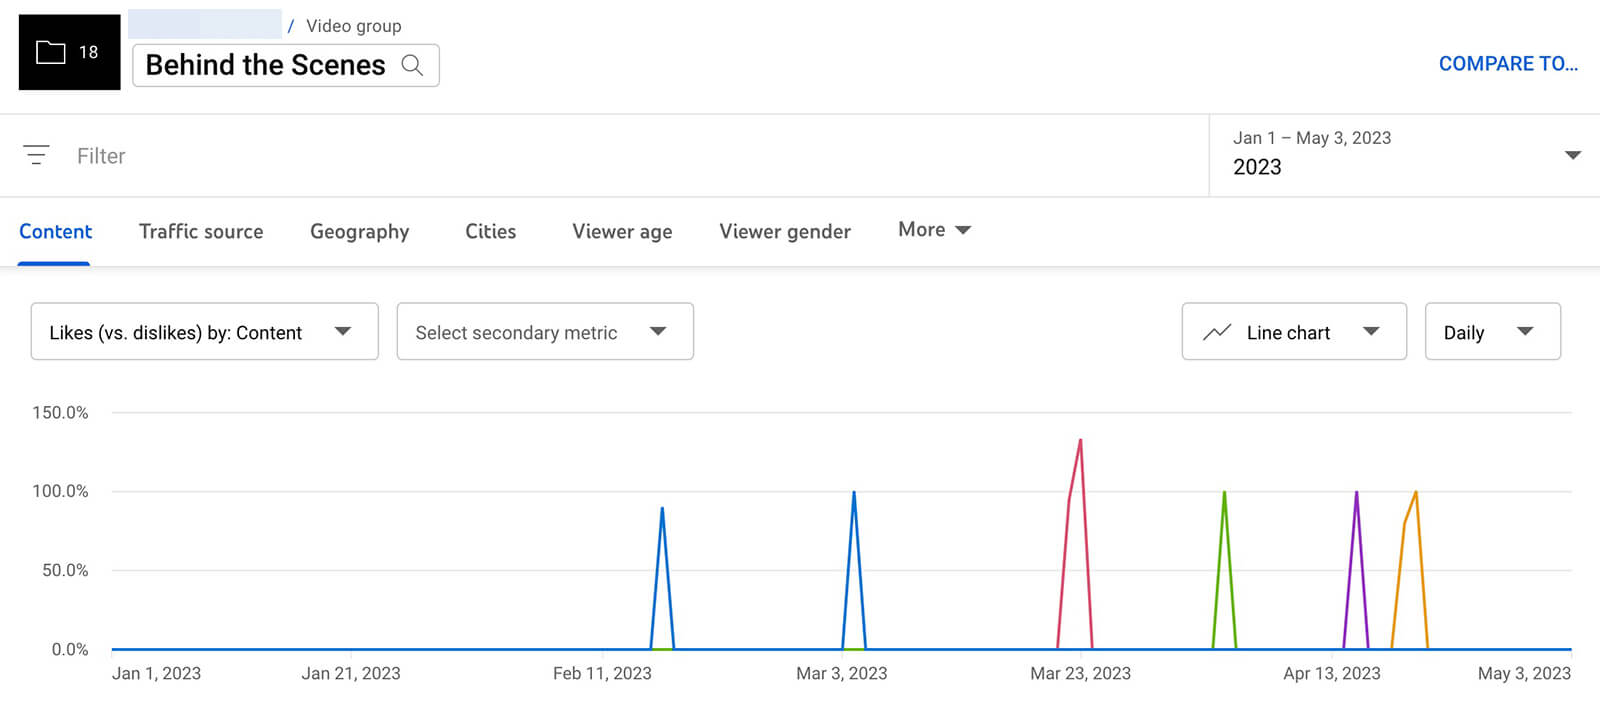
#3: Where Are Viewers Finding This Content?
YouTube Studio's traffic report is great for revealing how viewers find your content. But typically, you can only see this data at the channel or video level. When you create groups of videos, you can monitor traffic sources over time and see whether certain sites or search engines are continuing to drive clicks.
For example, say the videos in your group typically drive a ton of traffic via YouTube search. If you notice that the platform's native search engine is driving decreasing amounts of traffic to your content, it may be a signal that your content isn't optimized for YouTube search. It could also mean that the topic or keywords don't have much search volume, which may warrant revisiting your YouTube SEO strategy.
On the other hand, you might notice that another traffic source like browse features or channel pages is suddenly driving much more traffic to your content. On the main Analytics tab, you can check traffic source data for individual videos in the group. Then you can figure out where the extra views are coming from—like a playlist that features your video or a video that suggests your content.
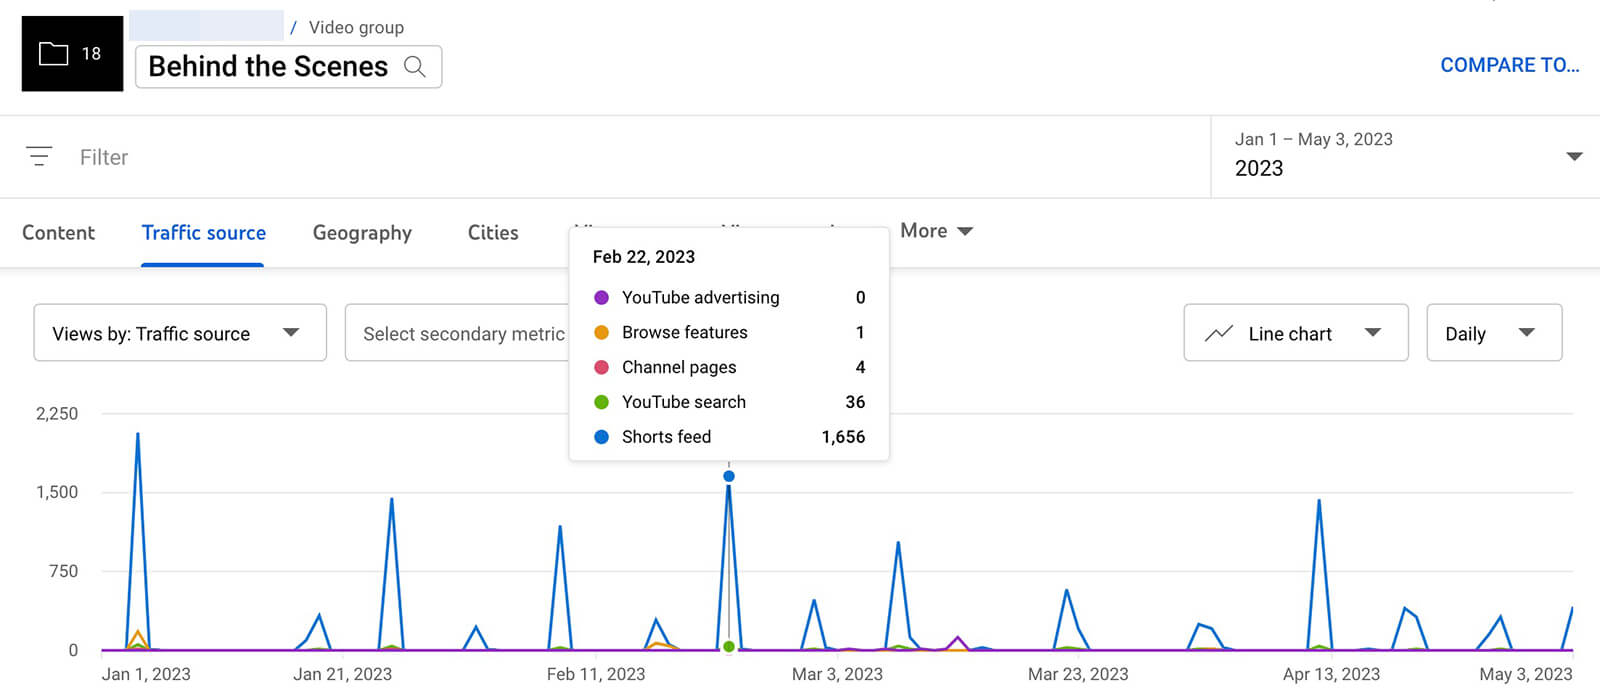
#4: Are Thumbnail or Shorts Feed Impressions Increasing or Decreasing?
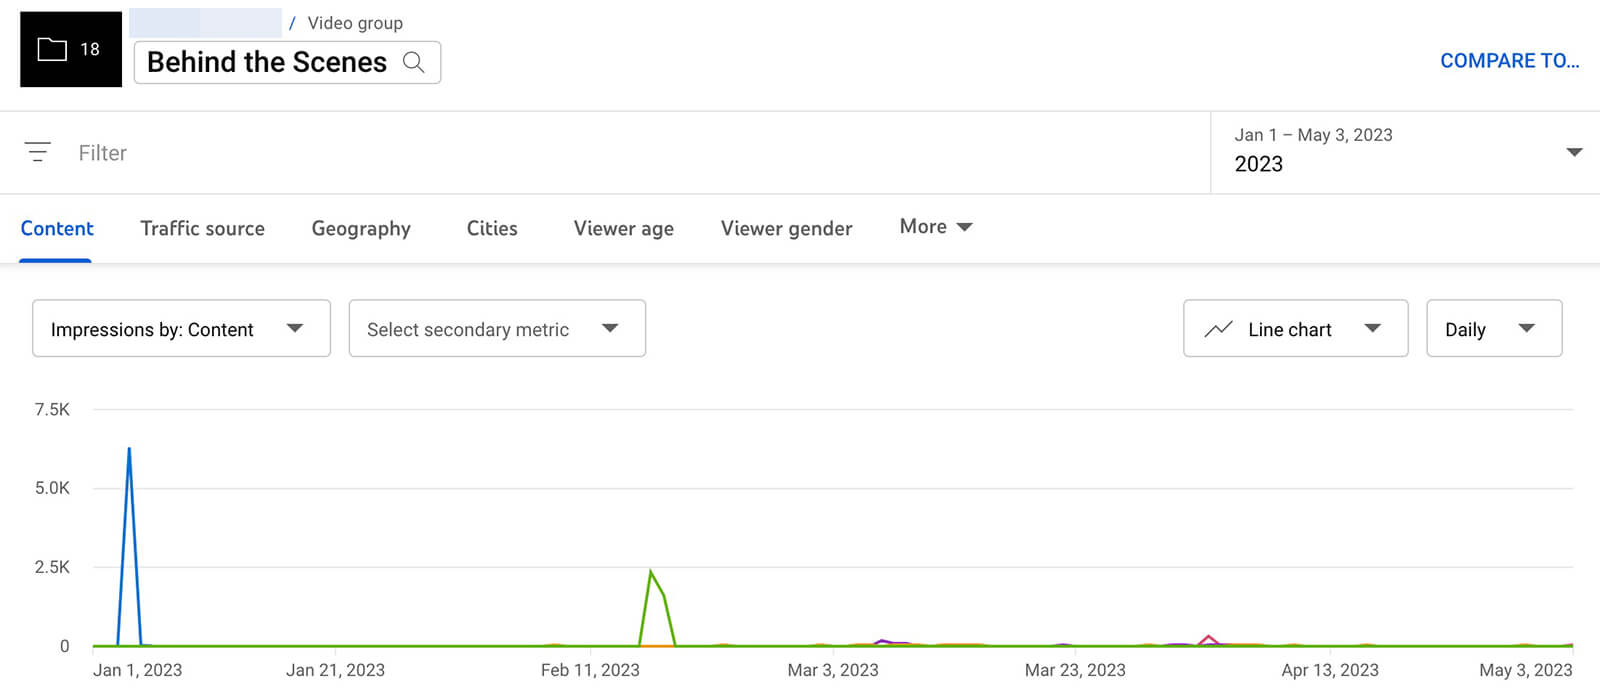
YouTube search and suggested videos can be valuable sources of traffic. But as your channel grows and subscribers engage with your content, it will ideally start to generate more impressions on viewers' home pages and in the Shorts feed.
You can track both of these metrics using group-level reports. Keep in mind that the Impressions report is primarily designed for long-form content, as it reflects thumbnail impressions on YouTube home pages. Thumbnail impressions usually result from viewers subscribing to your channel or YouTube recommending your videos, both of which can indicate positive engagement.
The Shown in Feed report is designed for short-form content, as it reflects impressions in the Shorts feed, which often indicates that YouTube is recommending your content.
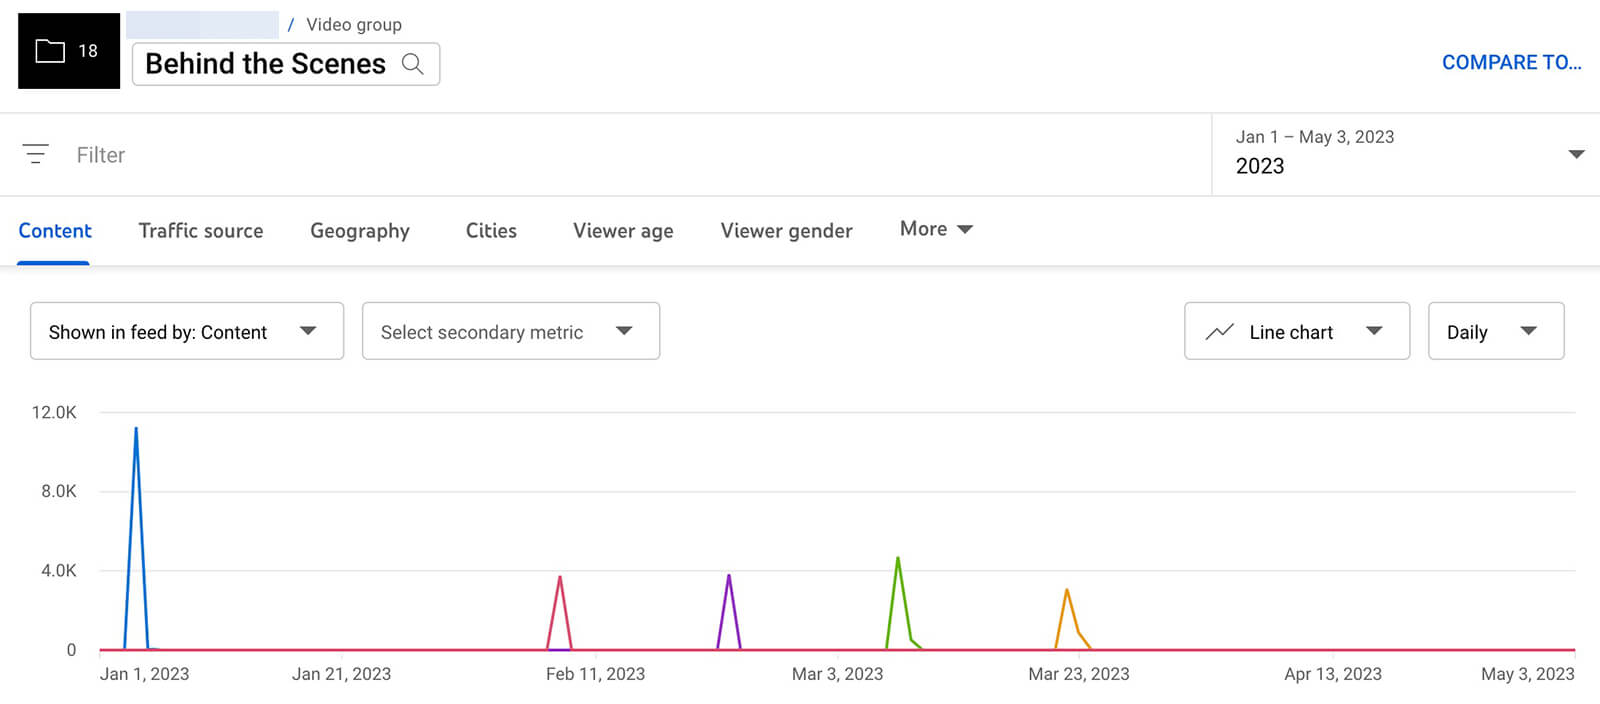
For even more useful insights, use the Viewed vs. Swiped Away report to see how often viewers are opting to watch your videos after they see them in the feed. If this metric is trending downward, you're likely to see fewer views over time, which can lead to negative growth.
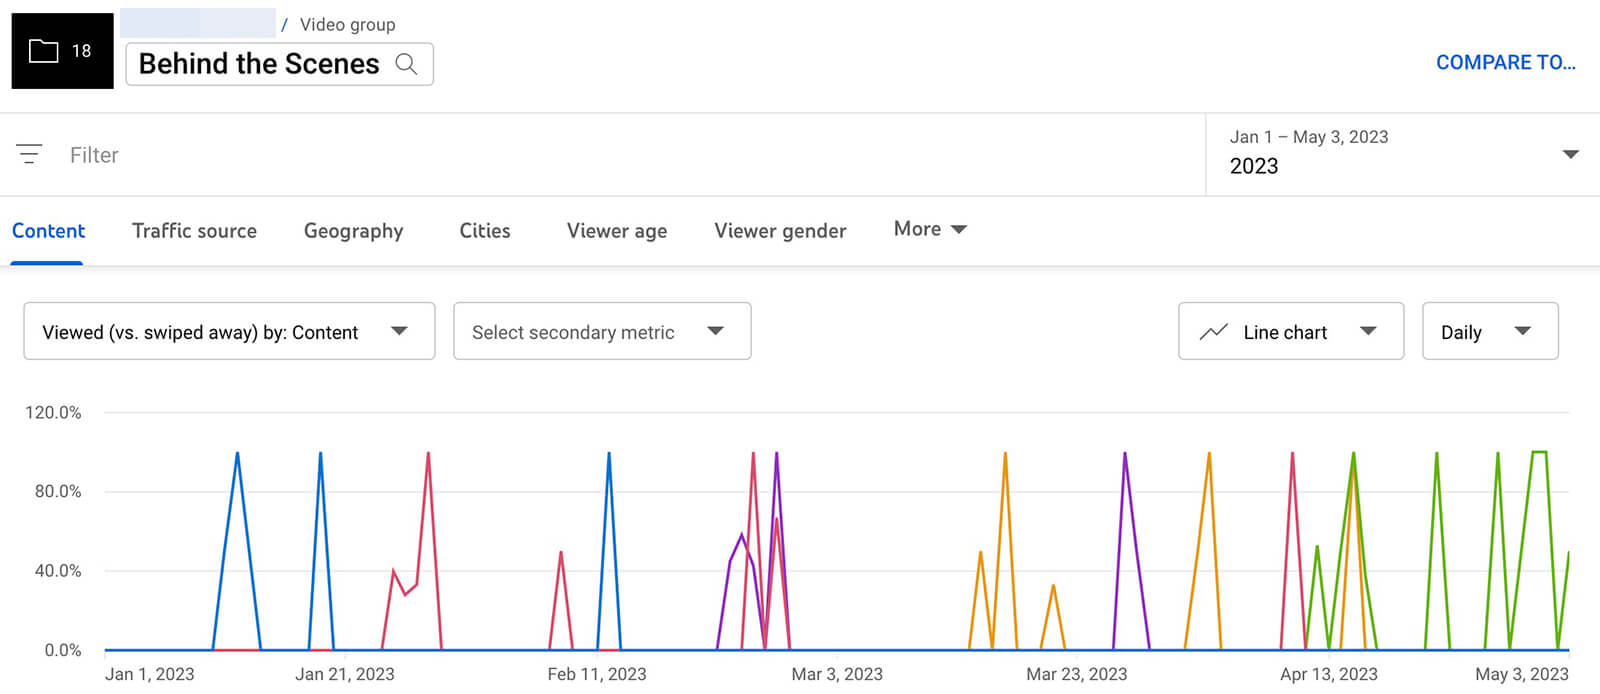
#5: Is This Content Successfully Generating Views From Clips and Remixes?
If your video groups include a lot of long-form content, you might use YouTube's Native Clips tool to make the content more digestible for your audience. You can now track the number of views and total watch time from clips for any group. If you find that clips are becoming a viable source of views for your channel, you might consider making them a more integral part of your strategy.
Monitoring remixes can also help you understand how the group of videos resonates with your target audience. If you're finding that the number of remixes is steadily climbing for the group, it's a sign that viewers are responding to your content. You can track remixes for specific videos from the main Analytics screen, where you can dive deeper into creator sentiment.
#6: How Do Trends Compare Across Groups?
Viewing reports for specific groups of videos can certainly streamline your YouTube analysis and give you actionable insights for improving your content. But with comparative Youtube channel analytics, you have the opportunity to learn even more about your video content’s performance.
Curious how a group of videos has performed over the last quarter compared to the previous quarter? Select the group you want to analyze, and then click Compare To in the upper-right corner. Then select Period-Over-Period to compare metrics over the past two quarters. You can use any of the reports we covered above in this competitive analysis—from watch time to impressions to engagement.

You can also use this tool to compare two different groups of videos against each other. After selecting a video group, click Compare To in the upper-right corner and choose a second group. Then use the reports below to see how the two groups compare in terms of average time watched, shown in feed, or other metrics that matter to your team.
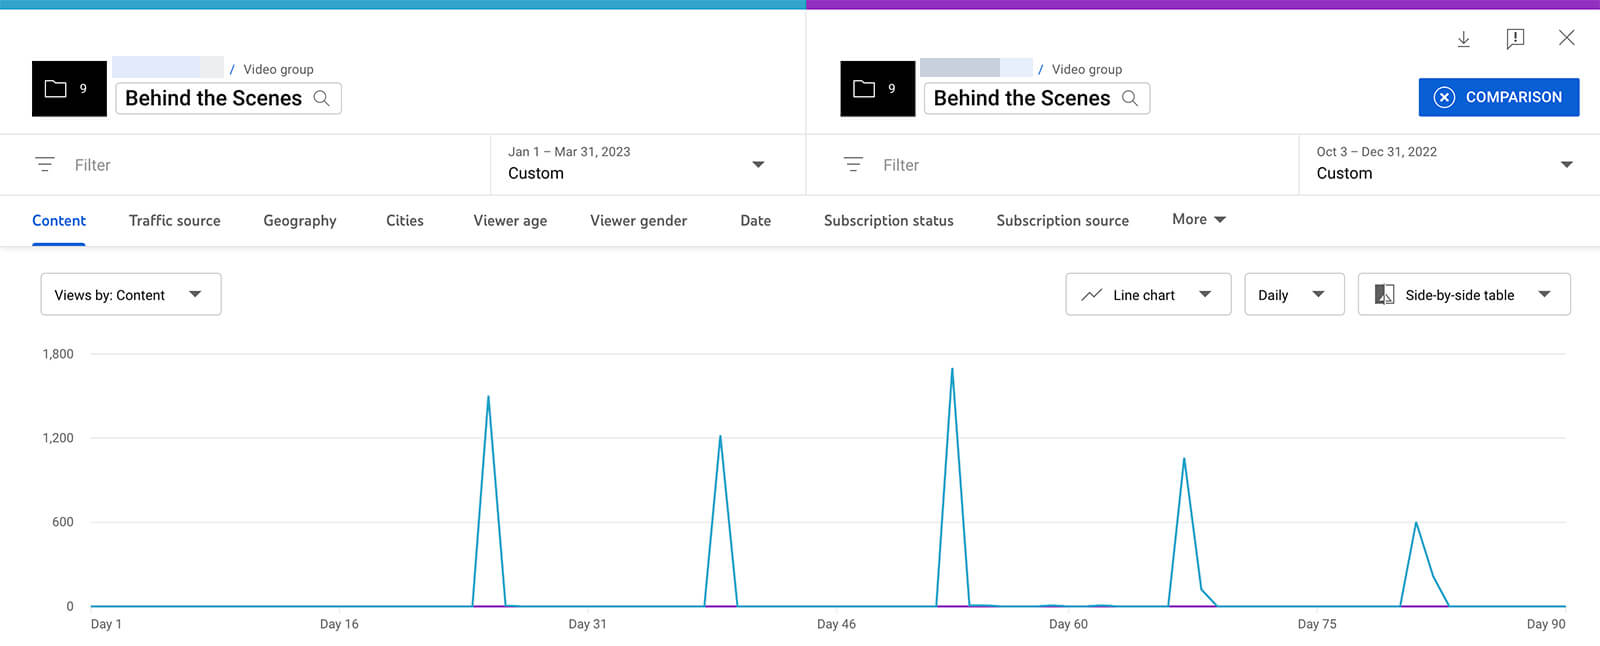
For example, you can compare results from different video formats to see which helps you reach your marketing goals most efficiently. If you compare a group of long-form videos with a group of short-form videos that cover the same topic, you can better understand what type of content delivers a higher return on investment so you know where to focus your resources.
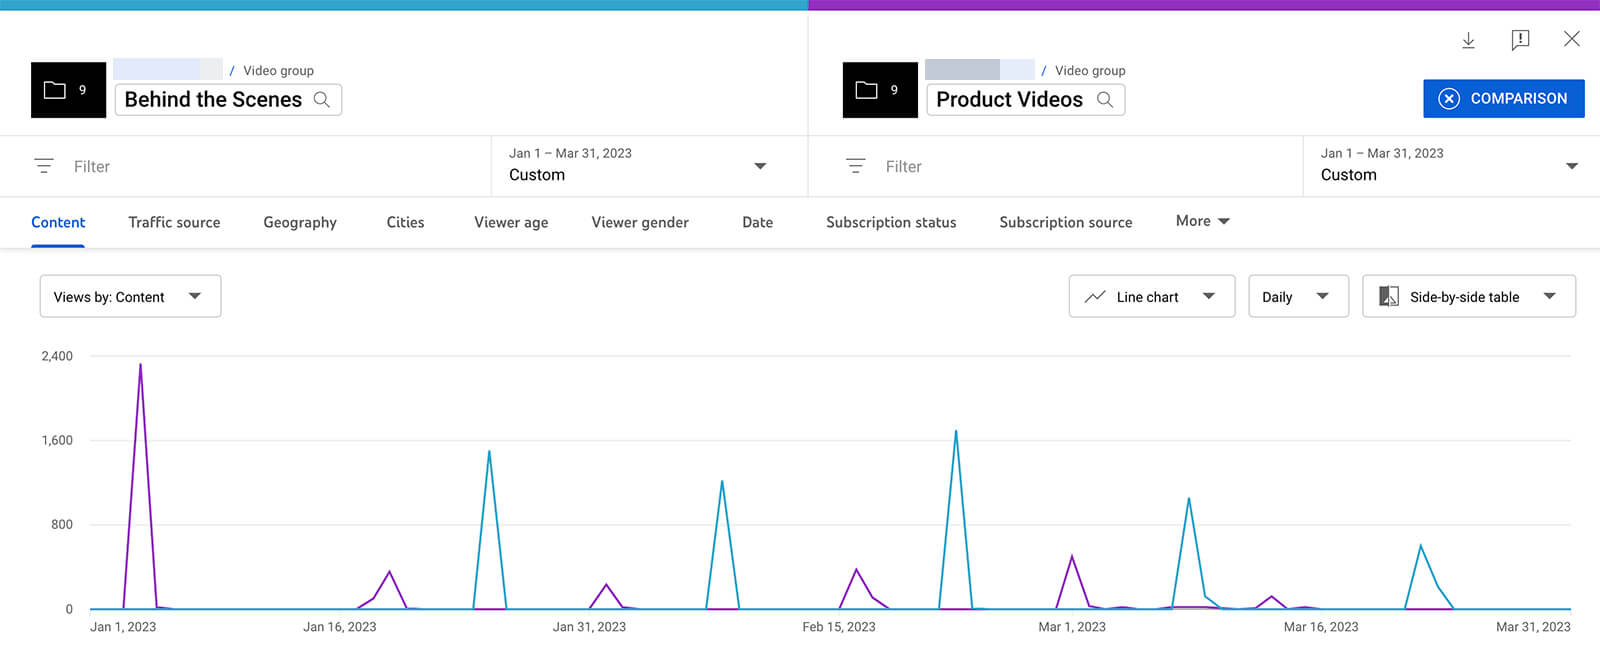
These comparative charts are also helpful if you use them to review video groups with distinct differences. For example, say you're testing a new thumbnail style or a new type of hook. By comparing a group of videos that predate the change to a group that reflects the update, you can measure the difference more accurately.
Conclusion
YouTube group analytics can be a valuable addition to your video marketing insights workflow. By creating groups that align with your campaigns, funnels, content niches, and video experiments, you can analyze performance and spot trends more easily. Then you can use your findings to adjust your YouTube channel strategy and reach more important goals.
Stay Up-to-Date: Get New Marketing Articles Delivered to You!
Don't miss out on upcoming social media marketing insights and strategies! Sign up to receive notifications when we publish new articles on Social Media Examiner. Our expertly crafted content will help you stay ahead of the curve and drive results for your business. Click the link below to sign up now and receive our annual report!
Attention Agency Owners, Brand Marketers, and Consultants

Introducing the Marketing Agency Show–our newest podcast designed to explore the struggles of agency marketers.
Join show host and agency owner, Brooke Sellas, as she interviews agency marketers and digs deep into their biggest challenges. Explore topics like navigating rough economic times, leveraging AI, service diversification, client acquisition, and much more.
Just pull up your favorite podcast app, search for Marketing Agency Show and start listening. Or click the button below for more information.

