Want more engagement, leads, and sales from your YouTube videos? Wondering how to use data to create high-performing videos?
In this article, you'll learn how to use YouTube analytics to identify successful videos you can model for similar results.

Why Data Analysis Matters to YouTube Video Performance
If you want to improve your YouTube channel's performance, you need to understand your data. YouTube Analytics is very robust. The plus side of all of this data is you can dive deep into your videos' performance and understand what's happening on a granular level. The downside is all of this data can feel a bit intimidating if you're not used to it.
So let's break it down.
Whether you're analyzing a YouTube video, a Facebook ad, or your fifth-grade science experiment, data analysis always begins with two things: An objective and a question.
As a marketer, your objective could be to generate leads or purchases, grow a retargeting audience, or increase brand awareness. The questions you ask will relate to how you're going to achieve your objective.
For example, if your objective is to grow a YouTube following for an interior designer, your questions might be:
- Are people more motivated by frustration with their current home layout or by visions of their ideal home?
- Will people respond better to a guide on how to color-coordinate their house or a guide on how to make their home feel more spacious?
- What will encourage more YouTube channel subscribers—a video that teaches people about the design process or a video that helps them get to know the designer herself?
Data analysis helps you identify what your audience does and doesn't like. You can use YouTube Analytics to answer your questions so you can keep what works, ditch what doesn't, and achieve your objectives.
#1: Identify Your Goal and the YouTube Metrics to Track
What are the primary objectives within YouTube? Video views is the most obvious one. You made a video so you want people to watch it. You could also have an objective to increase channel subscriptions or engagement, or if you have a monetized account, revenue.
Metrics are the numbers we use to measure and assess the performance of our videos. YouTube gives you a significant number of metrics but which ones you need to pay attention to depends on your objective.
Here are some key metrics for four goals or objectives:
- If you want to improve YouTube video views, track views, watch time, average view duration, and average percentage viewed.
- If you want to grow YouTube channel subscriptions, track subscribers gained and subscribers lost.
- If you want to improve YouTube engagement, track views, likes, dislikes, shares, comments added, subscribers gained, and subscribers lost.
- If you want to grow revenue from YouTube, track transaction revenue, transactions, CPM (cost per 1,000 impressions*), and RPM (revenue per 1,000 impressions*). *The M stands for mille, which is Latin for 1,000 (data analysts like to keep things fancy).
This list of metrics is hardly exhaustive. There are dozens more metrics in YouTube Analytics. The metrics listed here give you a foundation to help you understand your video and channel performance without getting overwhelmed. In this article, we'll focus on the first two goals above—video views and channel subscriptions.
Understand What Each Metric Measures
Now that we've identified some metrics for each objective, let's look at what the metrics mean, using the data below as an example.
Get World-Class Marketing Training — All Year Long!
Are you facing doubt, uncertainty, or overwhelm? The Social Media Marketing Society can help.
Each month, you’ll receive training from trusted marketing experts, covering everything from AI to organic social marketing. When you join, you’ll also get immediate access to:
- A library of 100+ marketing trainings
- A community of like-minded marketers
- Monthly online community meetups
- Relevant news and trends updates
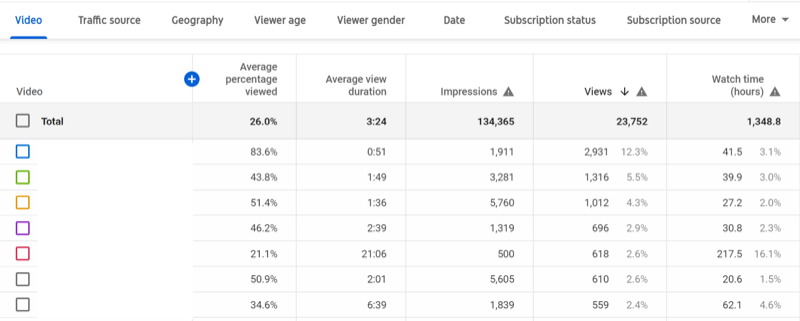
Views: The views metric is fairly straightforward: How many times was your video watched? What counts as a watch, though, depends on how long the video is. Generally, a view is 30 seconds. However, if the video is less than 30 seconds, people need to watch the duration of the video for it to count as a view.
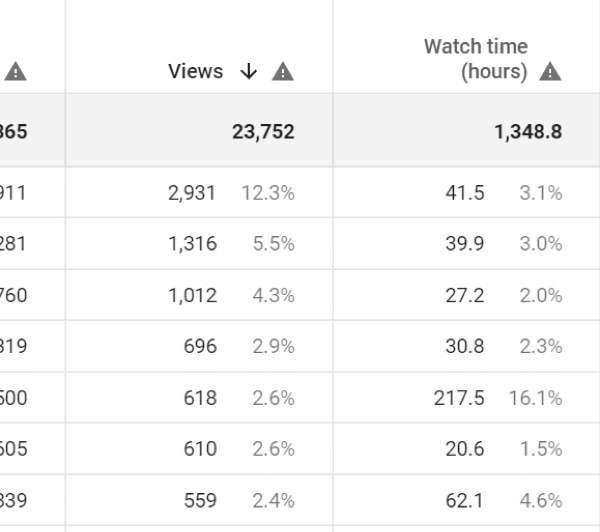
Watch time: This is the total number of hours viewers have watched. In the example chart, viewers have watched a total of 1,348.8 hours of videos. The most hours watched in a single video is 217.5 hours and the least amount watched is 20.6 hours.
Average view duration: This is the total amount of watch time divided by the total number of views. In this case, the total average view duration is 3:24. Here's the math to get to that number. There are 1,348.8 hours of watch time and 23,752 views. 1,348.8 hours x 60 minutes = 80,928 minutes. 80,928 minutes / 23,752 views = 3.4 minutes, or 3 minutes 24 seconds.
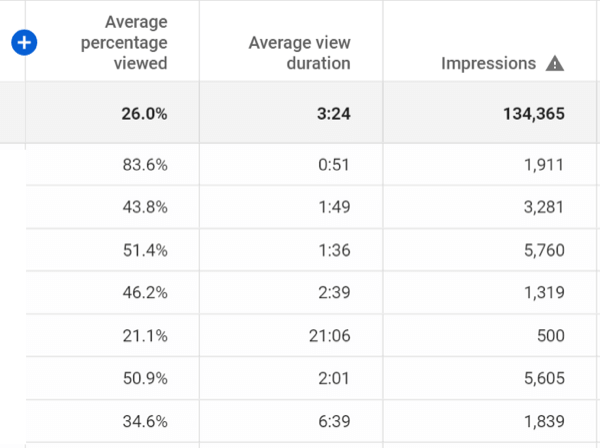
Average percentage viewed: This is the average view duration divided by the length of the video as a percentage. The chart above doesn't show the total length of the videos but you can see that the total average percentage viewed is 26%. The highest average percentage viewed on a single video is 83.6% and the lowest on a single video is 21.1%.
Subscribers gained and lost: These are people who subscribed to your channel on a particular video or who unsubscribed on that video. If they subscribe, it means they really liked what you had to say. If a subscriber bothers to unsubscribe from your channel from a certain video, that tells you the video is either off the mark for your audience or that person wasn't the right fit for your channel.
Transactions and transaction revenue: These are the total number of transactions from paid content and the total amount of money they generated. If you're eligible for the YouTube Partner Program, you can earn money with your YouTube account.
RPM and CPM: These numbers help you understand how many people need to see your content for you to earn a dollar. Again, these numbers are relevant for accounts that are monetized as part of the YouTube Partner Program.
#2: How to Access YouTube Analytics and Metrics
There are multiple ways to view analytics in your YouTube account. Each view has a different level of granularity.
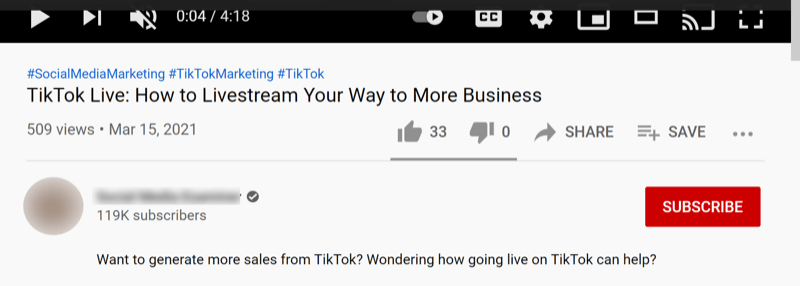
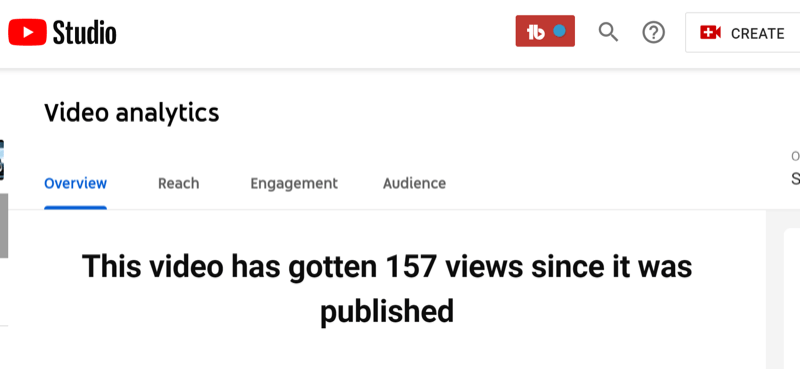
The simplest data is below each video. Here, YouTube shows you views, likes, dislikes, comments, and channel subscribers. The video below was viewed 509 times, 33 people liked it, and no one has disliked it. You can also see that the channel has 119,000 subscribers. Comments are turned off so we don't see how many comments there are. These metrics are visible to the public.
Videos in your account will have two blue buttons below the on-video metrics: Analytics and Edit Video.

Click the Analytics button to go into Video Analytics in your YouTube Studio. In Video Analytics, you get more detailed information about your audience and how they engage with your content.
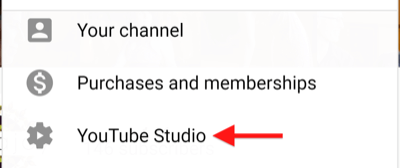
You can also go directly into YouTube Studio through the main drop-down menu from any page in YouTube. Click your logo icon in the upper right-hand corner and select YouTube Studio from the menu.
The main dashboard of YouTube Studio gives you a few more analytics and a quick overview of your channel's performance.
You can get detailed analytics about your channel and videos in Channel Analytics. To access Channel Analytics, click Analytics in the left-hand menu.

Channel Analytics gives you a fair amount of detail but you can get very detailed reporting in Advanced Mode. To access advanced mode, click the blue button in the top-right corner (below your account icon).

In advanced mode, you can create customized tables that show you just the data you need to answer your questions and correctly assess video performance. You can do a comparative analysis over time or a content analysis to see how specific videos perform compared to your whole channel. Advanced mode allows you to do in-depth data analysis.
Create a Custom Table of Analytics Metrics in Advanced Mode
To add a metric, click the blue button with the white plus sign to bring up the list of available YouTube metrics. Select the metrics you want to display.

To remove a YouTube metric from your table, hover over the metric name to bring up the three dots in the left side of the field.

Discover Proven Marketing Strategies and Tips
Want to go even deeper with your marketing? Check out the Social Media Marketing Podcast! Publishing weekly since 2012, the Social Media Marketing Podcast helps you navigate the constantly changing marketing jungle, with expert interviews from marketing pros.
But don’t let the name fool you. This show is about a lot more than just social media marketing. With over 600 episodes and millions of downloads each year, this show has been a trusted source for marketers for well over a decade.

Click the three dots to bring up the pop-up menu. Click Hide Metric to remove the metric from your table.

You can use the list of objectives/metrics at the beginning of this article to create custom tables that zero in on the data most relevant to your objective.
#3: How to Identify YouTube Videos That Generate Views
Now that you know what some of the YouTube metrics mean and where to find your data, it's time to analyze it.
Like I said earlier, data analysis starts with an objective and a question. There is a ton of data in YouTube Analytics so it's easy to fall down a rabbit hole of numbers. Your objective and questions will keep you focused on the data that matters and prevent you from getting overwhelmed.
The other thing to remember with data analysis is that no data point lives in a vacuum. You always want to look at data points in relation to each other.
Let's go back to the table we were looking at earlier.

This table is sorted by views. If your objective is video views, then Views is a very important metric but it's not the only one you want to pay attention to. Remember, a view may be only 30 seconds—which may or may not be a meaningful view. So the next metric you'll want to look at is average view duration, which tells you how much of the video people are actually watching. If you have 1,000 views on your 10-minute video but everyone drops off after 45 seconds, you don't have a successful video.
The first video listed has 2,931 views and an average view duration of 51 seconds. To determine if 51 seconds is good or bad, you need to know how long the video was. That's where average percentage viewed comes in. You can see that the average percentage viewed for this video is 83.6%. That means most people are watching the entirety of the video, which is about a minute long. That's a successful video!

Let's take a look at another video on the list. The video below has an average percentage viewed of only 21.1%, which at first glance makes it look like it performed very poorly compared to the video above.
However, looking at the next column over, you can see that the average view duration is a whopping 21 minutes 6 seconds. That means people watched over 21 minutes of a 1-hour 40-minute video. The total views are lower but the quality of those views is significantly higher. People spent a lot of time with the channel as a result of this video.

That begs the question, what happened at the 21-minute mark? Why did people drop off at that point?
To answer these questions, you need to dive deeper into the video's analytics.
To go into Video Analytics, hover over the name of the video to bring up the pop-up menu. Select the graph icon to see the analytics overview for that video.

This brings you into the Video Analytics for the video you're analyzing. Scroll down to Key Moments for Audience Retention. Here, you can see how your audience performed over the duration of the video.
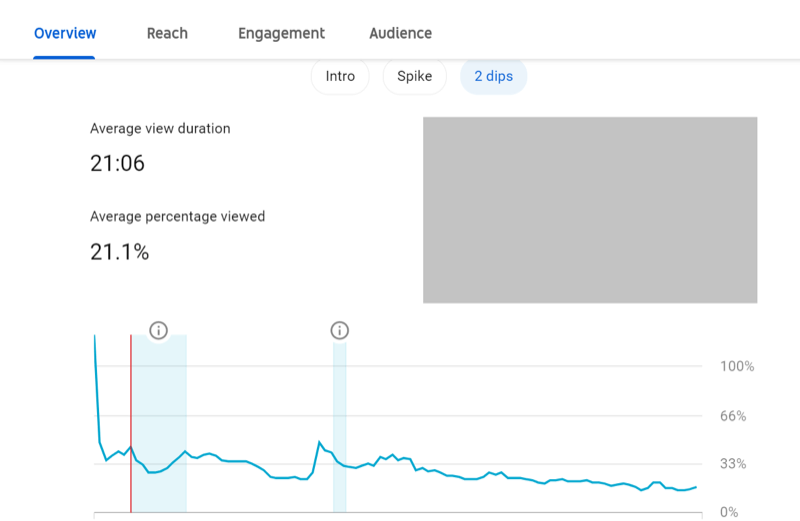
This data gives you more clarity about when people drop off and you can start to understand why. There's a massive drop-off between 0 and 2 minutes. These are people who clicked on the video and immediately decided it wasn't for them. However, 35% of people kept watching.
There's a dip around 9 minutes and another dip that starts at about 26 minutes, which means people dropped off at these points. However, at 37 minutes, there's a spike. How did people jump back into the video at this point? They didn't. These are people rewinding the video to rewatch that section.
After the initial drop-off, the number of people watching holds fairly steady, about 30%-35%. A few people leave but the ones who stay are so engaged that they're rewatching sections.
However, at about 53 minutes, you see a steady decline begin. The number of viewers goes from 36% of the original viewers to only 17% who make it through to the end.
What does this tell you?
The objective of this YouTube video is to get people to watch. This video gets 35% of viewers to stay on for almost an hour and rewatch sections. The data suggests this video isn't for the masses; however, for a core group of people, the information in the video was highly relevant. These people are your target audience.
This video serves the video views objective very well. The target audience really watched the video.
One question that you may want to answer, though, is, “How long do your videos need to be?” In this example, the data indicates that you lose target audience by the 1-hour mark. They'll stay with you if the information is good for quite a long time, but if you're going to put a class on YouTube, you should keep it under an hour—40-50 minutes max.
#4: How to Identify Videos That Generate Channel Subscribers
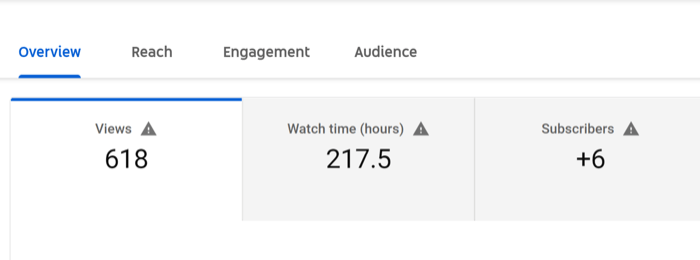
Let's say your objective is channel subscriptions. This video has only yielded six channel subscriptions so it's not very effective for growing your channel following. You need to look at other videos on the channel to identify what's effective for channel subscriptions.
Data will help you identify two things for your channel subscriptions objective:
- Which videos on your channel yield the most subscriptions?
- How can you optimize the performance of your existing videos to yield more subscriptions?
To identify the videos that yield the most subscriptions, go into Advanced Mode and create a table that shows you subscribers gained, subscribers lost, average view duration, and views. Double-click on subscribers gained to sort your report.

Once you've identified your highest-converting videos, you want to answer the question, “How long are my most effective videos for acquiring new followers?”
You can see the average view duration in the report above is only 44 seconds. That means if your objective is to grow your following, you want to create shorter videos. You can now use this information to plan future content.
But all hope isn't lost with your long video. You can use data to optimize your video and improve the number of subscriptions this video yields.
You have two more questions that you want to answer to optimize your video's performance:
- What calls to action (CTAs) do you need to get people to subscribe to your channel?
- When do you need to place those CTAs in your video?
The 35% of people who kept watching lasted a good long while. You know they're in your target audience but they do eventually start to drop off. If you want this video to grow your channel following, you need to place your CTAs before they stop watching. You can't re-record the video but you can add a card inviting people to like your channel right before the drop-off points.
In this case, you'd want to put a CTA to like the channel before the dips at 9 minutes, 26 minutes, and the final decline at 53 minutes. You'd also add a CTA at the end of the video because the 17% who stayed to the end really loved what you had to say.
To identify the best CTAs, test language on these cards to see which is more effective for getting people to subscribe to your channel. In future videos, you can also test including the invitation to subscribe in the script of the video. This testing will help you answer what CTAs you need to get people to subscribe to your channel. And you can use your data to determine your winners.
Conclusion
When analyzing data for your YouTube videos, you need to be clear on what your objectives are and what questions you need to answer. Your objective and questions will tell you which YouTube metrics you need to pay attention to.
YouTube Analytics is a robust tool but it can also be overwhelming. It may not feel like it, but advanced mode is your friend. The ability to customize tables means you can cut out the data that's not relevant and focus on the essentials. This is how you identify what works so you can optimize performance and achieve your objectives.
What do you think? Are you inspired to look at your YouTube analytics in a new way? Share your thoughts in the comments below.
More articles on YouTube marketing:
- Discover five ways to generate warm leads from your YouTube channel.
- Explore a four-block framework to quickly edit and produce quality YouTube video every time.
- Learn how to develop a YouTube video strategy to grow your business.
Attention Agency Owners, Brand Marketers, and Consultants

Introducing the Marketing Agency Show–our newest podcast designed to explore the struggles of agency marketers.
Join show host and agency owner, Brooke Sellas, as she interviews agency marketers and digs deep into their biggest challenges. Explore topics like navigating rough economic times, leveraging AI, service diversification, client acquisition, and much more.
Just pull up your favorite podcast app, search for Marketing Agency Show and start listening. Or click the button below for more information.

