Should you be using more short-form video on YouTube? Wondering where to find analytics for YouTube Shorts and Remix short-form video?
In this article, you’ll learn how to analyze performance on YouTube Shorts and Remix content.
How to Analyze YouTube Shorts Content
First, let’s look at the built-in analytics for your YouTube Shorts. Here are eight places to see YouTube Shorts stats in YouTube Studio.
#1: See Broad YouTube Shorts Metrics in the Channel Overview
Open YouTube Studio and select the Analytics tab. You’ll see a channel overview showing views, watch time, and subscribers over the past 28 days. To adjust the timeframe, use the drop-down menu in the upper-right corner.
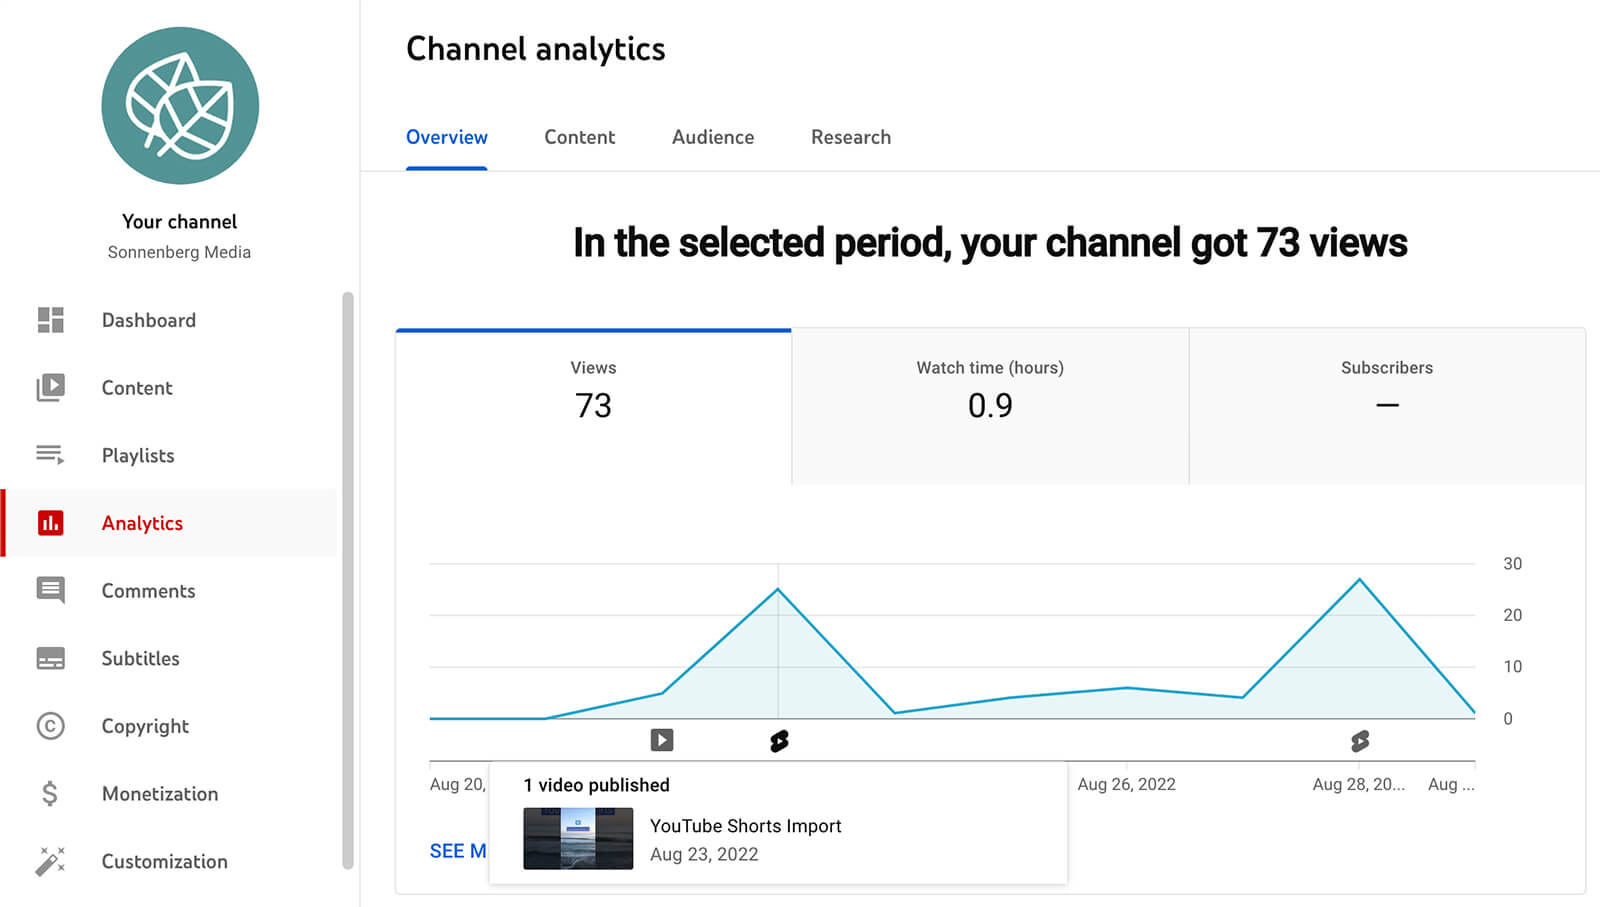
Scan the chart on each tab to see when these metrics spiked. In many cases, you can easily trace the activity back to Shorts. Click the Shorts icons along the bottom of the charts to see which videos you published on high-activity days.
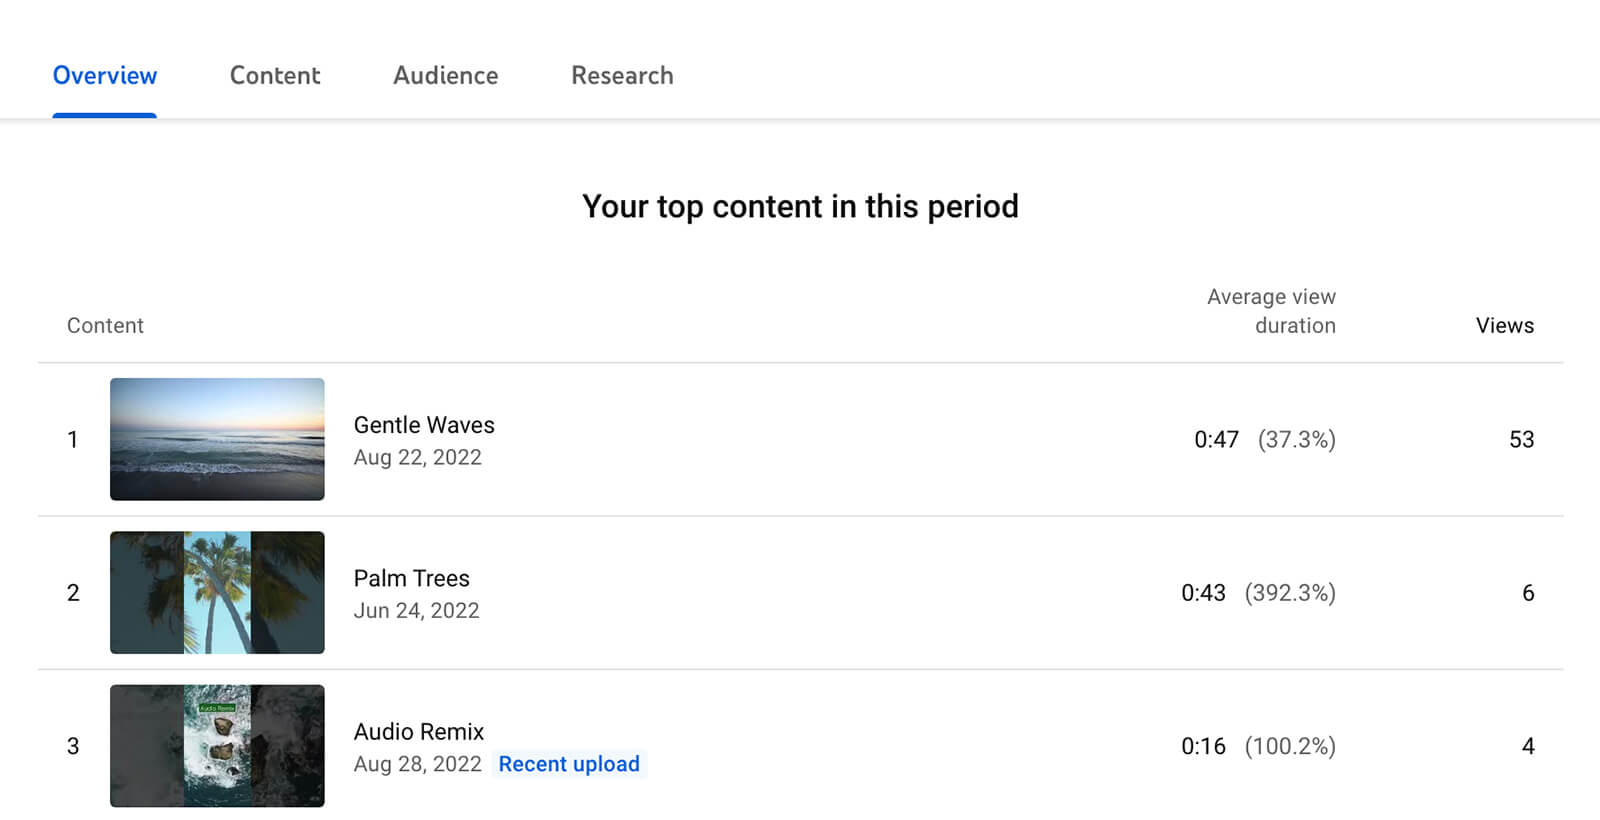
For an overview of your channel’s top content, scroll down to see a list that ranks YouTube videos by view metrics. Although this list helps identify top-performing content quickly, it doesn’t separate the shorts format from long-form video.
#2: Use Filters to See Only YouTube Shorts Analytics
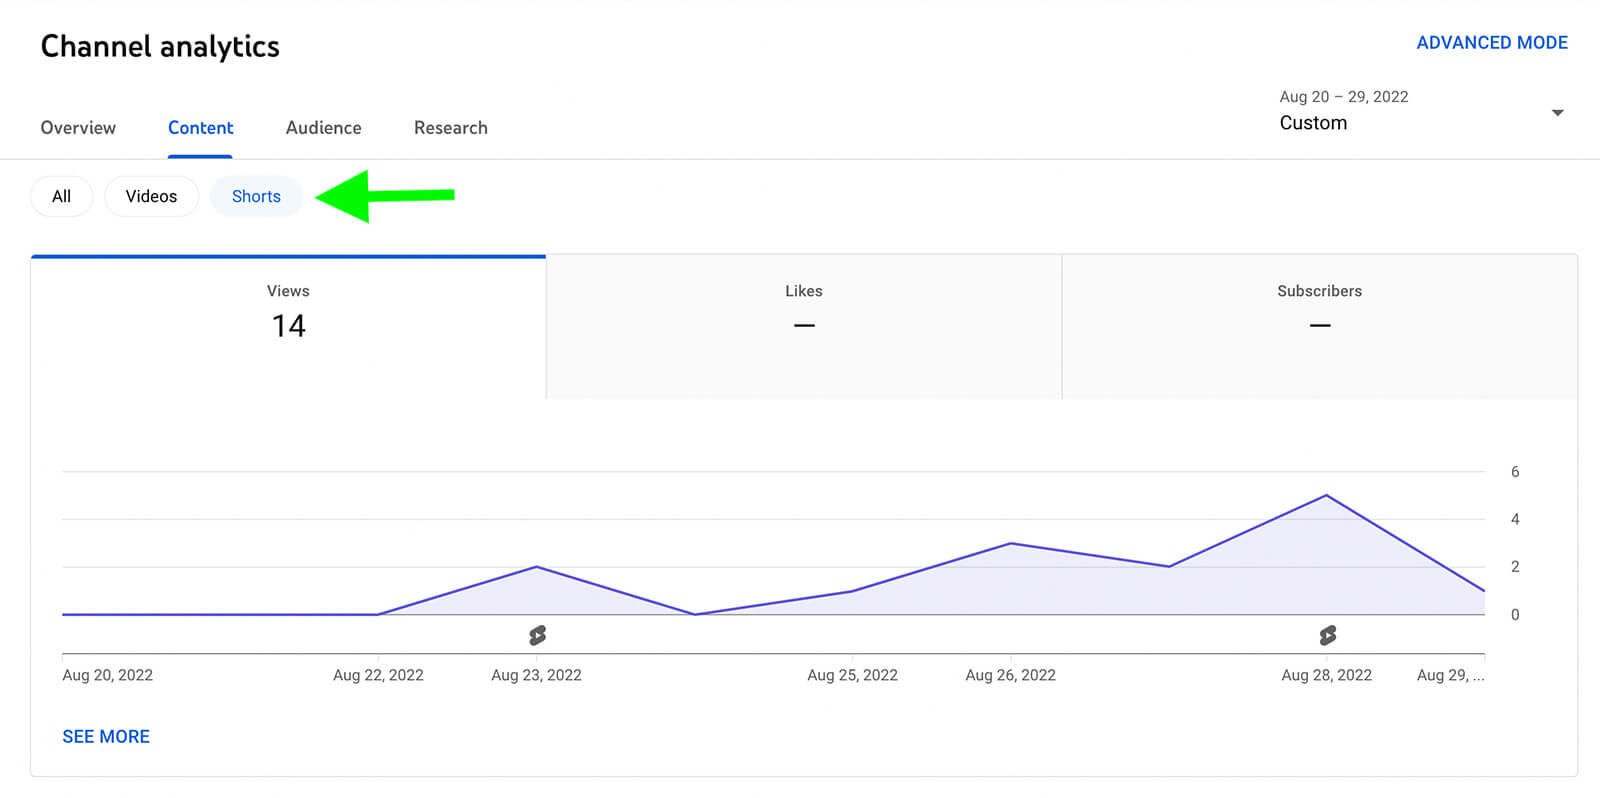
To focus your analysis on Shorts, click the Content tab on the analytics dashboard. If your channel publishes shorts exclusively, you won’t see a content breakdown. But if you publish a mix of shorts and long-form video, you’ll have the option to view Shorts analytics only. Here, you can see a breakdown of views, likes, and subscribers just for Shorts.
Curious where viewers find your shorts in the first place? Scroll down to the How Viewers Find Your Shorts section. Here you can see whether viewers find your content through your channel page, YouTube search, suggested videos, or other sources. If search, playlists, or suggested videos drove traffic, you can see details for each.
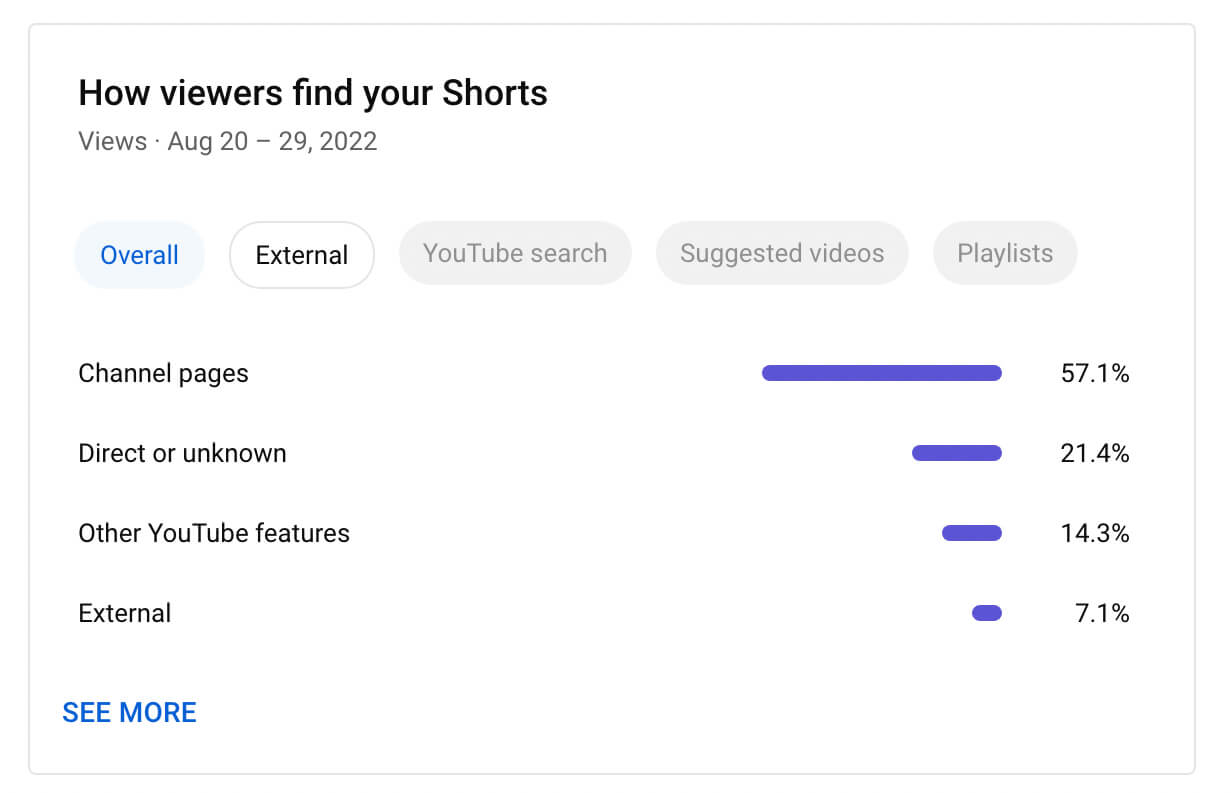
If you want more viewers to see your content, this data is incredibly helpful. It reveals which suggested videos and search queries are driving traffic to your shorts so it can help you understand what viewers are interested in and what they’re searching for.
#3: See Top YouTube Shorts Analytics
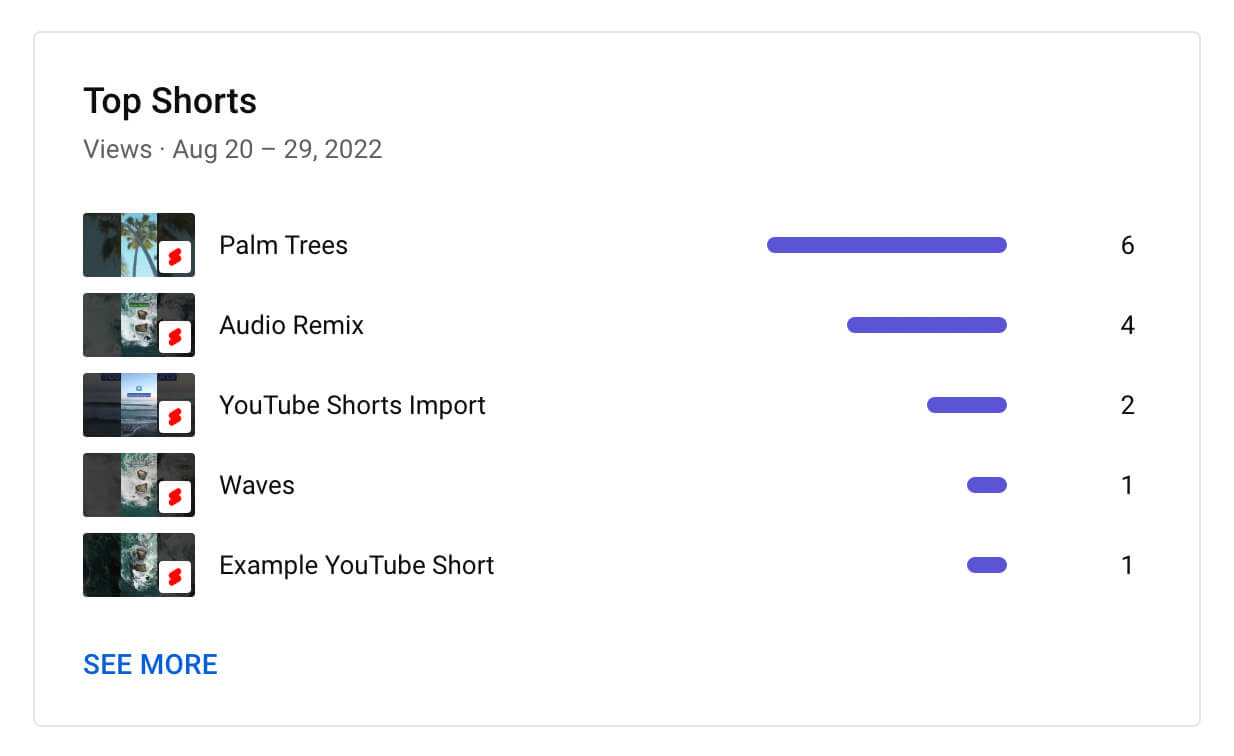
Want to identify your most popular shorts? On the Content tab, look for the Top Shorts section. Since it ranks your short-form videos by view metrics, you can easily spot your best-performing shorts.
Select any video to see more in-depth analytics.
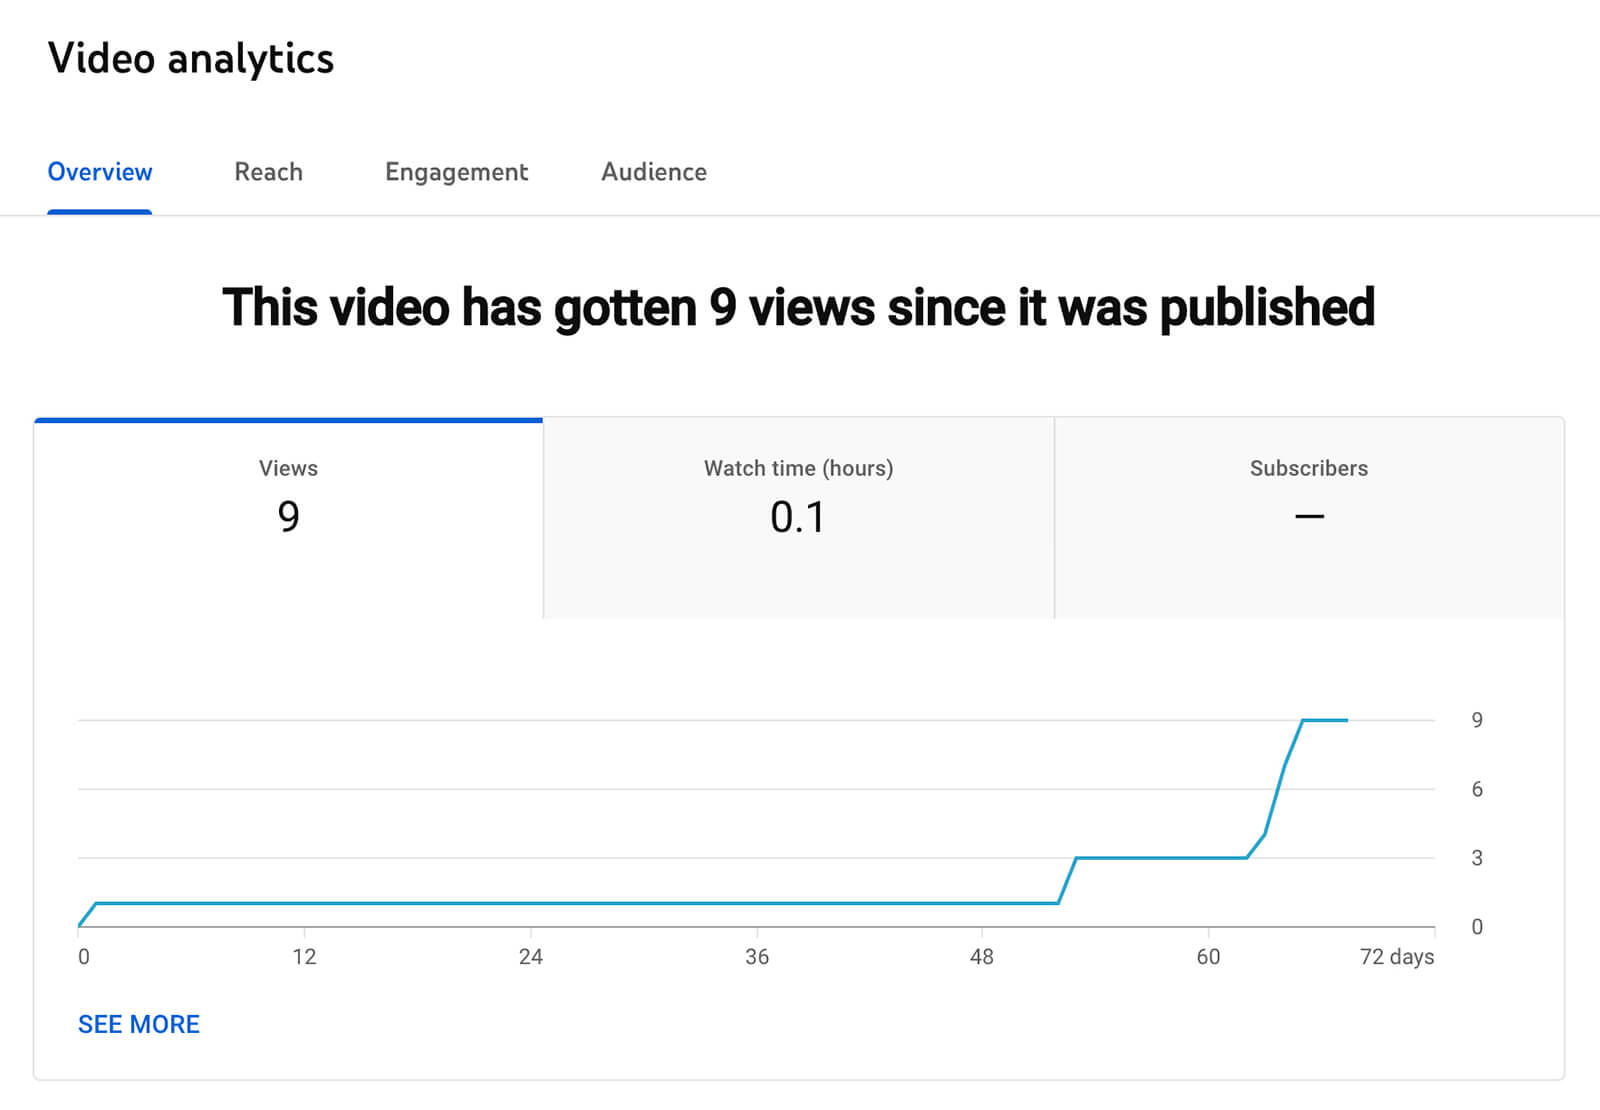
On the Video Analytics page, you can see tons of data for individual shorts including reach, engagement, and audience metrics. Here you can learn how views have increased over time so you can pinpoint what drove any spikes in activity.
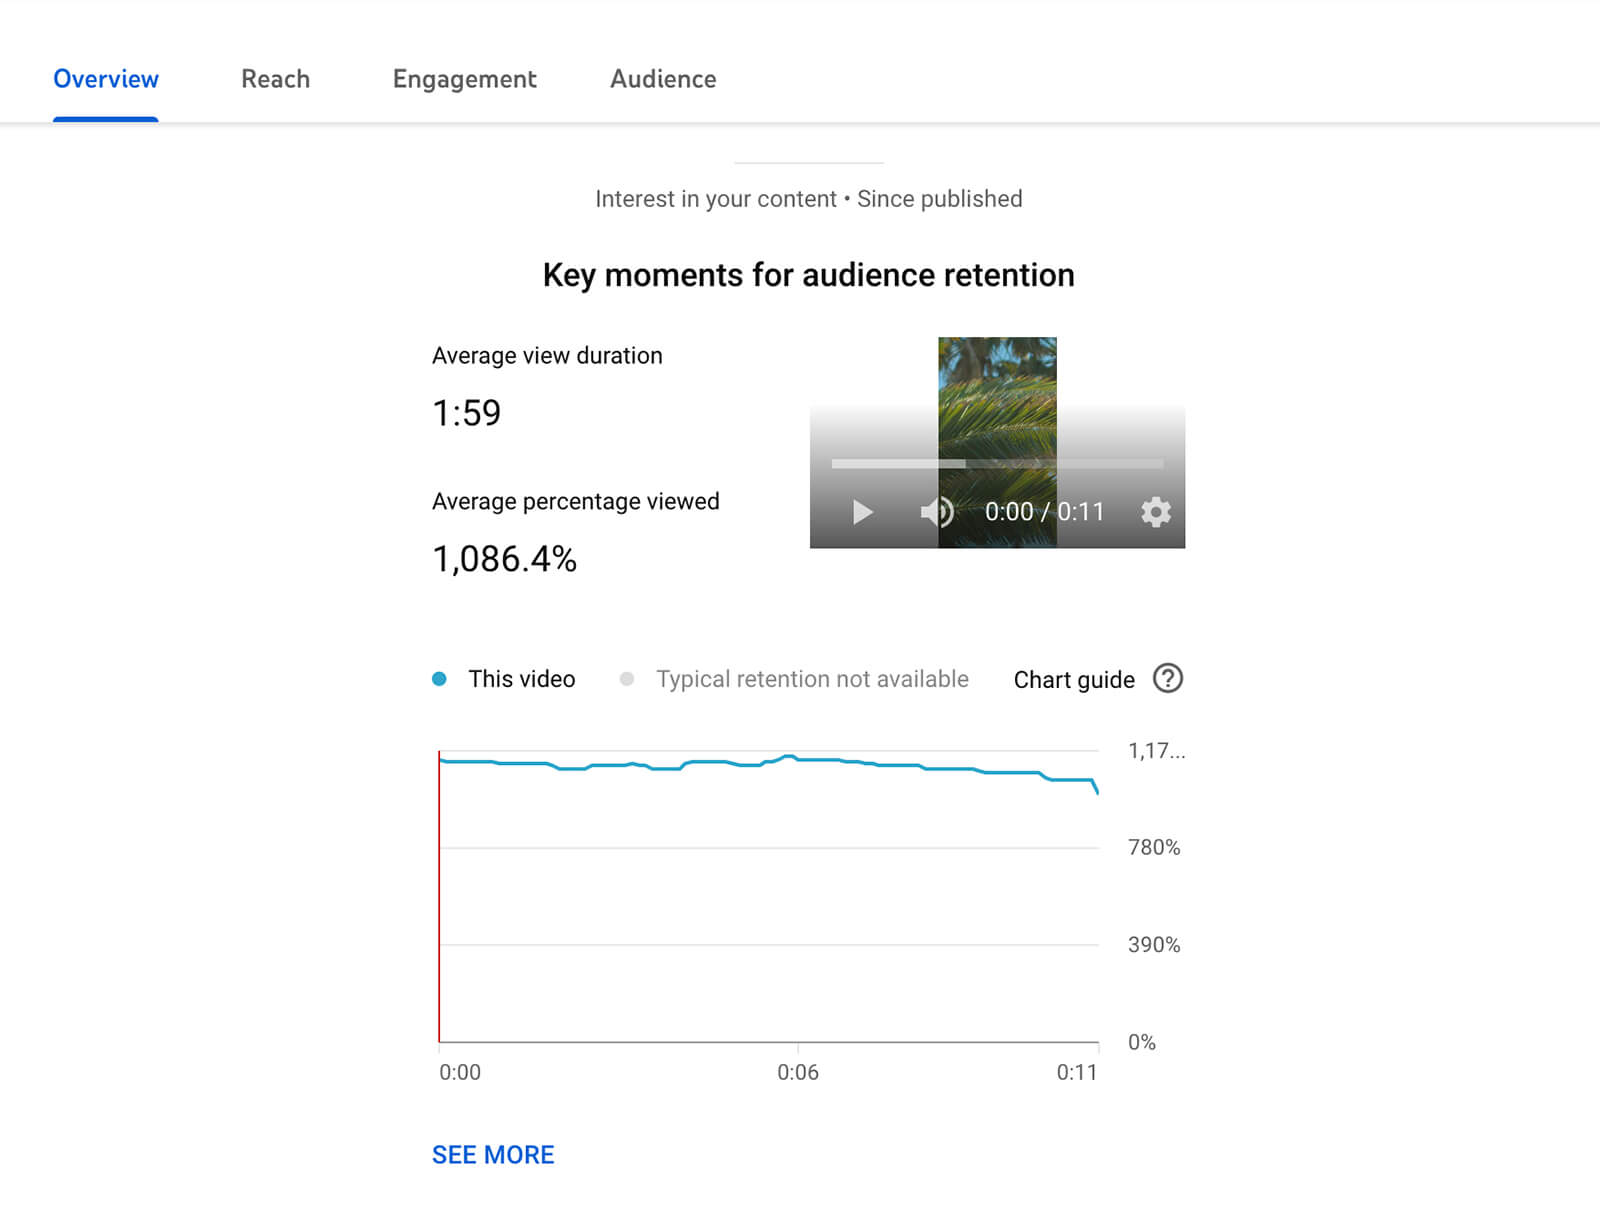
Wondering when viewers typically scroll away from your shorts? YouTube Studio has audience retention data for each short so you can gauge how long and what percentage of your shorts viewers tend to watch. Over time, the dashboard calculates typical retention values to help you set benchmarks.
#4: See YouTube Shorts Reach Analytics
Select the Reach tab for even more helpful data. Here you can see the impression click-through rate and unique viewer metrics for each short. This data can help you understand the rate at which viewers are tapping through to watch your shorts and what percentage are repeat viewers.
Get World-Class Marketing Training — All Year Long!
Are you facing doubt, uncertainty, or overwhelm? The Social Media Marketing Society can help.
Each month, you’ll receive training from trusted marketing experts, covering everything from AI to organic social marketing. When you join, you’ll also get immediate access to:
- A library of 100+ marketing trainings
- A community of like-minded marketers
- Monthly online community meetups
- Relevant news and trends updates
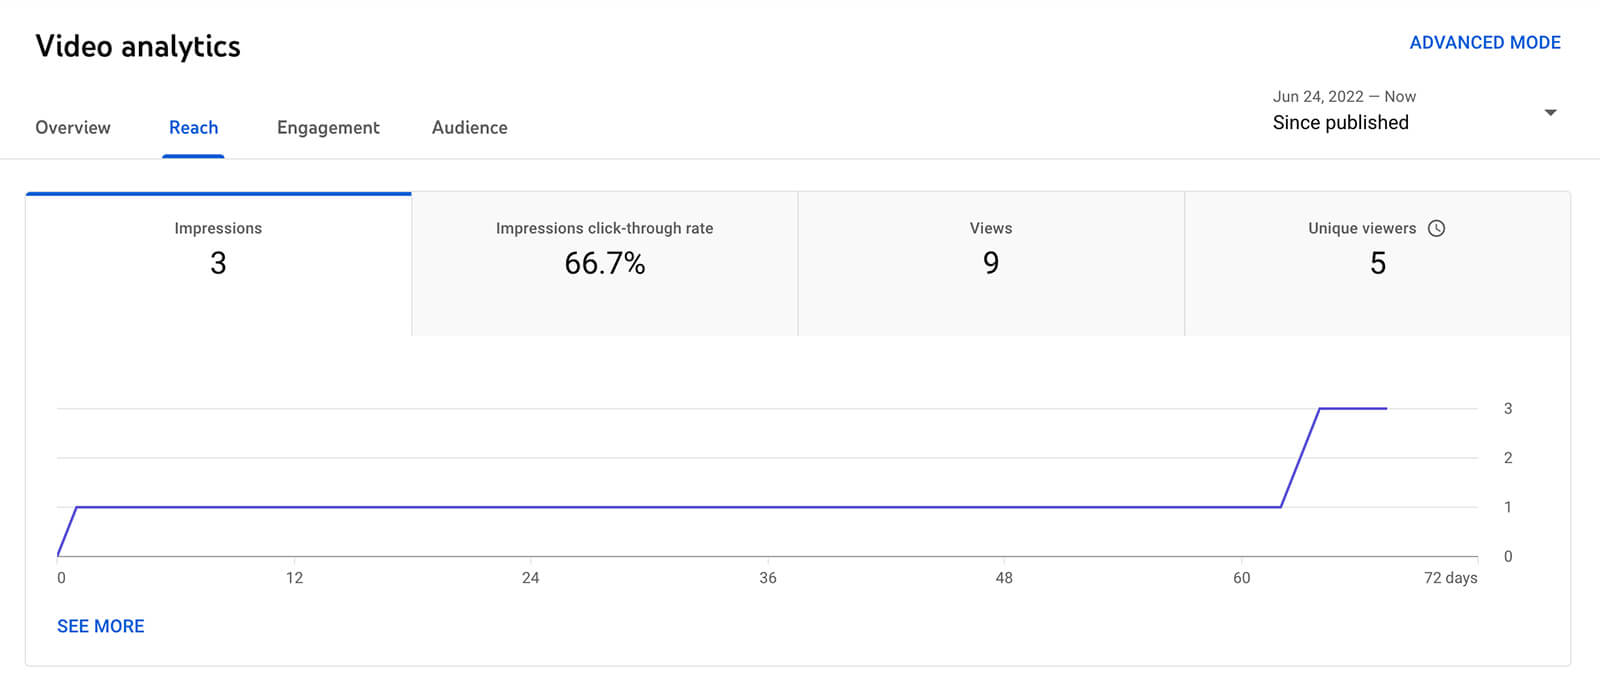
Scroll down on the Reach tab for more details on how viewers find your content. Here you can see a How Viewers Find This Short panel for the individual video. This data is ideal for understanding how viewers find your channel’s most popular shorts so you have the potential to replicate the success of your top content.
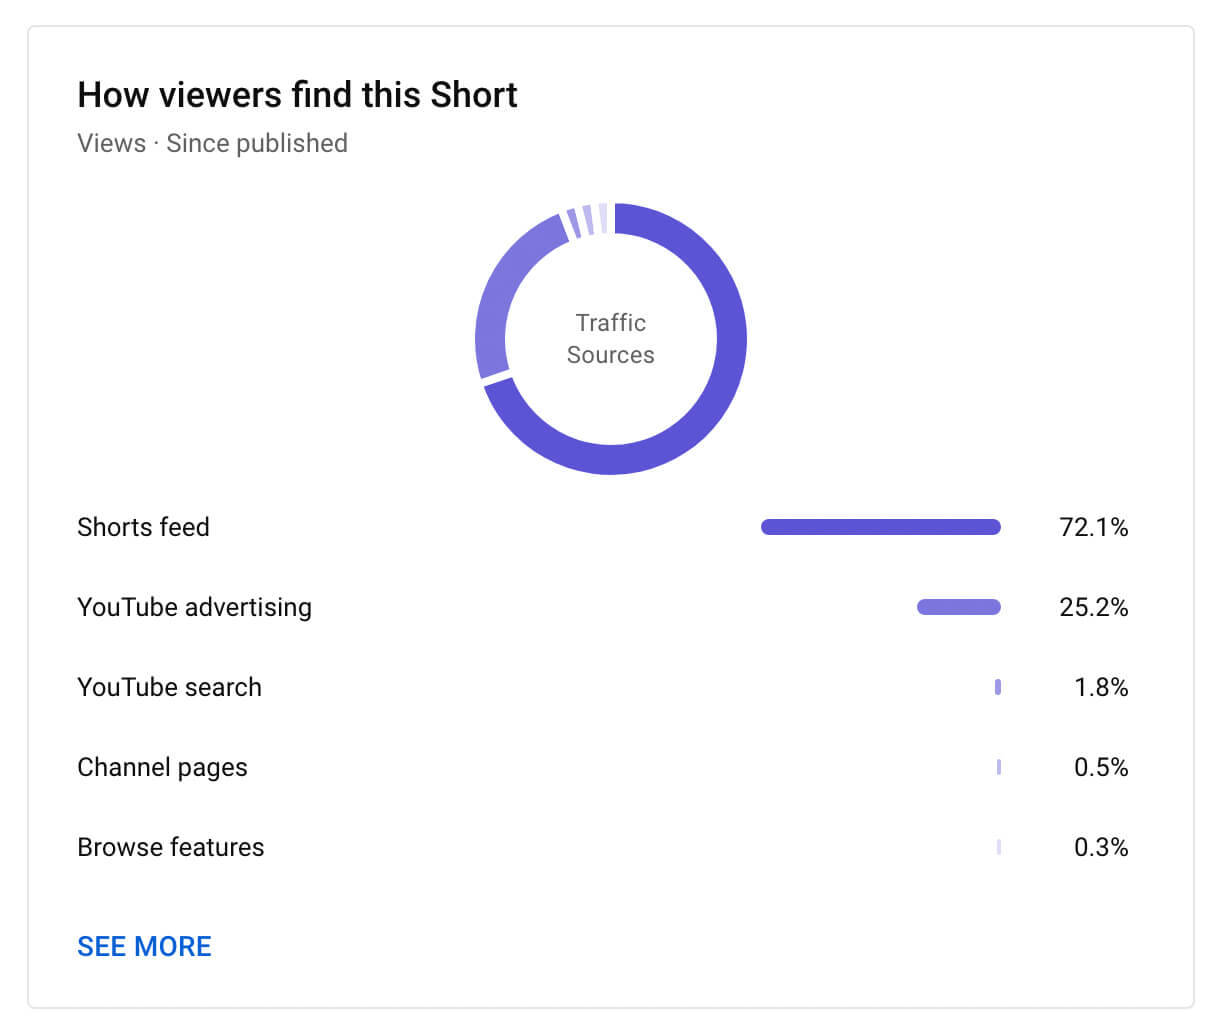
If your shorts have generated enough data, YouTube Studio may show further details for traffic sources. For example, in some cases, you can see search queries, suggested videos, playlists, and external sites where viewers found your short.
#5: See YouTube Shorts Audience Engagement Analytics
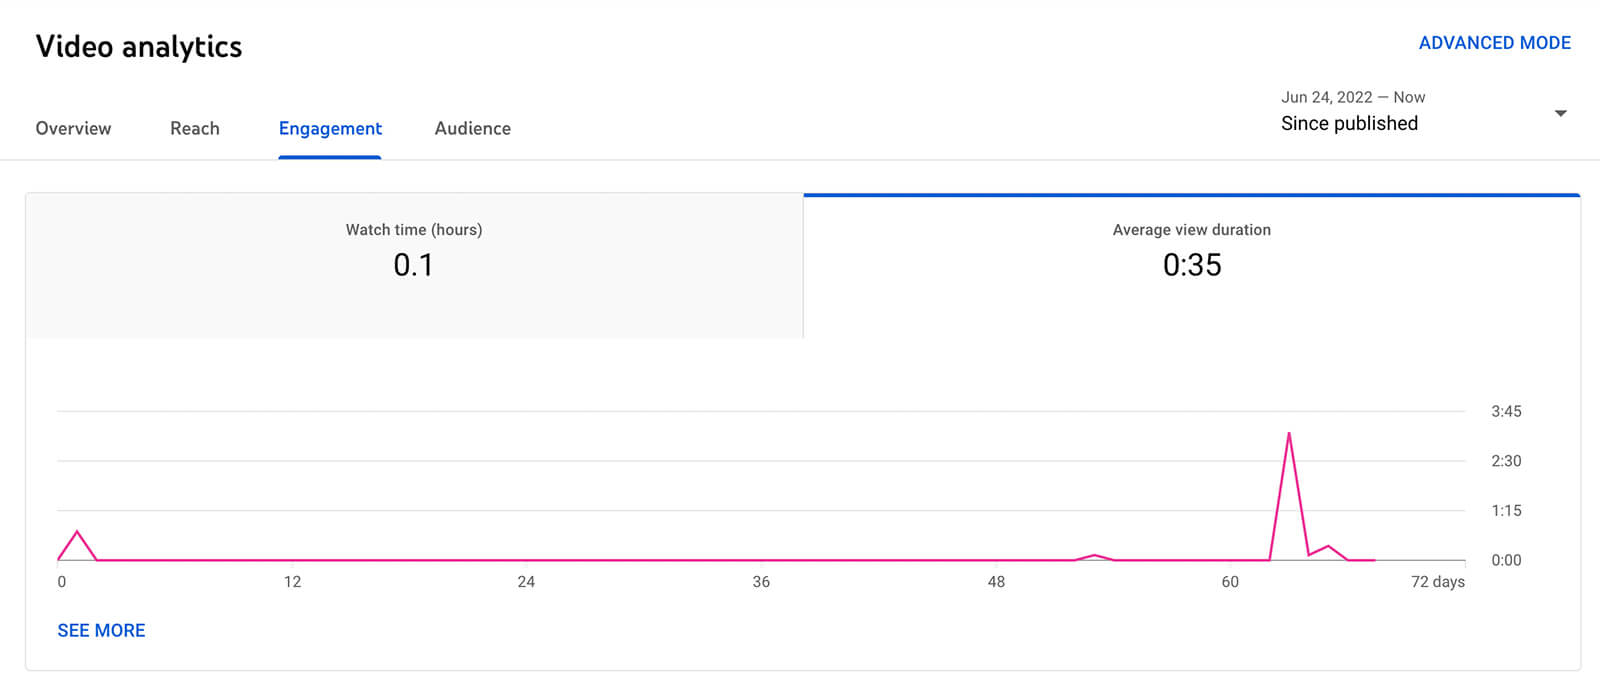
To learn how viewers have interacted with your short, click to go to the Engagement tab. Here you can see total watch time and average view duration for your short including trends over time.
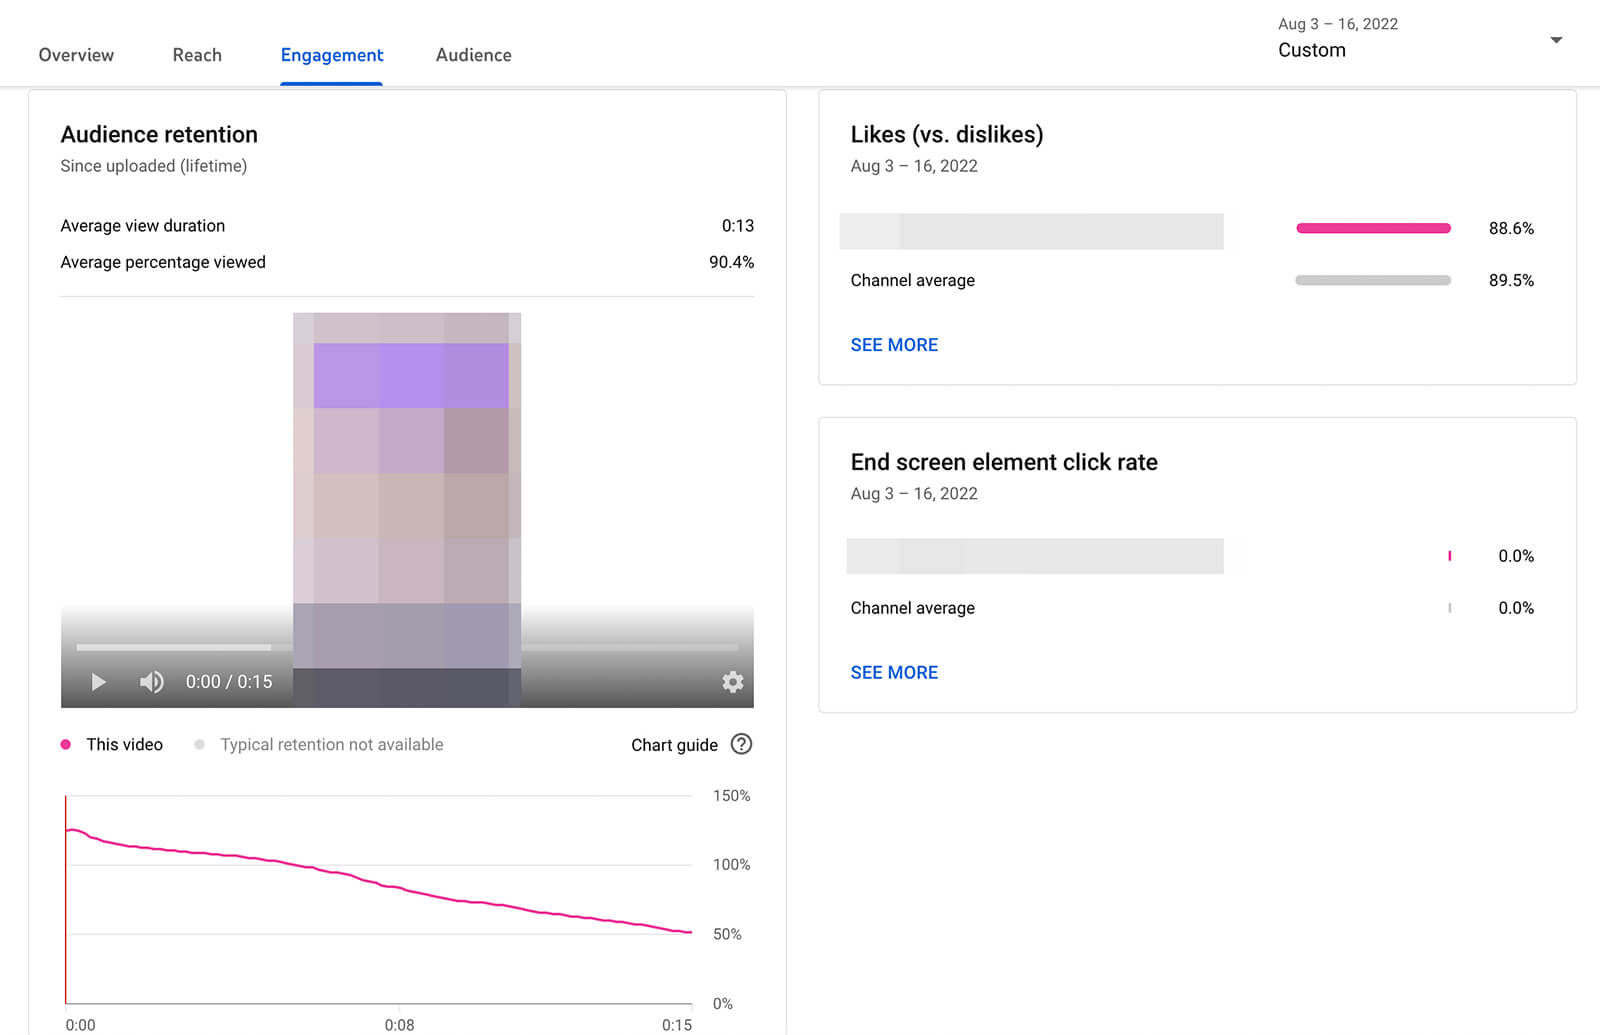
Scroll down to see audience retention data, including the average percentage viewed and a chart showing when viewers typically drop off. This audience retention data is great for figuring out how to hook viewers and prevent them from scrolling away.
Does your short have a ton of views but relatively low audience retention? Take a closer look at this chart to pinpoint where viewers tend to drop off. Then review that timestamp in your short to identify why viewers scrolled away.
The Likes (vs. Dislikes) panel is also helpful for analyzing how viewers reacted to your short. YouTube Studio automatically benchmarks like vs. dislike percentage for your channel so you can see how each short compares to your channel’s average.
#6: See YouTube Shorts Audience Analytics
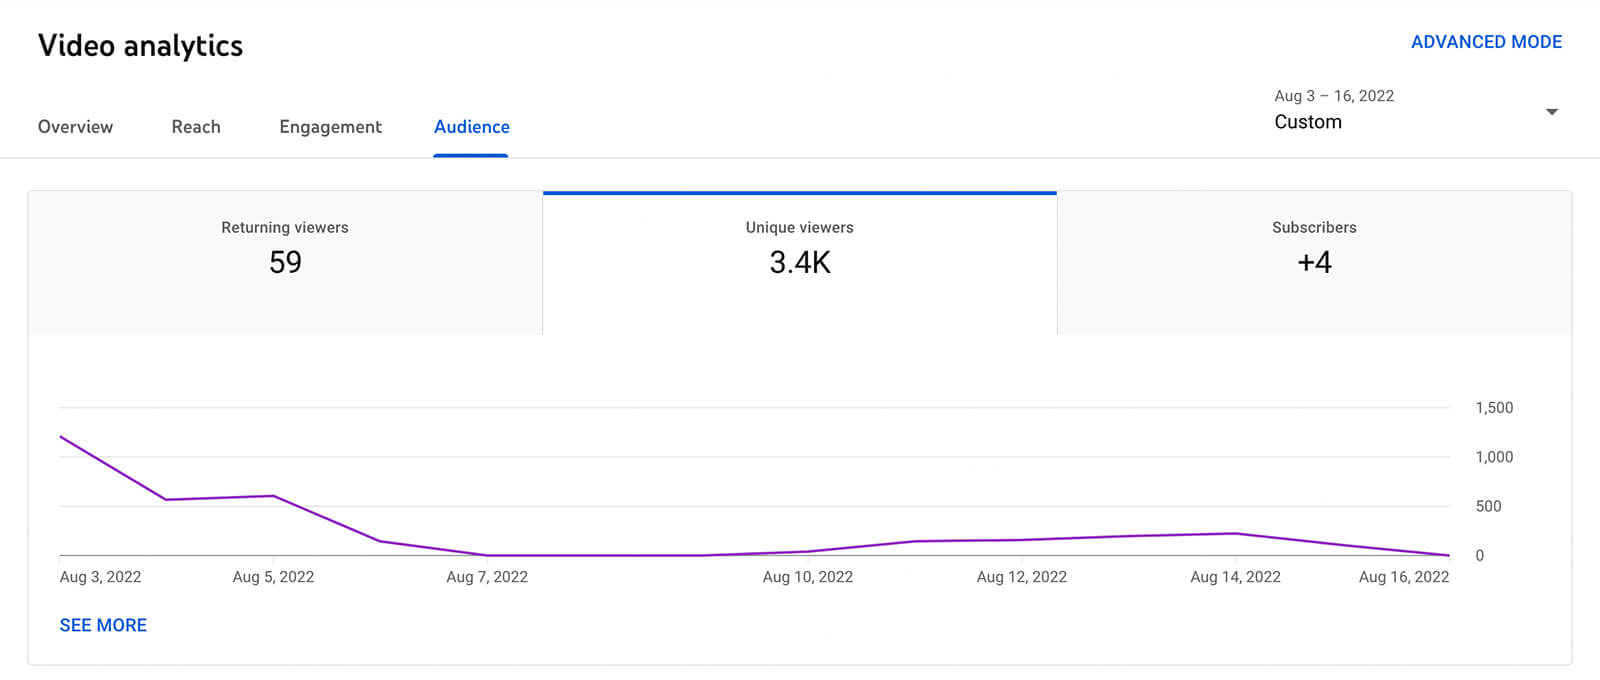
Want to know whether your shorts are bringing in new viewers or attracting return viewers? Click to go to the Audience tab, which charts returning viewers, unique viewers, and subscribers.
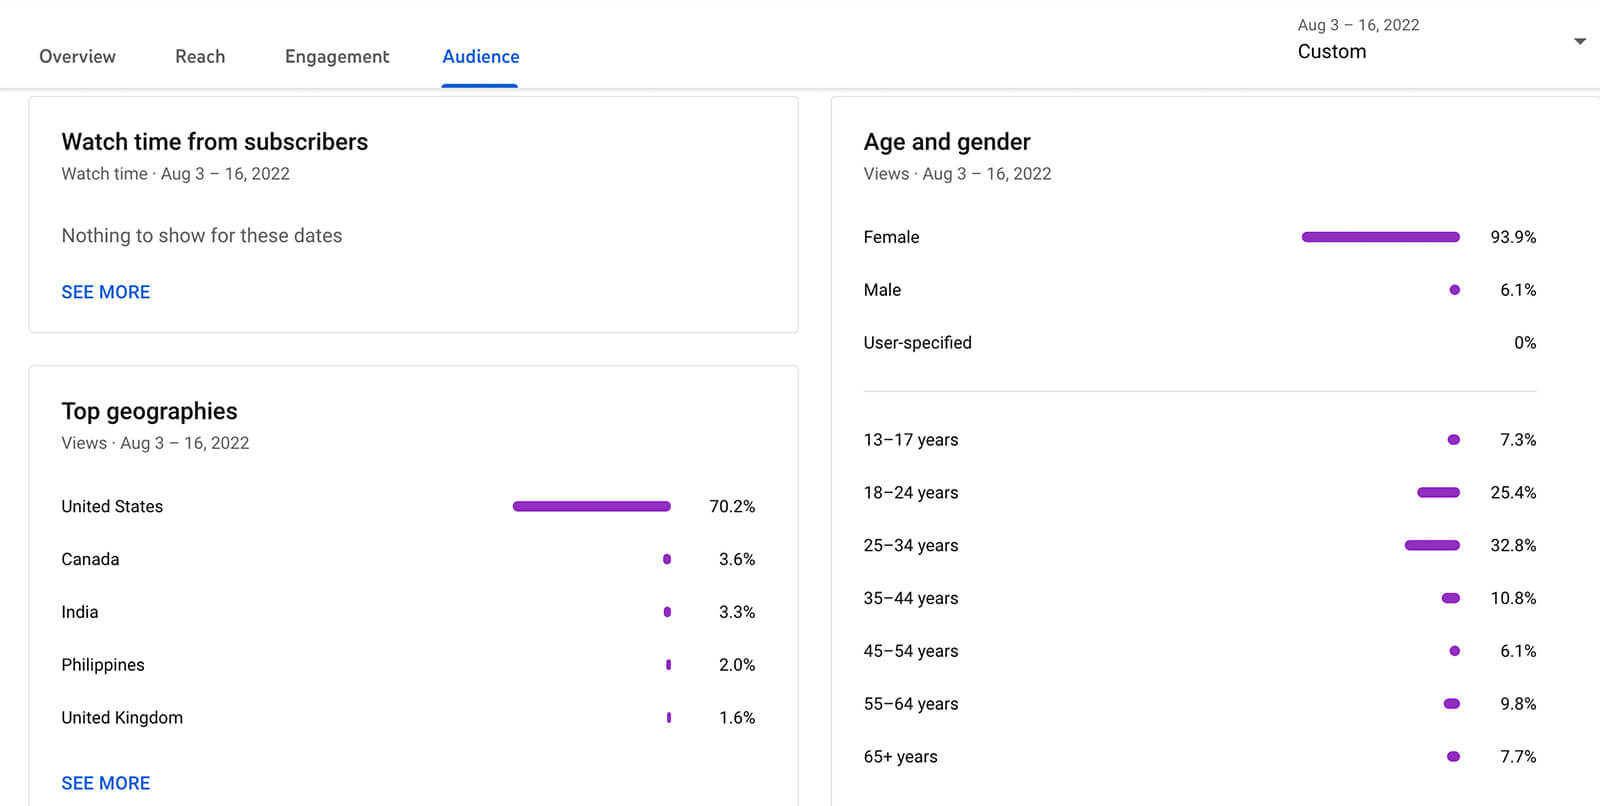
Scroll down to see more audience data, including location, age, gender, and language stats for the short. If your content is for a specific audience, these stats can help you make sure you’re hitting the mark. They’re also helpful if you’re experimenting with shorts and want to see what kind of audience you can attract.
#7: See Channel Audience Growth Analytics
If you click to return to channel analytics, you can find more helpful audience data. The Videos Growing Your Audience panel can help you identify the shorts that are driving channel growth. You can also use the Other Channels Your Audience Watches and Other Videos Your Audience Watched panels to learn more about your viewers.
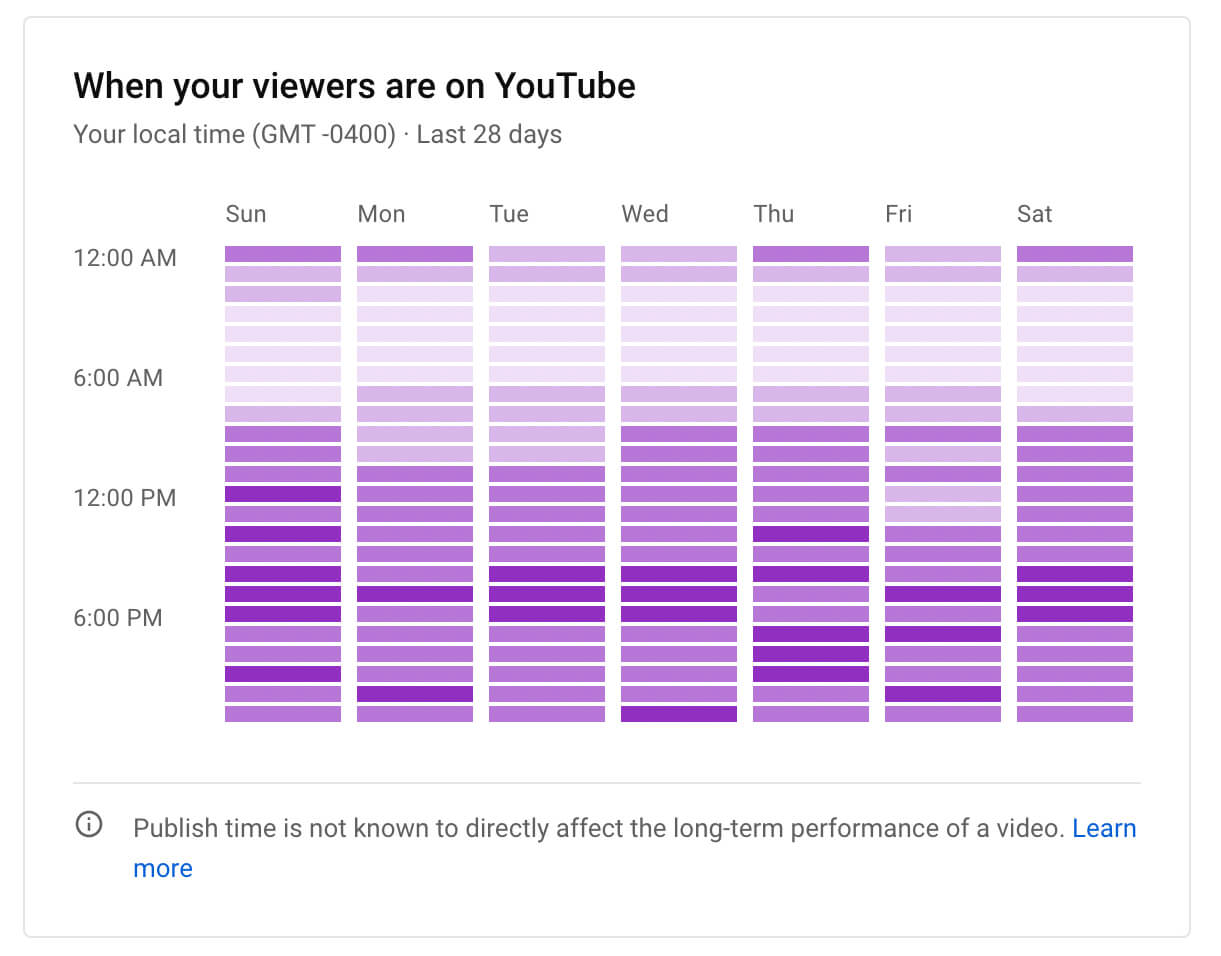
Do you want to drive more views in the first hour or so after you publish a video? Use the When your viewers are on YouTube chart to identify some of the best times to post shorts to your YouTube channel.

Discover Proven Marketing Strategies and Tips
Want to go even deeper with your marketing? Check out the Social Media Marketing Podcast! Publishing weekly since 2012, the Social Media Marketing Podcast helps you navigate the constantly changing marketing jungle, with expert interviews from marketing pros.
But don’t let the name fool you. This show is about a lot more than just social media marketing. With over 600 episodes and millions of downloads each year, this show has been a trusted source for marketers for well over a decade.
#8: See Custom YouTube Shorts Analytics Charts
Whether you’re viewing channel-wide or video-specific data, YouTube Studio analytics has a lot of helpful information for growing your channel and improving your content. But you also have the option to dig deeper into each panel and access more nuanced data.
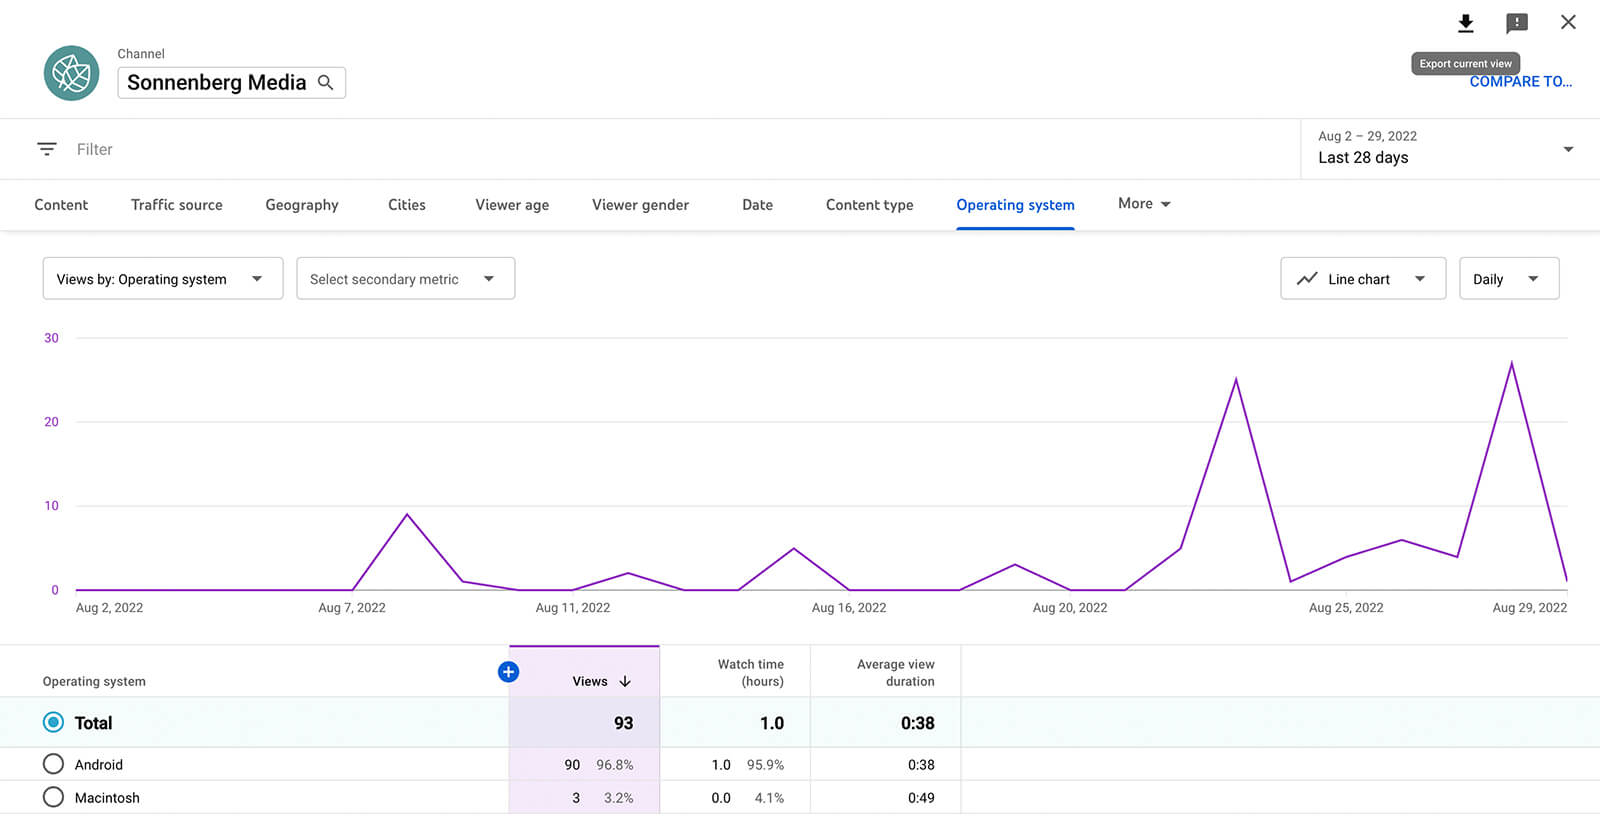
Click the See More link in the lower-left corner of any panel to open an interactive chart. You can use the drop-down menus in the upper-left corner to change the primary metric and add secondary metrics. You can also select certain data sources (for example, traffic sources) to focus your analysis.
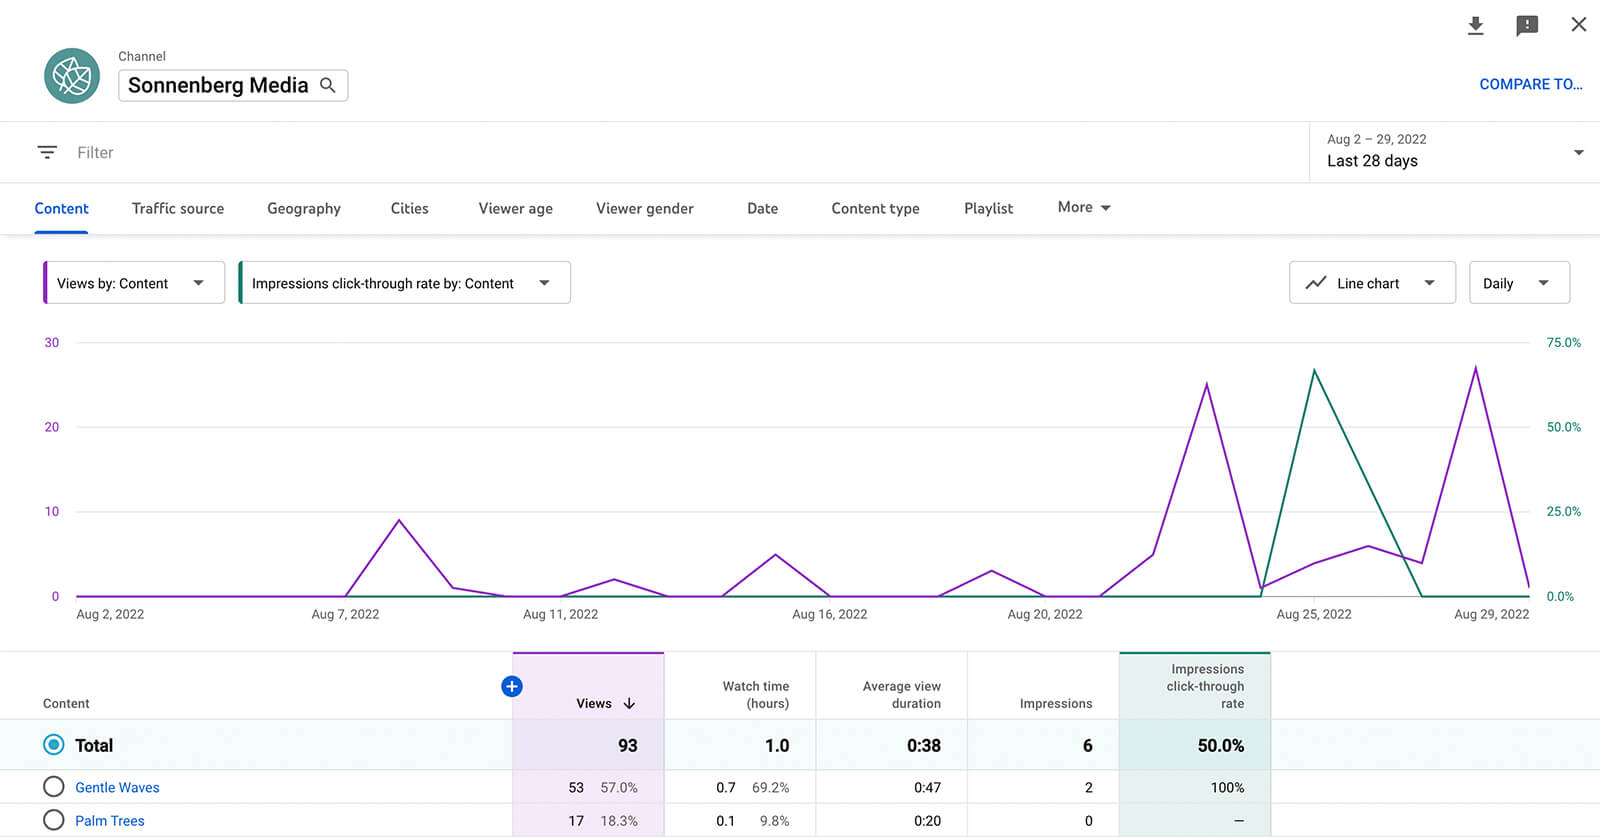
Rather than navigating back to the main analytics dashboard, you can click around to view and customize charts for everything from content and traffic sources to demographics and operating systems.
Although you can’t export the charts, you do have the option to export the data. Click the download button in the upper-right corner of any chart and choose whether you’d like to save it as a CSV or export it to Google Sheets. Then store the data or share it with your team.
How to Analyze YouTube Remix Content
Next, let’s look at YouTube analytics for your channel’s remixes and shorts other creators have made with your video content.
Although YouTube Remix analytics require a bit of digging around to find, they feature a lot of helpful data. For example, they’re great for identifying trends and finding your channel’s most popular remixed content. With these insights, you can develop more of the kind of shorts and videos creators will want to remix.
But there’s plenty of room for improvement, starting with adding Remix analytics to the desktop version of YouTube Studio. Since YouTube Remix analytics began rolling out in August 2022, it’s still relatively new. It’s reasonable to be cautiously optimistic that they’ll continue to evolve and become more useful.
#1: See Analytics for Your Channel’s Remixes
When you publish remixes to your YouTube channel, they display as YouTube shorts. That means the metrics for your channel’s remixes automatically appear along with your shorts analytics. You can analyze them using all of the charts and workflows we covered above.
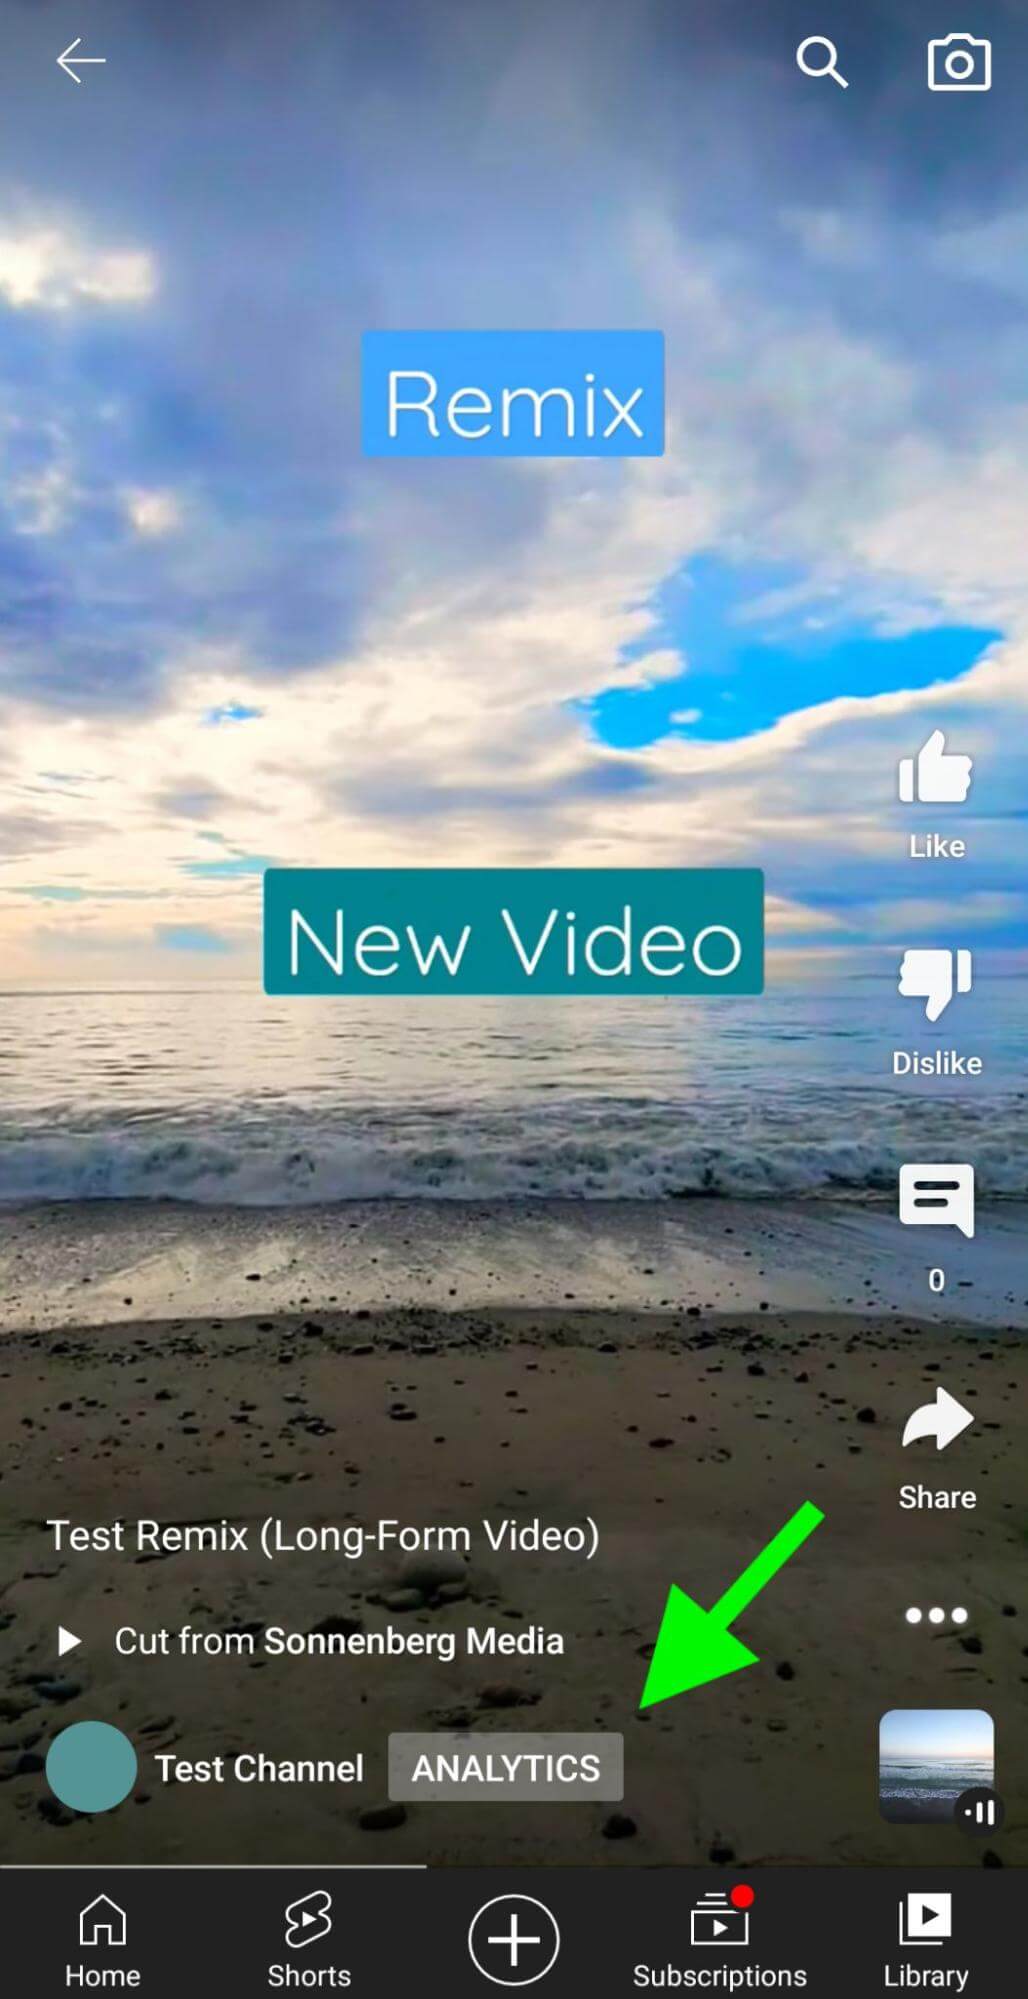
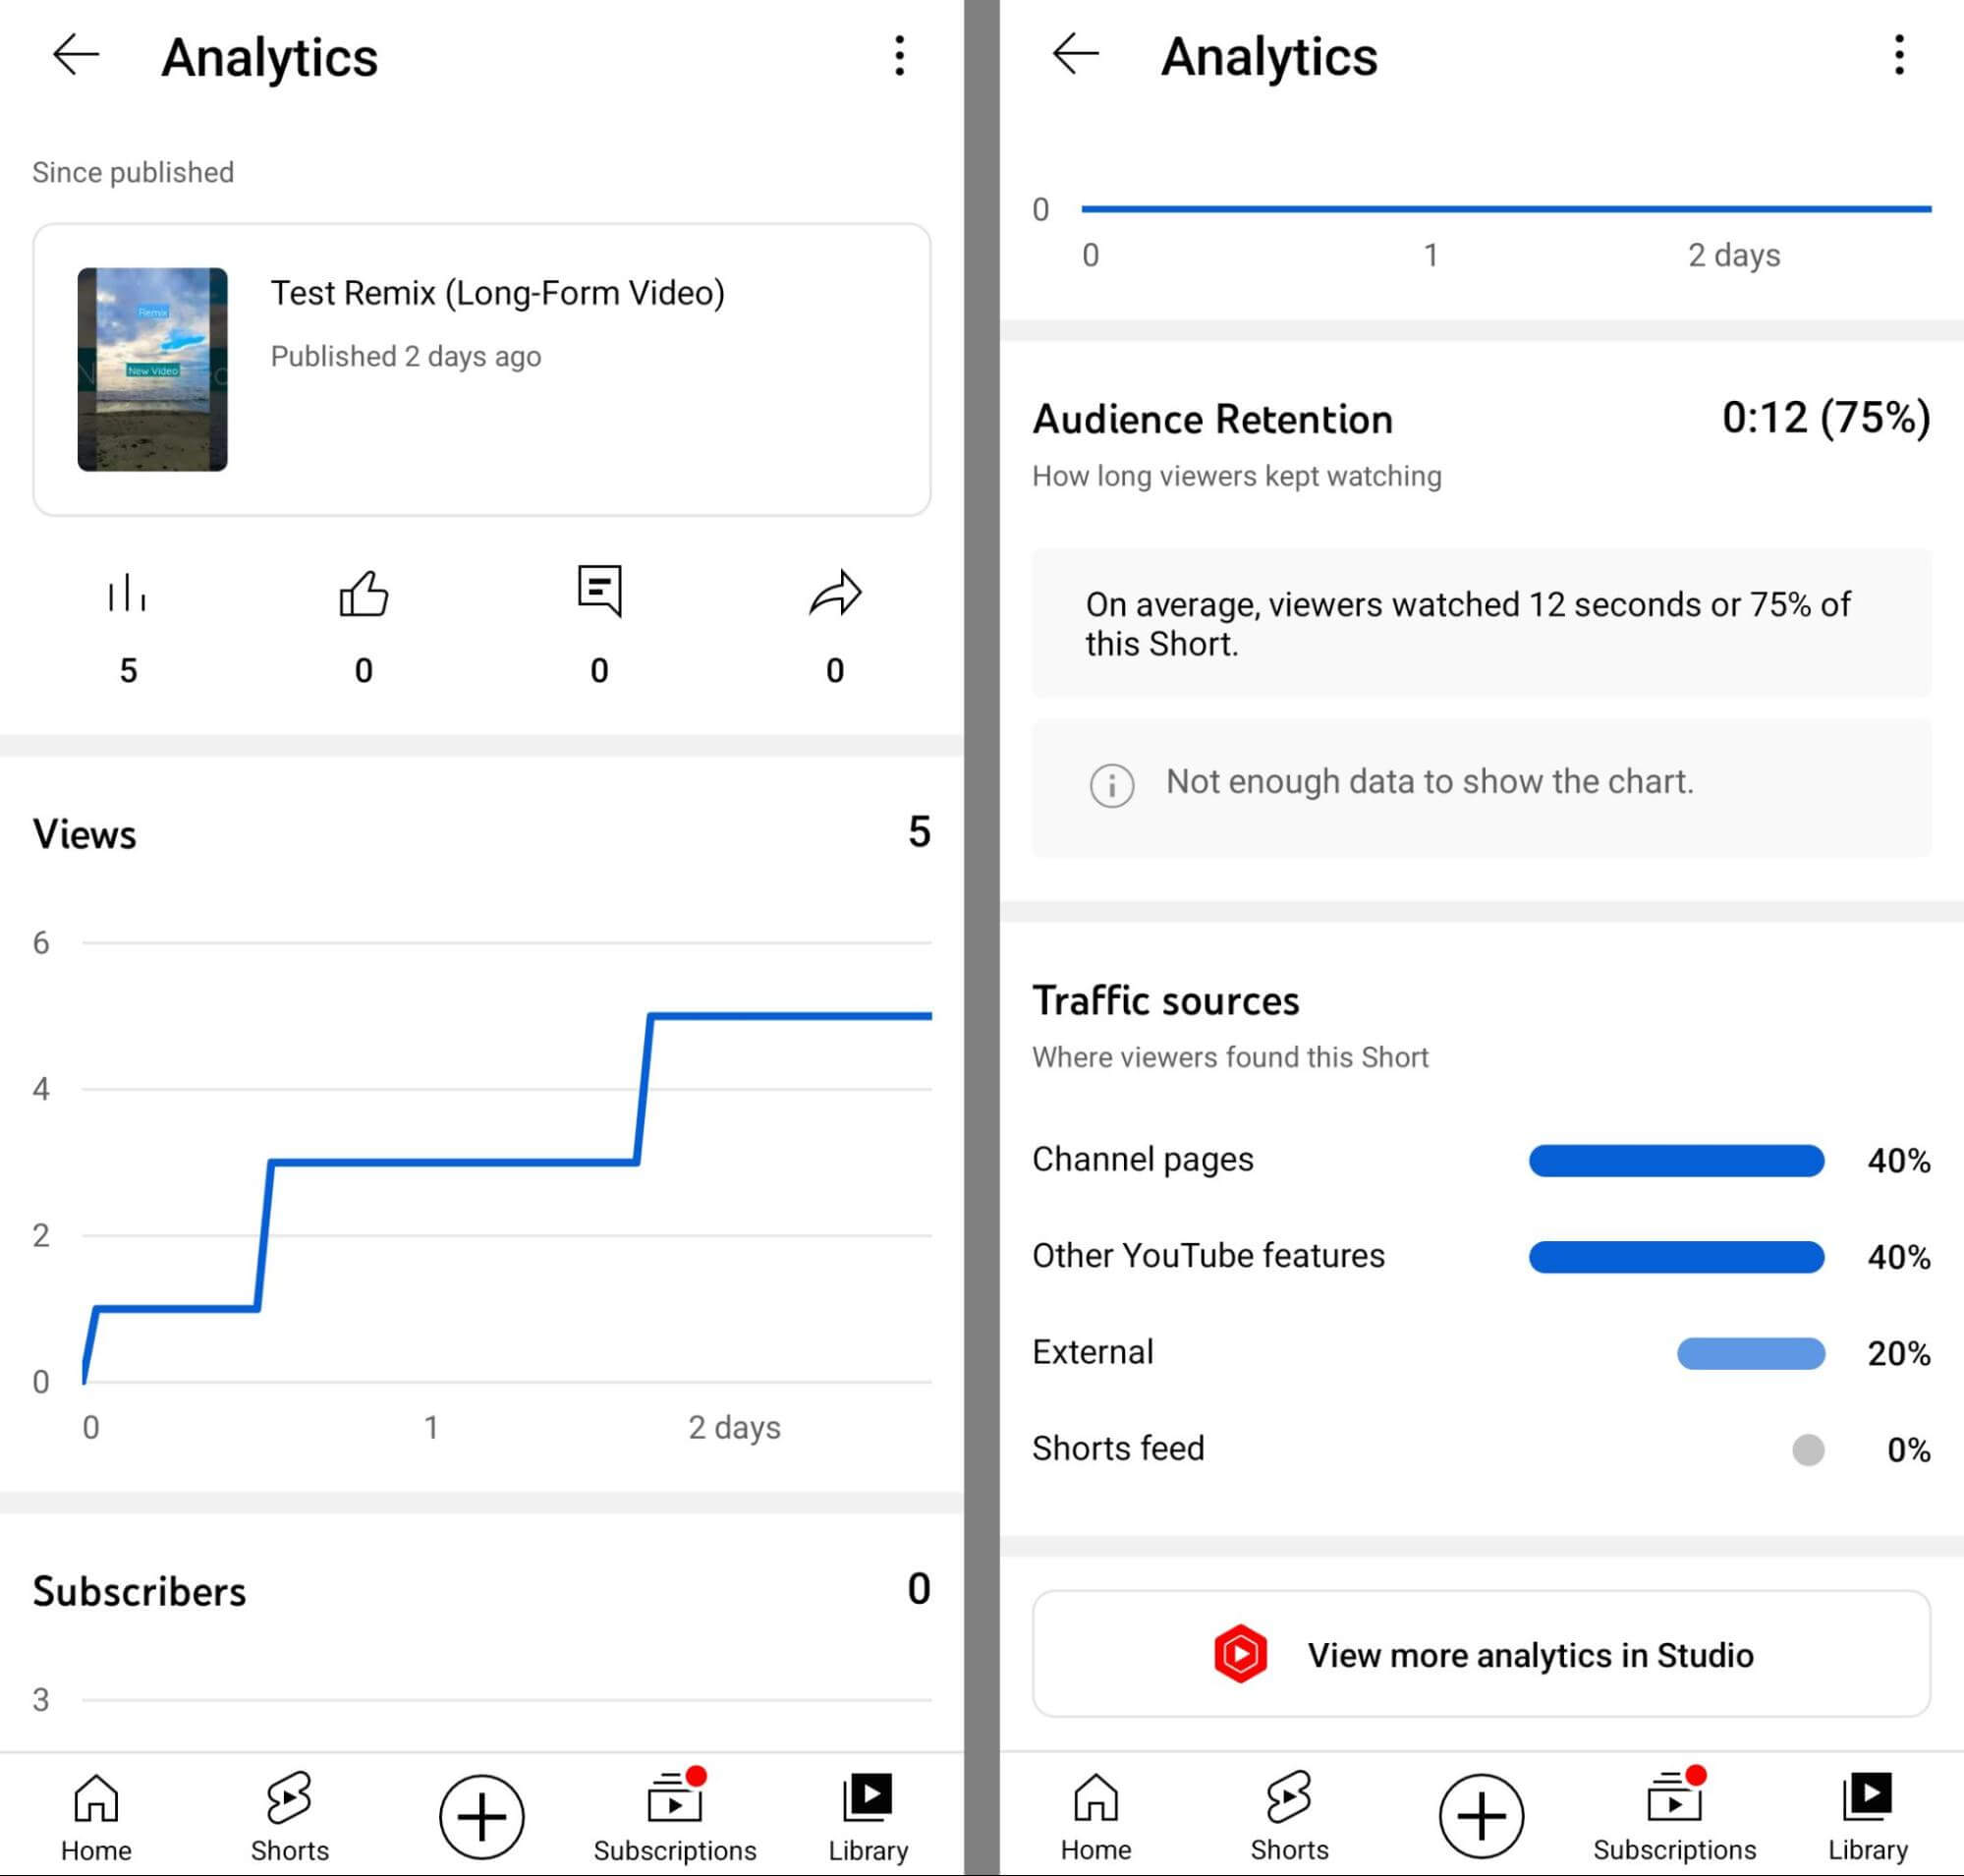
You can also find analytics for any of your channel’s remixes in the YouTube app. Open any remix and tap Analytics in the lower-left corner. At a glance, you can see views, likes, comments, and shares.
Scroll down, and you can see the number of subscribers your channel has gained from the remix. You can also see audience retention data, which can reveal whether most people are watching the complete remix or scrolling away partway through. With this data, you can identify when viewers tend to scroll away so you can continue to improve your content.
Wondering how viewers found your remix? Traffic Sources provides a breakdown including the Shorts feed, your channel page, or external sources. This data is helpful for learning whether viewers tend to find your remixes in trending spots (like the Shorts feed) or from a spot that indicates a higher level of brand awareness (like your channel page).
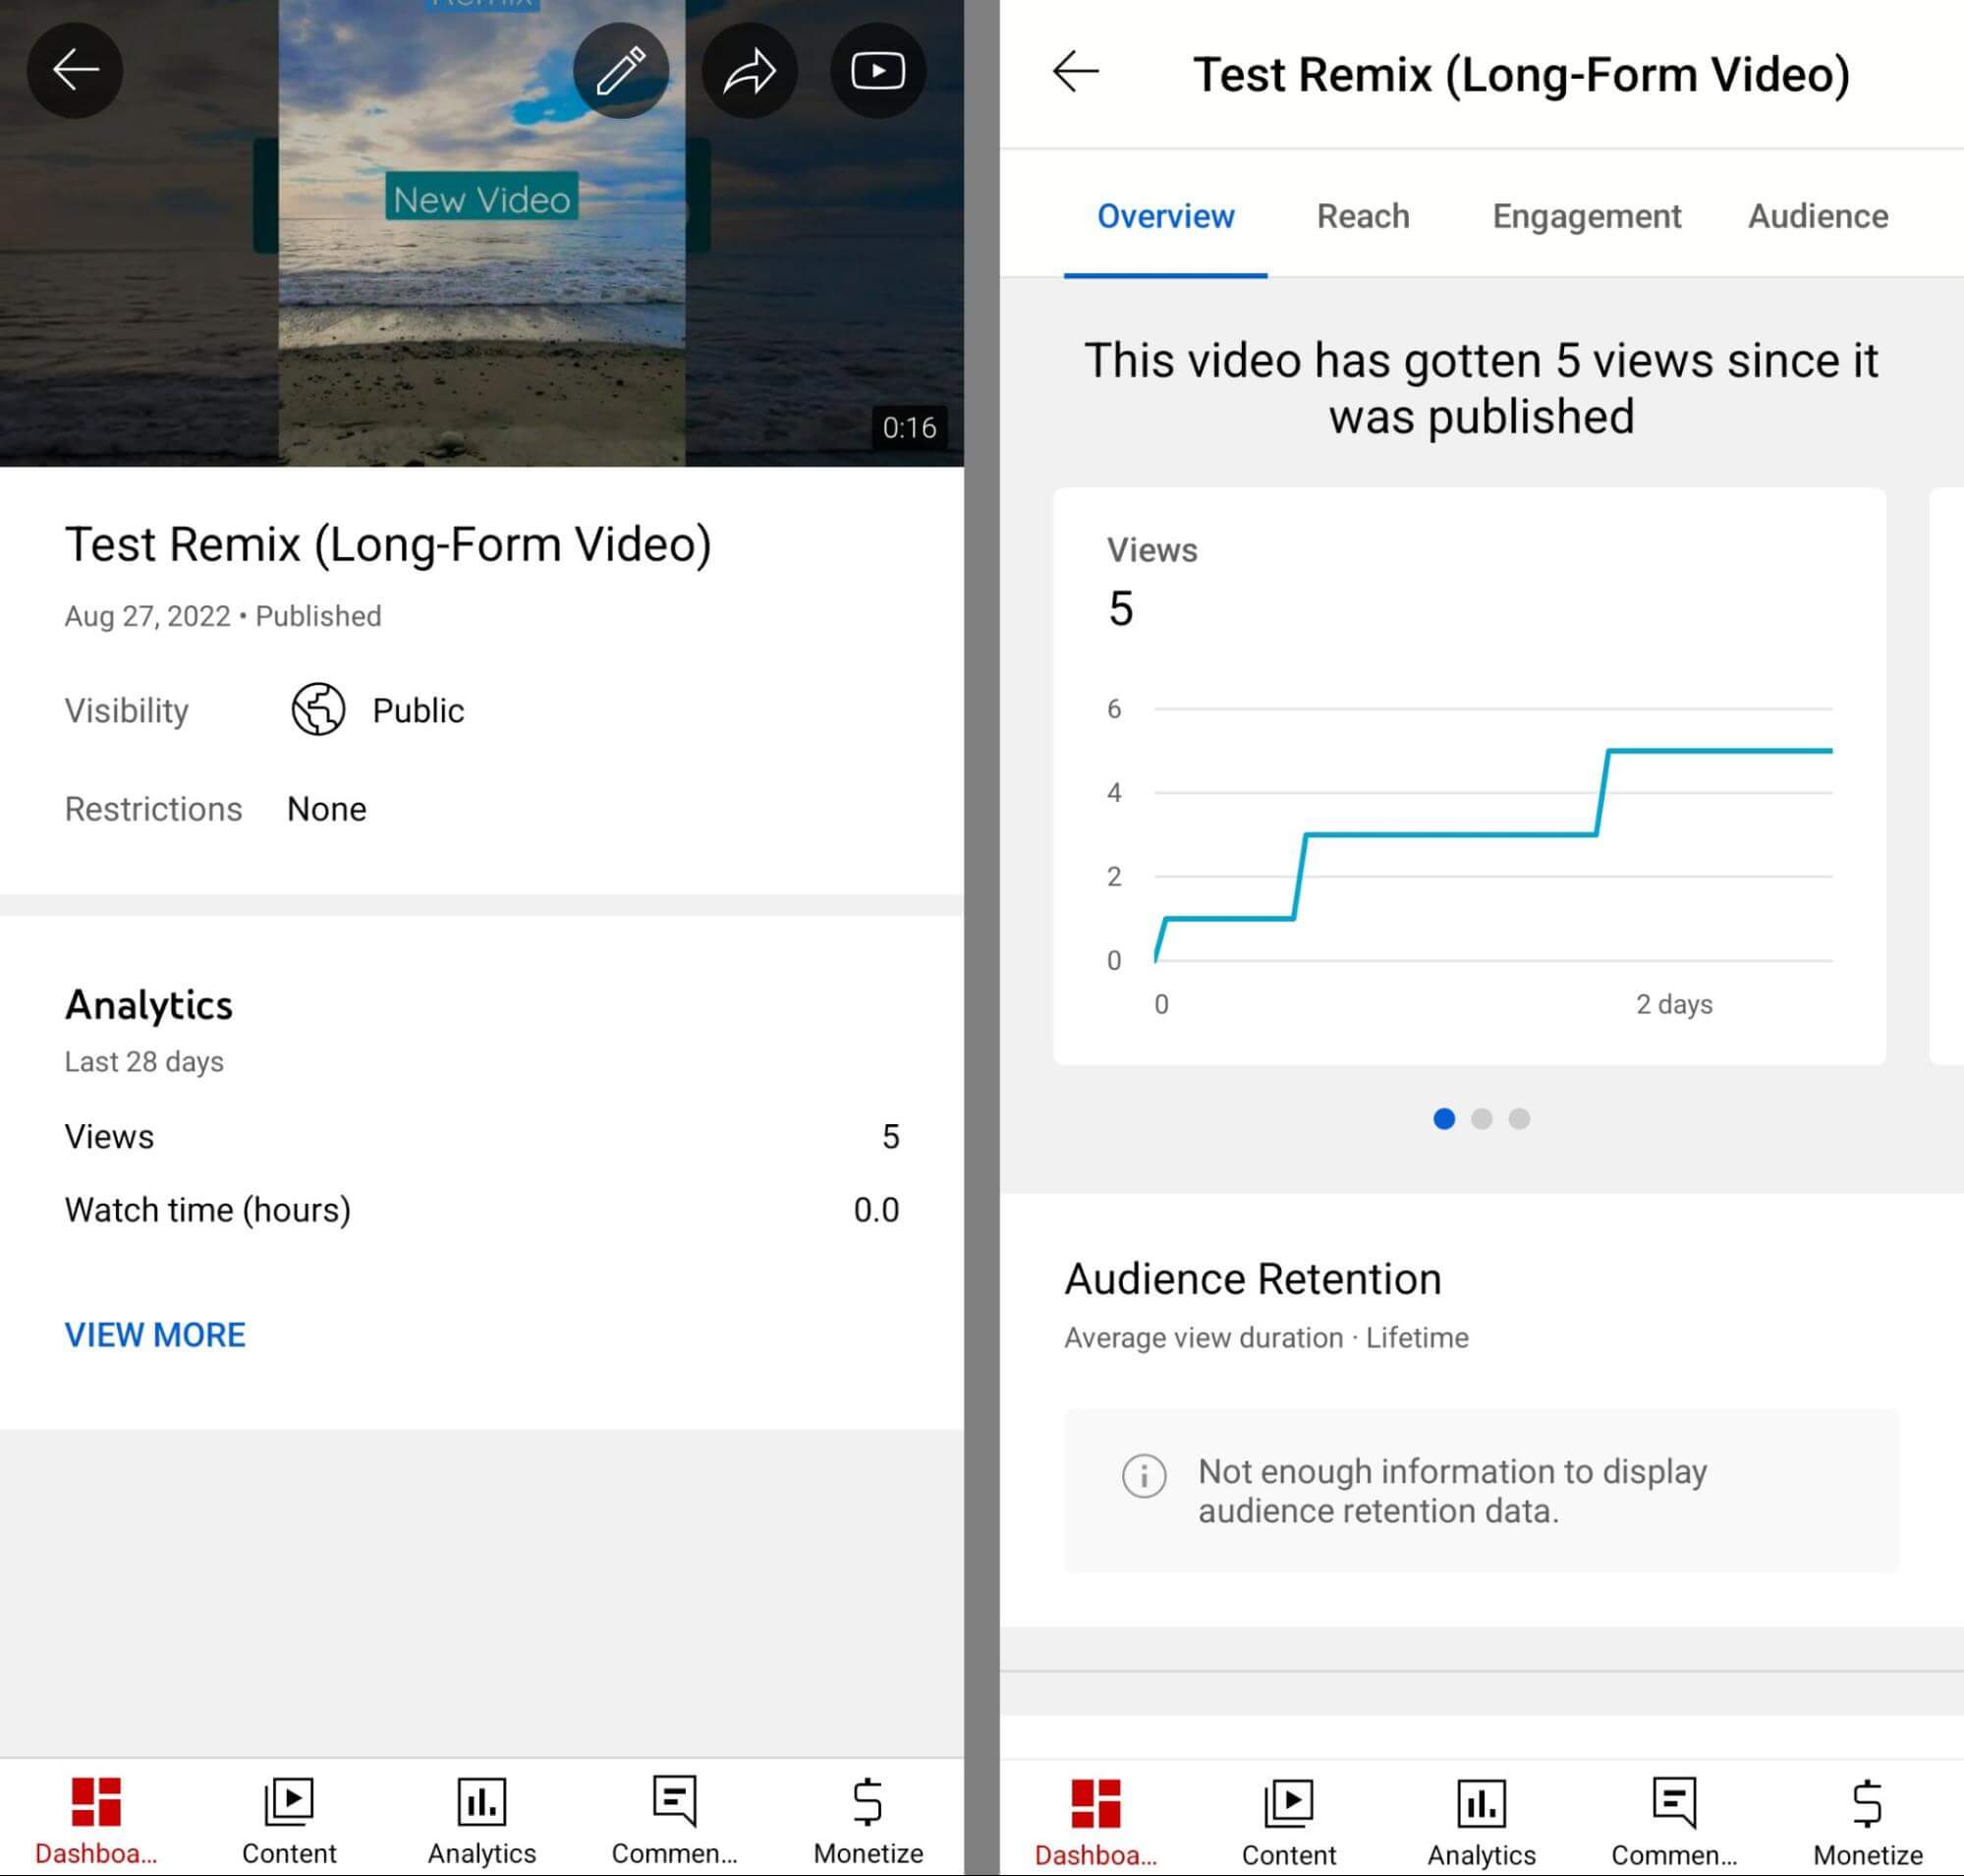
For even more in-depth analytics, you can tap the View More Analytics in Studio button to switch to YouTube Studio. From the mobile YouTube Studio app, you can access reach, engagement, and audience data for your remix.
#2: See Your Top Remixed Videos
But what about the remixes that other users create from your channel’s YouTube content? YouTube Studio now offers in-depth metrics for remixed content. To locate analytics for your remixed content, open the YouTube Studio mobile app and go to the Analytics dashboard. Tap to view the Content tab and scroll to the bottom of the screen.
The Top Remixed section highlights the most popular content from your channel that creators used in their own shorts. You can also see a general overview featuring the total numbers of Remixes and Remix Views.
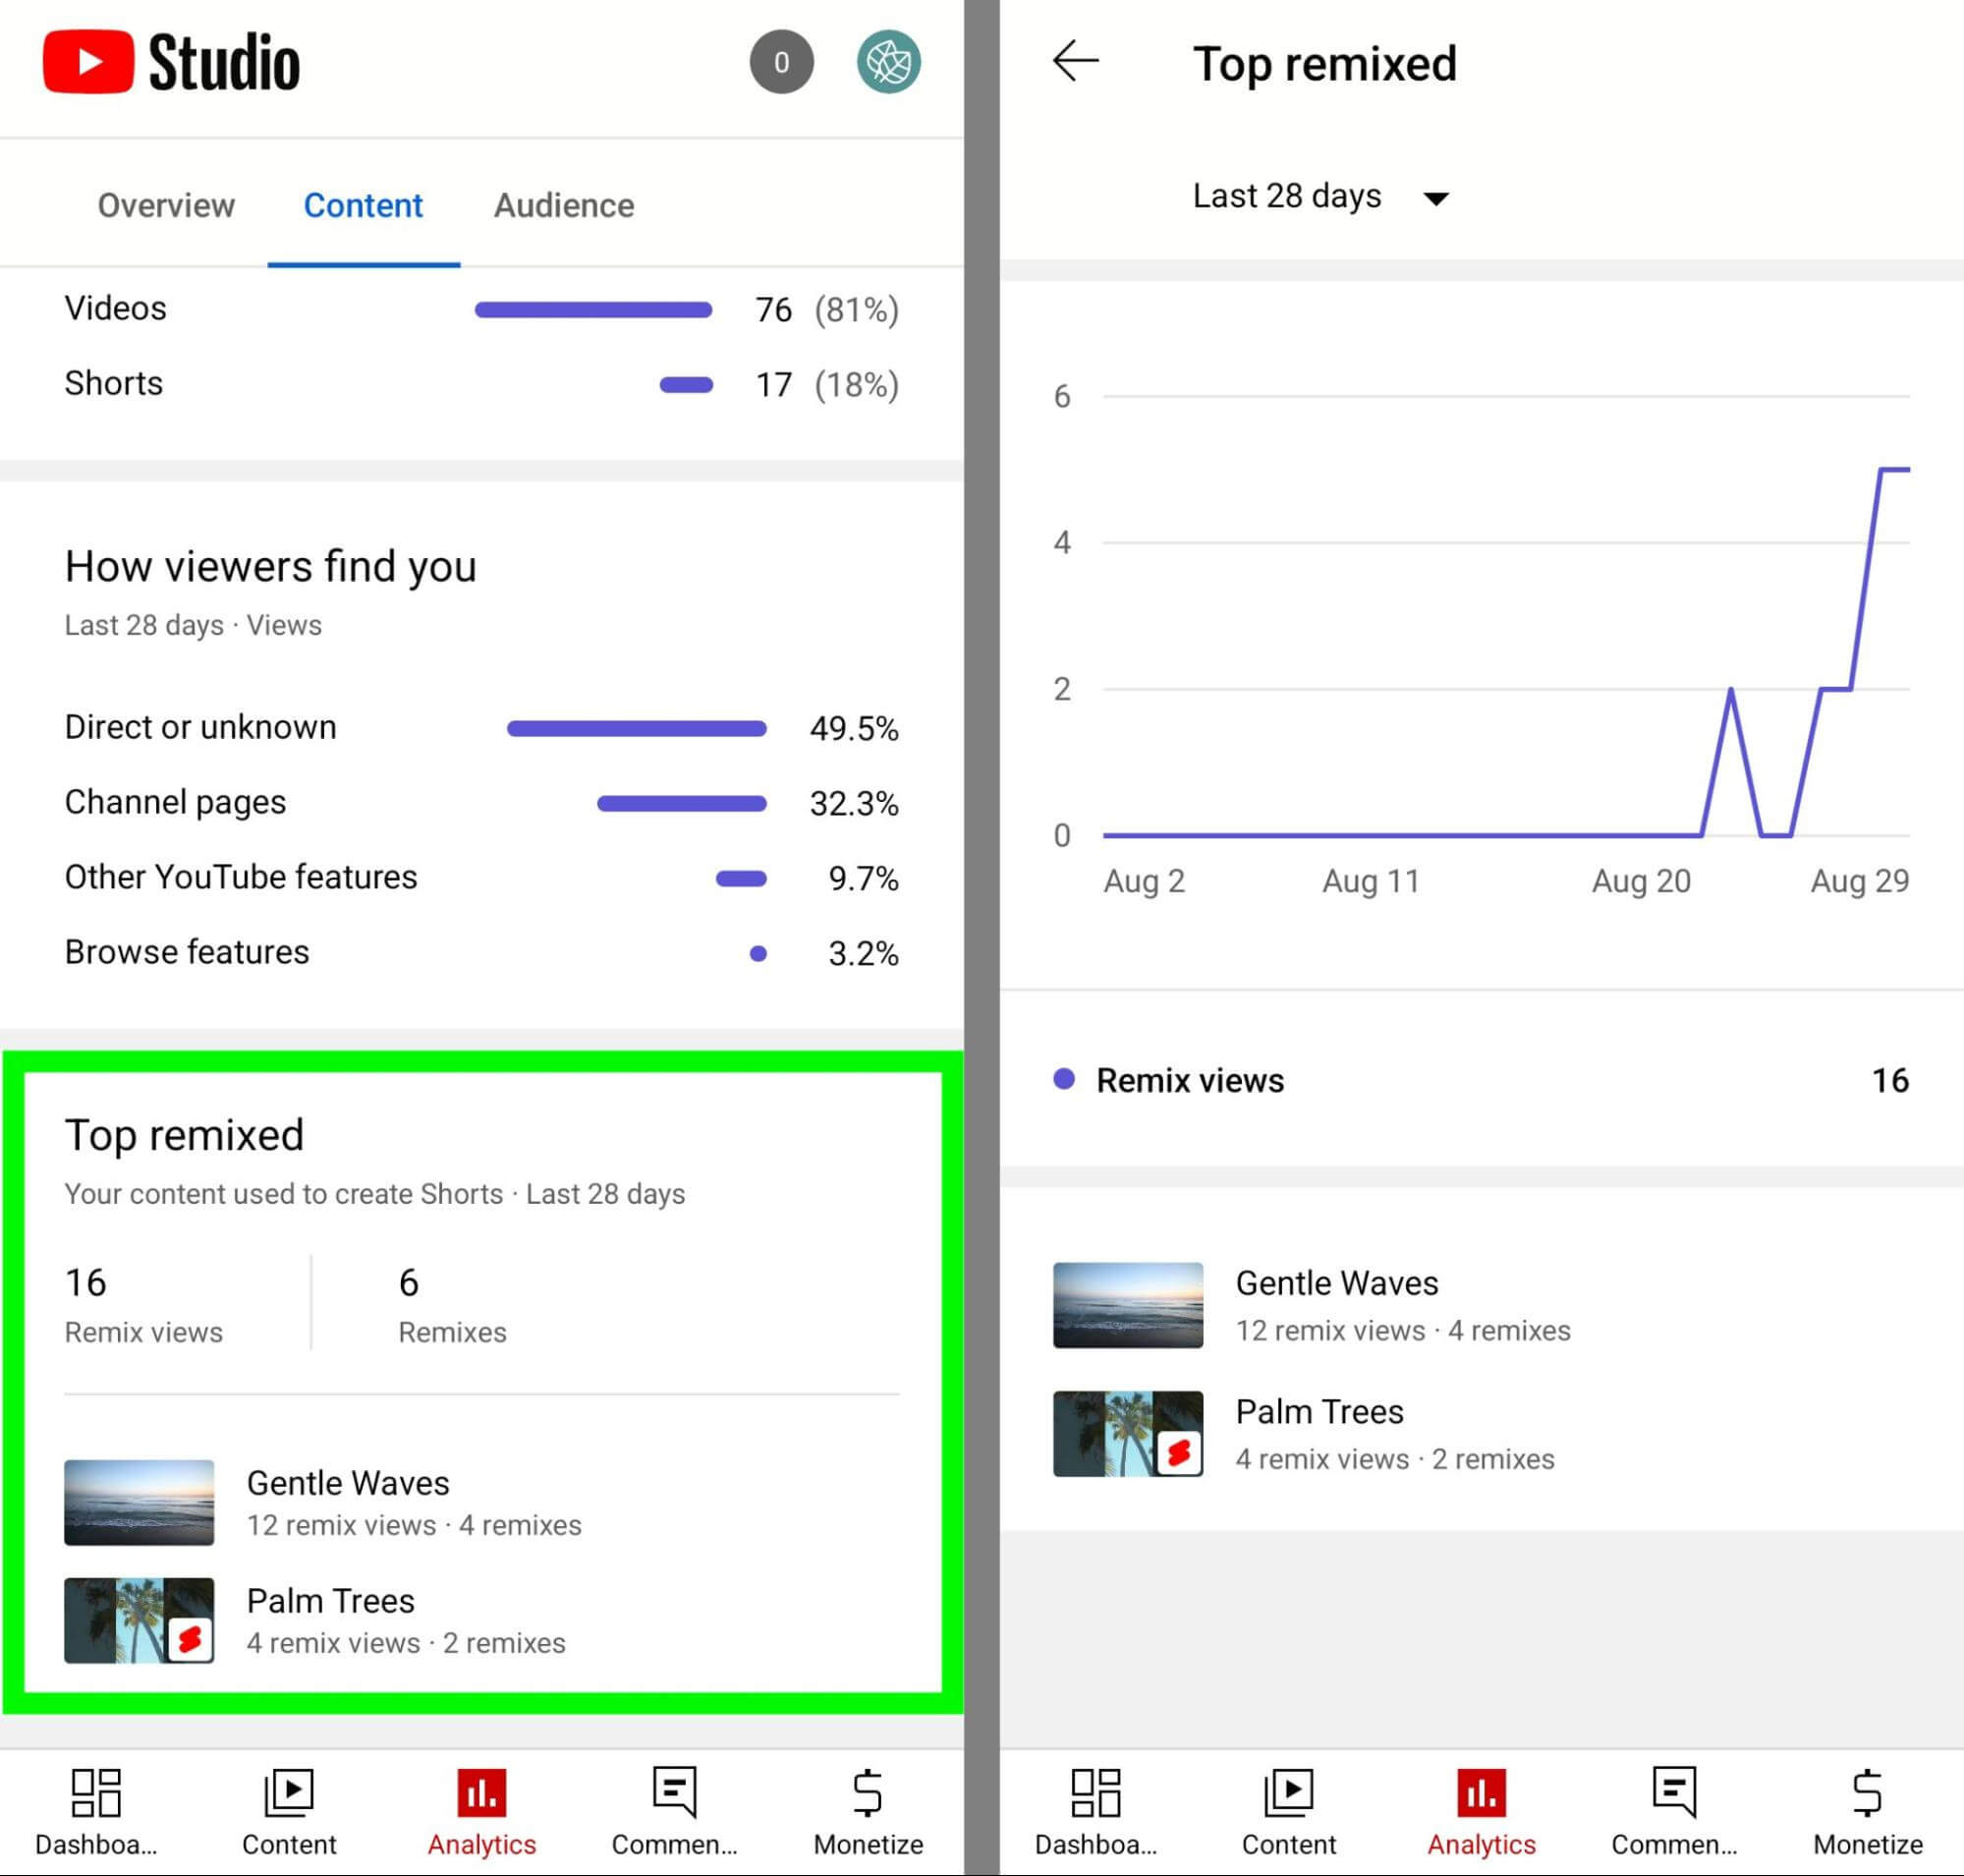
Although these metrics are pretty basic, they’re good for getting a quick read on your channel. For example, you might notice that your channel’s content has been used in dozens, hundreds, or thousands of remixes, which may prompt you to take a closer look.
#3: Drill Down to Top Remixed Details
By default, the Top Remixed overview section reflects data from the past 28 days. To view different timeframes and see how the data tracks over time, tap the section so you can get a more in-depth look at these remix metrics.
Once you tap through to the Top Remixed tab, you can change the timeframe to view Remix analytics from the past week to the previous year. You can also select specific months or see a lifetime view.
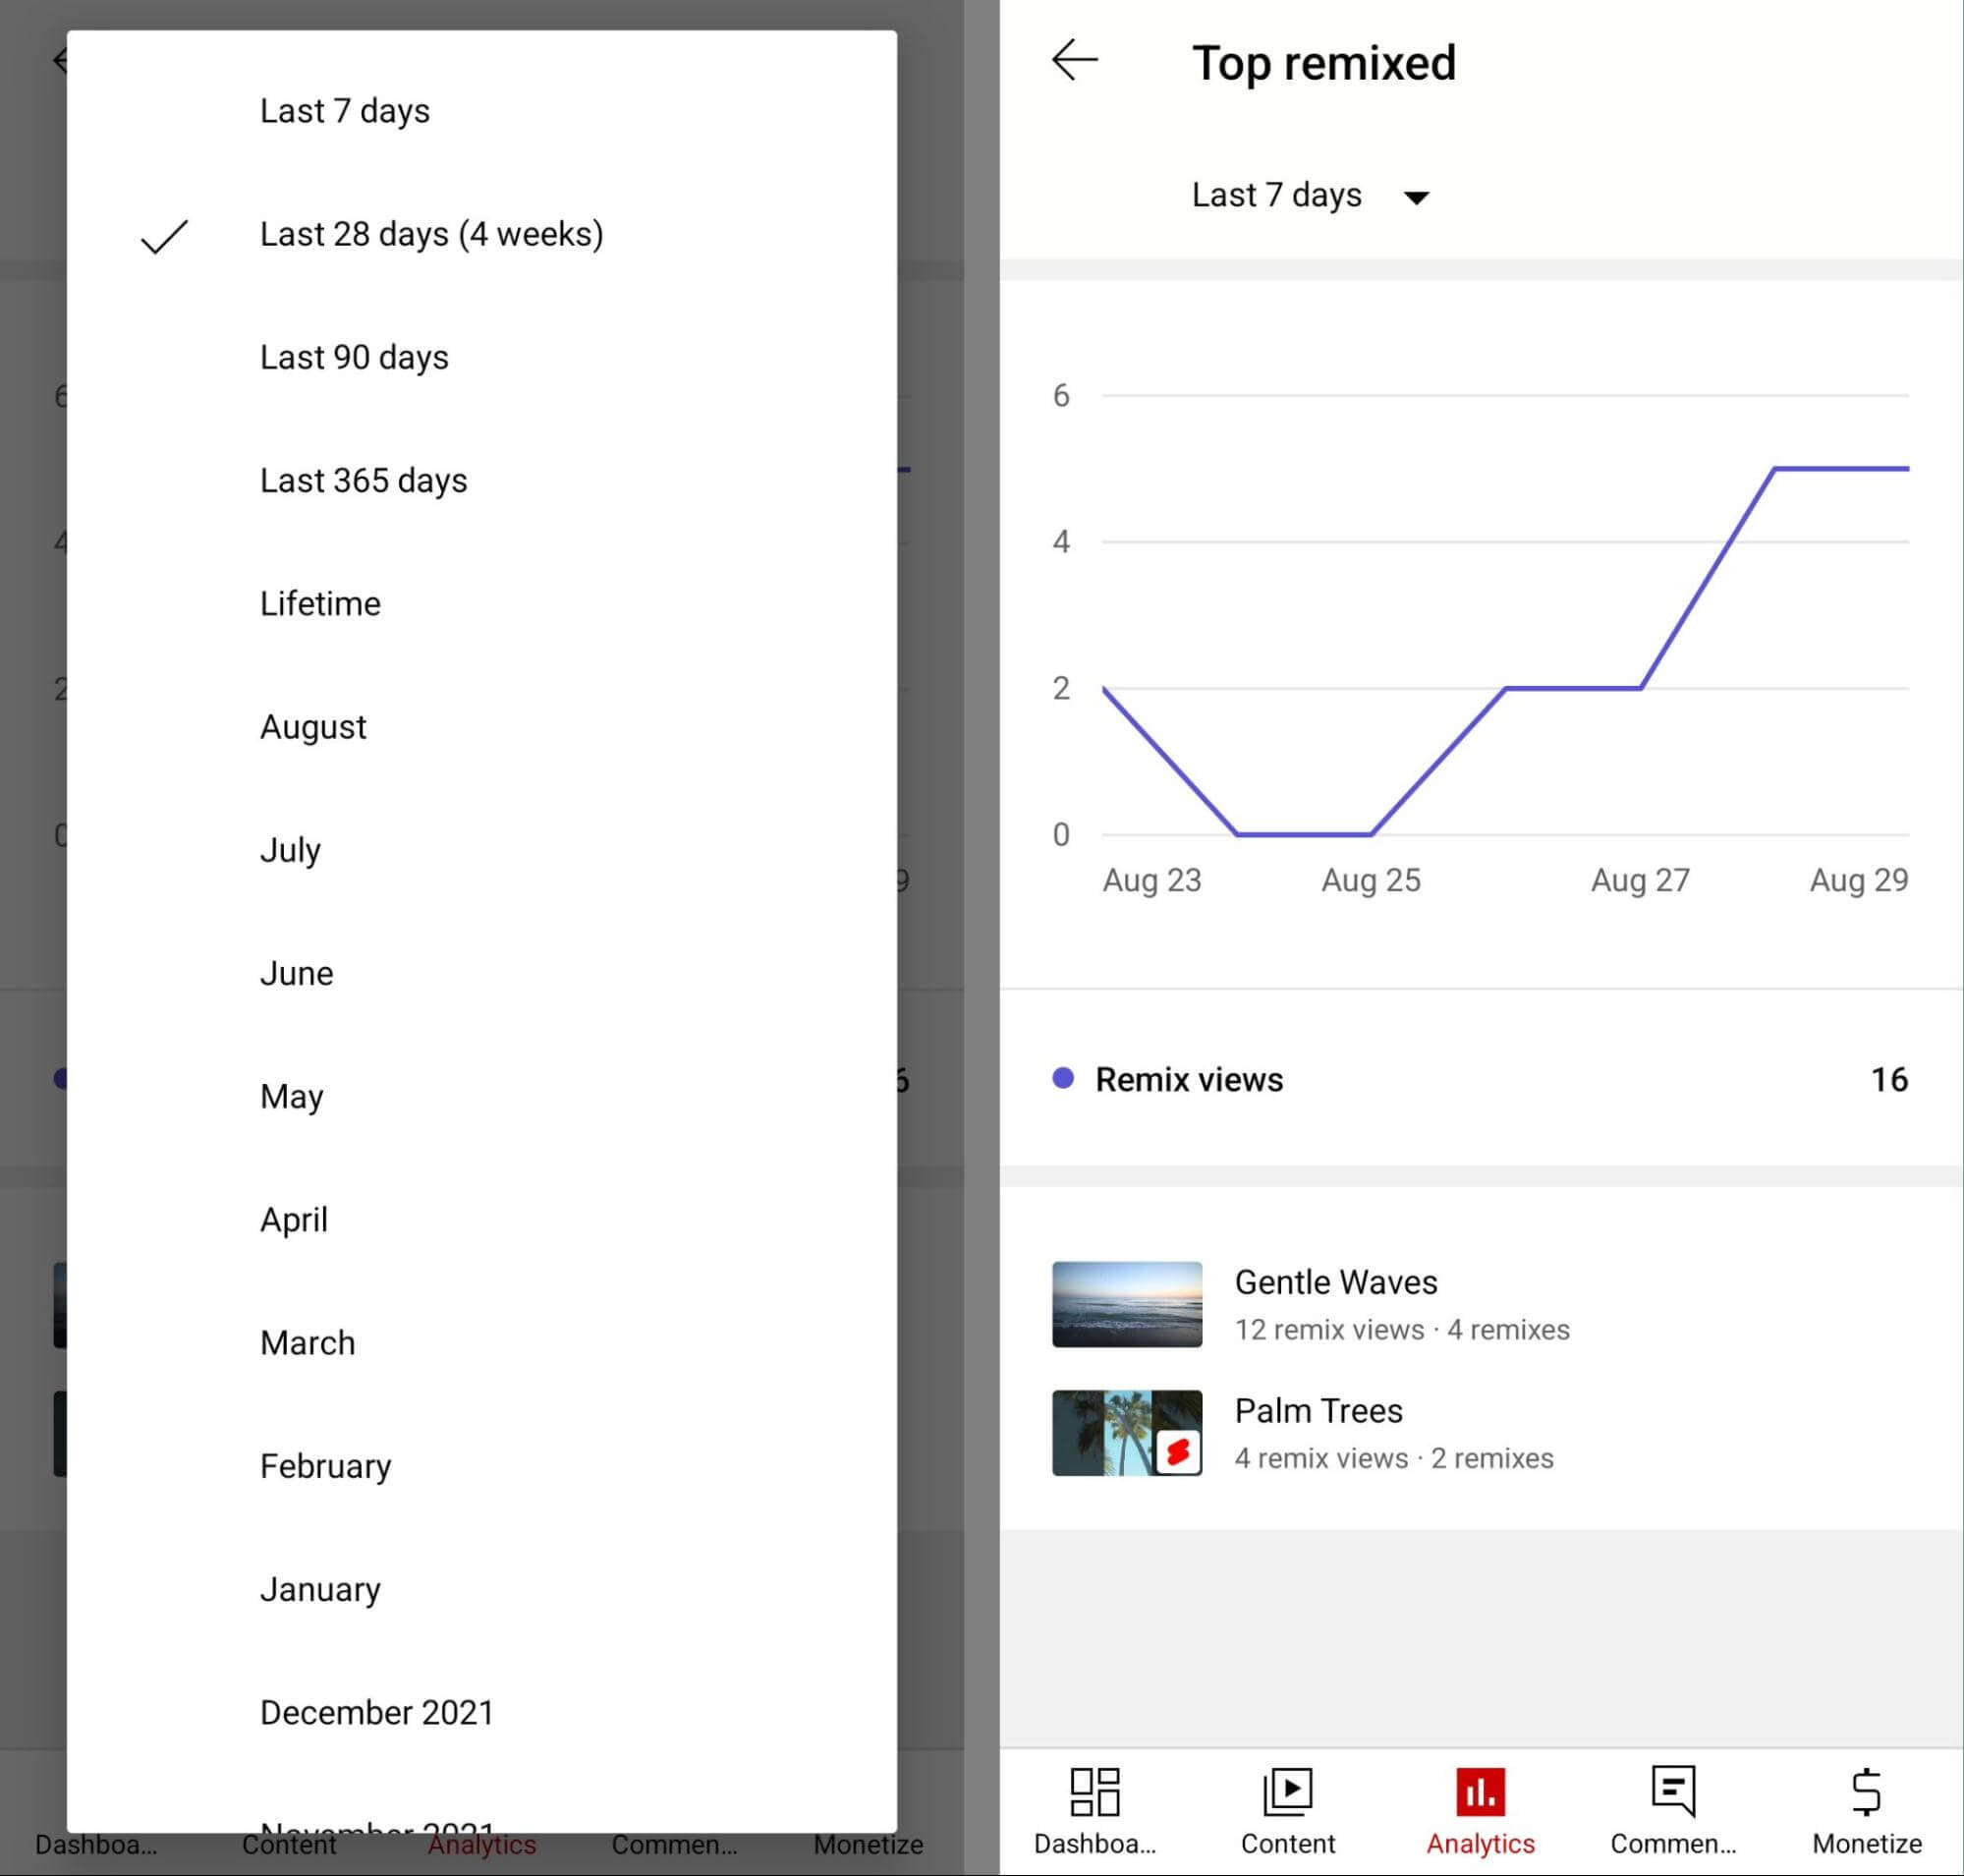
With these options, it’s easy to compare your channel’s most popular remixed content from month to month or from the past week to the past year. For each timeframe, you can see a chart that reflects views of shorts created with your channel’s remixed content.
Below the chart, you can see the channel content that drove the most remix views—YouTube Studio displays up to 50 top videos and 50 top shorts. For each video or short, you can see the number of remixes and the number of remix views.
Using these metrics, you can easily identify the channel content that has resonated most with creators and potentially driven viral performance. Curious about the remixes that creators made with your content? Tap any of the top content to see individual metrics.
#4: See Analytics for Remixes From Your Channel’s Original Content
When you tap any content from the Top Remixed tab, YouTube Studio automatically displays complete analytics for the video or short. To skip ahead to remix-related metrics, tap the Engagement tab. Then scroll down to the Top Remixed section to see video- or shorts-specific remix data.
Here, you can see a tally of the remixes and remix views related to the original content. YouTube Studio also displays a list of the top shorts that reference the original content. This list includes all types of remix content including:
- Audio remixes that sample up to 15 seconds of your audio
- Remixes that sample up to 5 seconds of your video
- Shorts imports that your channel created by turning long-form video into shorts
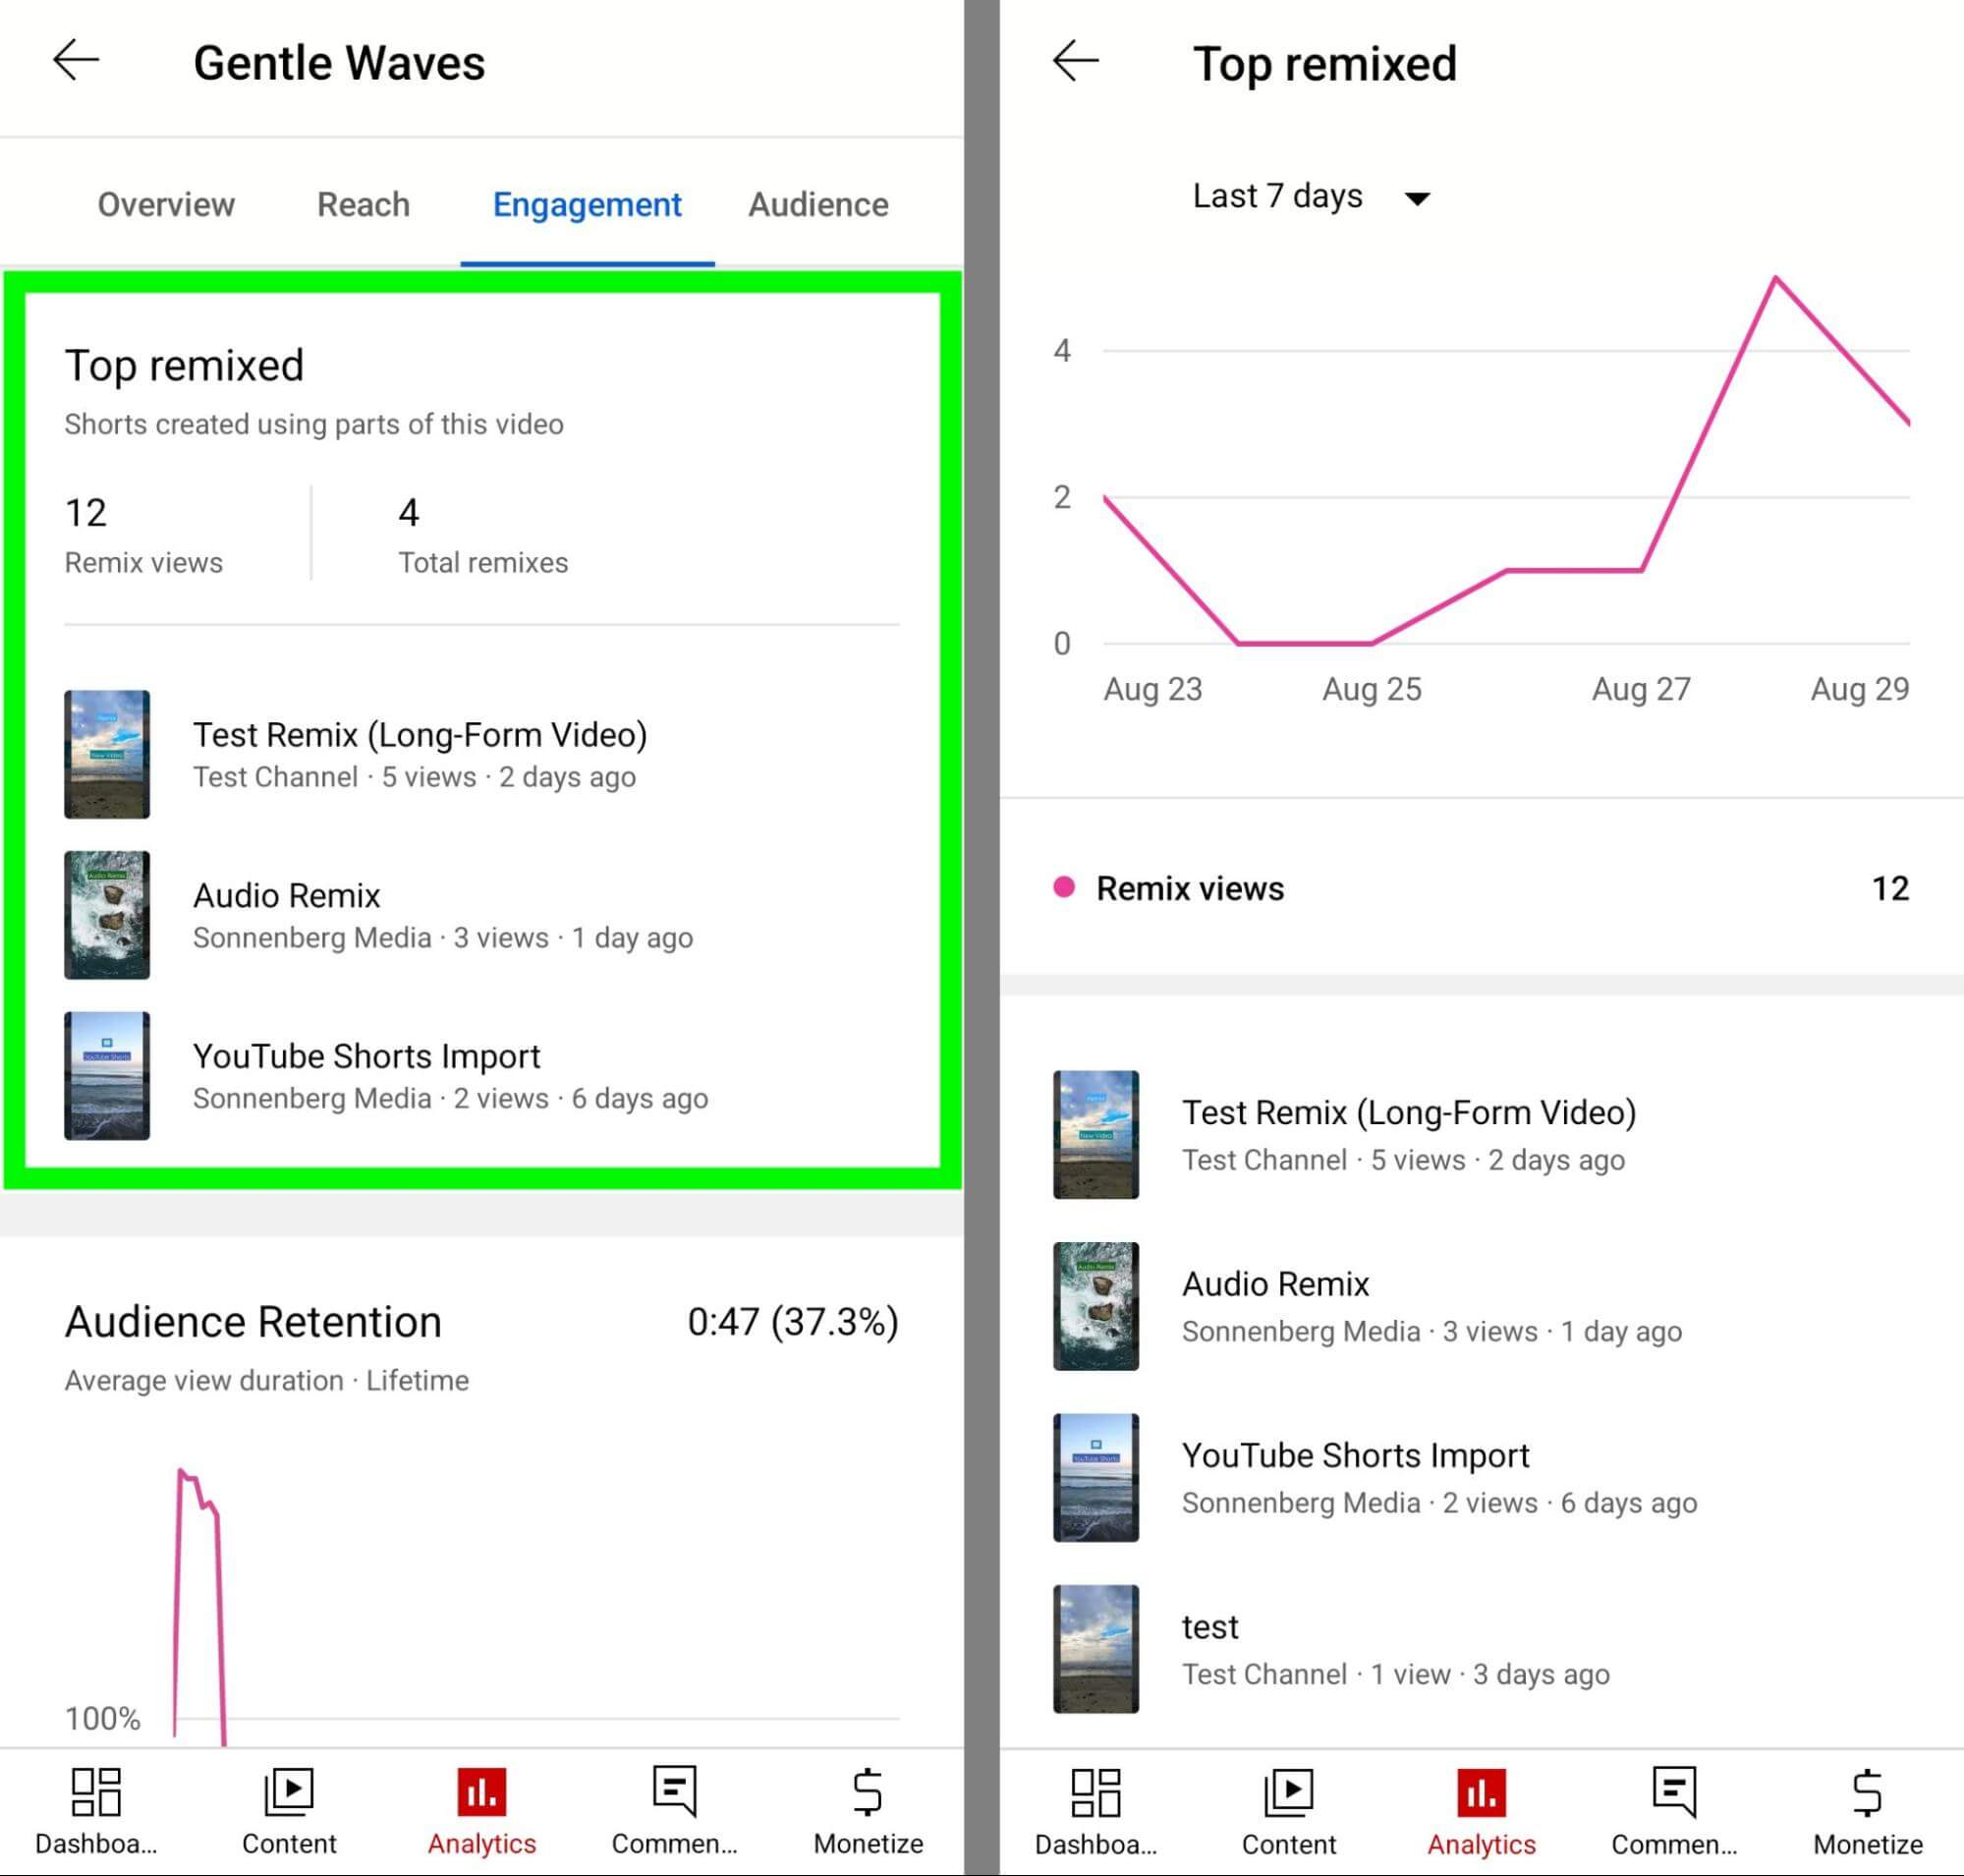
At a glance, you can view basic information about each remix. For example, you can see which channels created shorts from your content and get the gist of the remix from the title and thumbnail. The list also shows the number of views each remix generated and when it was published so you can gauge activity quickly.
Tap this section to see a Top Remixed tab that looks a lot like the other Top Remixed tab—but this one shows details for a specific source video rather than for your entire channel. Here you can see a chart showing remix activity over time and top remixes made from your original content. You can tap any remix on the list to open and view it directly in the YouTube app.
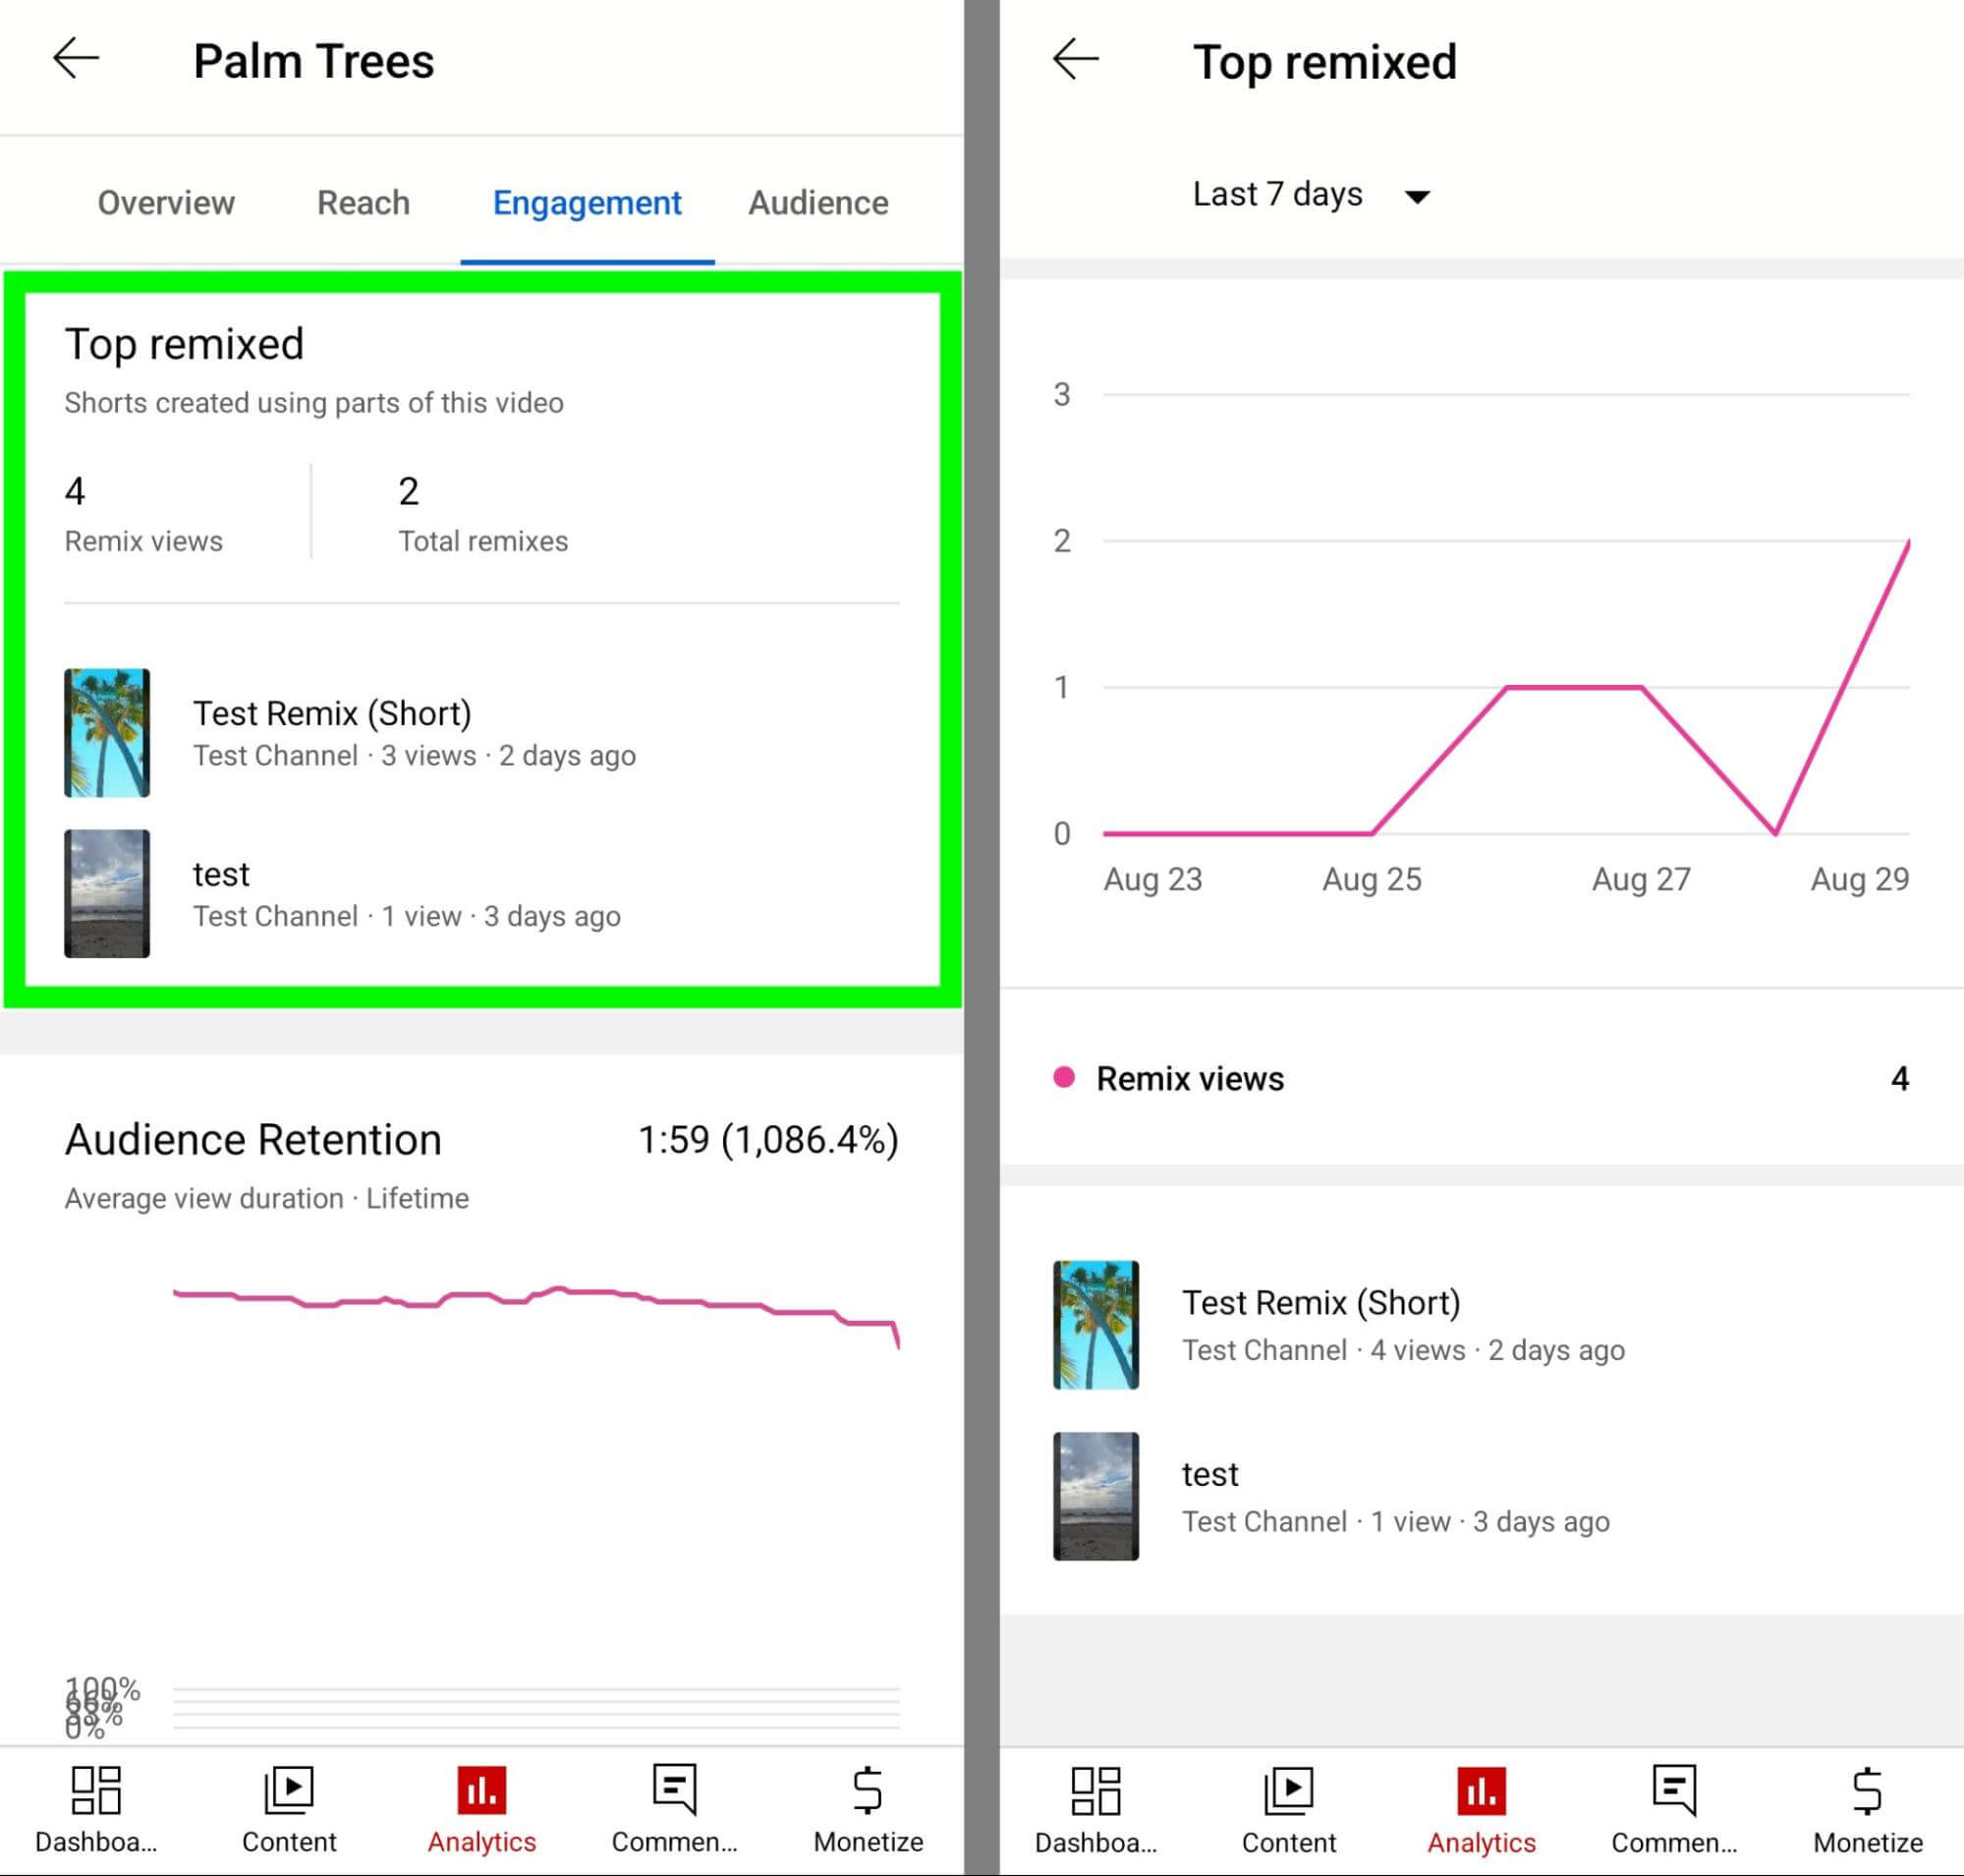
To return to your channel’s complete remix analytics, tap the back arrow a few times. Then explore the remix data for the rest of your channel’s top videos and shorts, and view the shorts that creators made with your content.
Conclusion
Whether you want to learn how your original shorts have fared or how other channels have remixed your content, you can find tons of data in YouTube Studio. With the workflows above, you can use YouTube analytics for Shorts and Remixes to improve your video strategy and create content that contributes to key goals.
Stay Up-to-Date: Get New Marketing Articles Delivered to You!
Don't miss out on upcoming social media marketing insights and strategies! Sign up to receive notifications when we publish new articles on Social Media Examiner. Our expertly crafted content will help you stay ahead of the curve and drive results for your business. Click the link below to sign up now and receive our annual report!
Attention Agency Owners, Brand Marketers, and Consultants

Introducing the Marketing Agency Show–our newest podcast designed to explore the struggles of agency marketers.
Join show host and agency owner, Brooke Sellas, as she interviews agency marketers and digs deep into their biggest challenges. Explore topics like navigating rough economic times, leveraging AI, service diversification, client acquisition, and much more.
Just pull up your favorite podcast app, search for Marketing Agency Show and start listening. Or click the button below for more information.

