 Do you track your social media marketing results?
Wondering how to make more sense of ROI?
By tracking micro-conversions and attribution, you can connect a dollar value to your social media marketing efforts.
In this article, you'll discover how to track the return on social media clicks.
#1: Tag Your URLs
Tagging lets you add data to clickstreams. This is an example of a tagged link:

When this link is clicked, here's what it tells the analytics tracking software on foo.com:
- The utm_source is “facebook.”
- The utm_medium is “cpc.”
- The utm_campaign is “pokemongo.”
- The utm_keyword is “charmander.”
- The utm_content is “ad-1.”
Essentially, each tag delivers a variable: utm_source, utm_medium, etc. And each variable has a value attached: facebook, cpc, etc.
Tagging is an analytics time machine. If you do it right, you can track micro-conversions, do attribution, and deliver reports that answer unexpected questions from your client or boss.
All analytics tools use a specific tag structure to group and attribute traffic by source, medium, content, and so on. The examples in this section use Google Analytics UTM tags.
Note: If you're an Adobe Analytics user, you can use those variables. Or if you want to get fancy, set up Adobe Analytics to interpret UTM variables; check out this article by Adam Greco to learn how.
Channel
Google Analytics generates channel data based on source and medium. A channel is a broad classification of the traffic source, such as “social.”
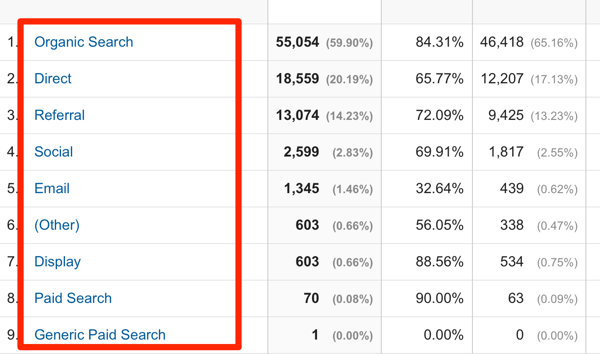
Medium
Get World-Class Marketing Training — All Year Long!
Are you facing doubt, uncertainty, or overwhelm? The Social Media Marketing Society can help.
Each month, you’ll receive training from trusted marketing experts, covering everything from AI to organic social marketing. When you join, you’ll also get immediate access to:
- A library of 100+ marketing trainings
- A community of like-minded marketers
- Monthly online community meetups
- Relevant news and trends updates
utm_medium is the medium from which the visit originated. Think of medium as a way to separate paid, earned, and owned.
You can set medium to anything you want. But remember, Google Analytics determines channel using medium and source, so stick to the standards:
- “social” means the visitor arrived on your site after clicking a link in a social media post.
- “referral” is the default. If you don't set utm_medium and Google Analytics finds a referring URL, Google Analytics should show it as “referral.”
- “cpc” means the visitor clicked on a cost-per-click link. (Use cpc, not ppc.)
- “organic” means the visitor clicked an organic search result.
To find this data in Google Analytics, go to Acquisition > All Traffic > Source/Medium.
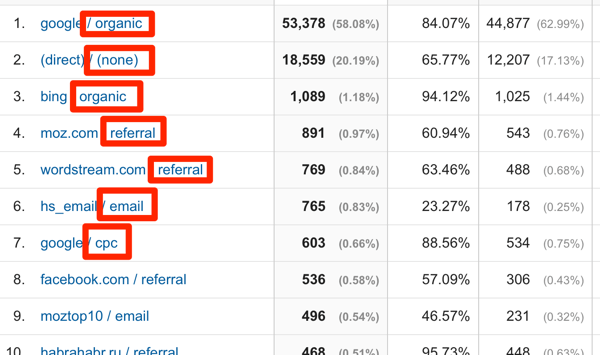
If you use paid social media, don't set utm_medium to “social.” Set utm_medium to “cpc” (cost per click) or “cpm” (cost per 1,000 impressions) as relevant. If you set it to “cpc” and the source is “Facebook.com,” for example, Google Analytics chooses the “social” channel, and you can still add the cost data into paid marketing reports.
If you don't set medium, clicks may show as “referral” or “social.”
Source
utm_source is the referring website: “facebook” for Facebook.com, “twitter” for Twitter.com, “google” for Google.com, “portent” for Portent.com, etc.
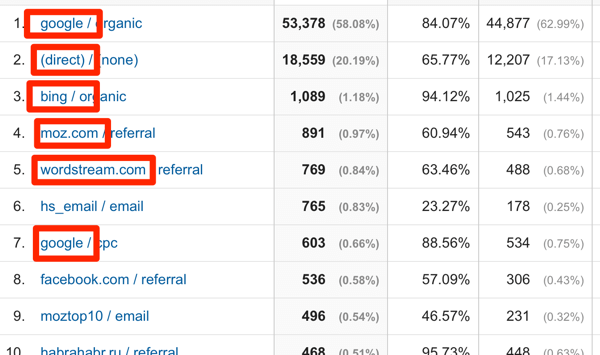
If you don't set the source, Google will try to retrieve it from the referring site URL. But remember: Google uses source and medium to generate channel, so set the source when you can.
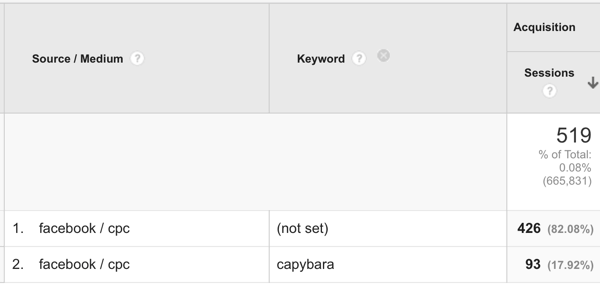
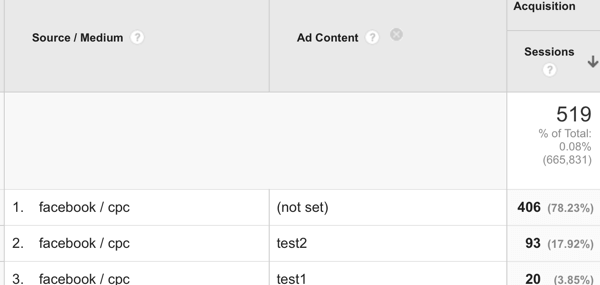
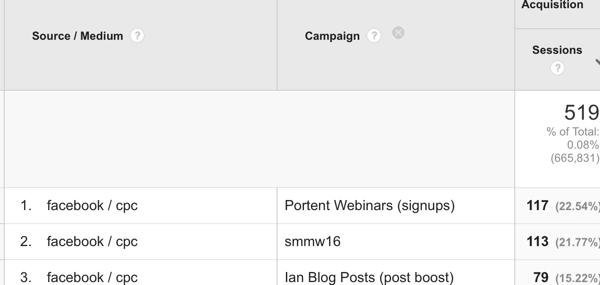
Campaign, Keyword, and Content
You'll find utm_campaign, utm_keyword, and utm_content more versatile. You can leave these values blank or set them as desired. Keep in mind that they're a great way to add detail to your data.
If you're not using keyword targeting in social ads, use utm_keyword to tag targeting criteria. If you're doing organic posts, you typically won't use utm_keyword at all.
It's helpful to use utm_content for A/B testing of images, entire ads, and posts. In fact, you can use utm_content for anything the reader sees.
Use utm_campaign for grouping topical, time-based, or campaign-based content.
General Tagging Tips
When tagging, follow these guidelines:
Use lowercase for all of your tags. Most analytics toolsets are case-sensitive, so “Facebook” isn't the same as “facebook.” Using lowercase simplifies naming.
Use consistent variable names. Don't switch from “ppc” to “cpc” and back again. Simply use “cpc.”

Discover Proven Marketing Strategies and Tips
Want to go even deeper with your marketing? Check out the Social Media Marketing Podcast! Publishing weekly since 2012, the Social Media Marketing Podcast helps you navigate the constantly changing marketing jungle, with expert interviews from marketing pros.
But don’t let the name fool you. This show is about a lot more than just social media marketing. With over 600 episodes and millions of downloads each year, this show has been a trusted source for marketers for well over a decade.
Set the variables. When you can, set the source and medium. Don't leave social media tagging up to your analytics tool.
Set tagging standards and document those standards for every person responsible for tagging. Paste the tagging standards into templates.
#2: Track Micro-conversions
Once your tagging is set up, it's time to focus on micro-conversions. Most conversions occur after a series of events.
For example, John Smith sees a review of your product, clicks through to the product page and reads a review, but doesn't make a purchase. The next day when he does a search, the product shows up in a PPC ad. Although he has some interest, he doesn't click it.
When he sees a sponsored post two days later, he clicks it and makes a purchase from you and subscribes to your newsletter. A month later, he makes another purchase after receiving a special offer via email.
Although the sequence will differ for each customer, two things happened on the way to this customer making a purchase:
- The customer interacted with you several ways. Each one was significant. You need to track micro-conversions to know that.
- The customer returned to your site from one of several sources. Each source was important and generated different micro-conversions. You need to use attribution modeling to understand that.
Micro-conversions
A lot of little but measurable activities (spending time on your website, subscribing to your newsletter, etc.) can happen on the way to a purchase. Each activity is a small event that indicates value; it's a micro-conversion. Monitoring micro-conversions lets you track bottom-line contribution down to the last click. And if you properly tag URLs, you can attribute micro-conversions to sources.
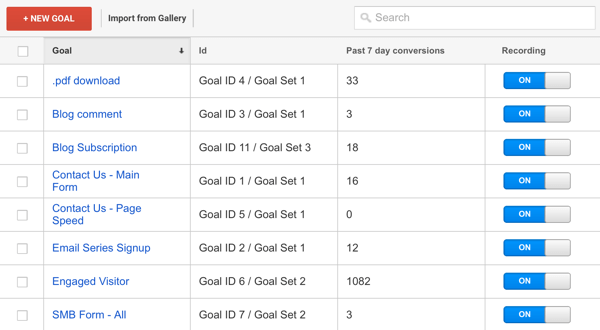
Google Analytics lets you set up conversion goals, which can be URL-based (like the landing page after someone subscribes to your newsletter) and event-based. For example, you can track when a visitor scrolls down a certain distance on a page or record visits longer than 2 minutes.
By tracking micro-conversions, you can measure the value generated by sources and initiatives that don't generate last-click conversions, such as a social media campaign that drives traffic to a piece of lightly branded content.
Attribution
In the example above, John Smith first came to your site via a product review. The next day, a PPC ad sparked interest, and when he saw a sponsored post a few days later, he clicked it and made a purchase. A month later, he clicked an email offer and made a purchase.
All of these clicks generated micro-conversions, which are important, but all you can show your boss is the last click.
This is where attribution reporting comes in. It will let you see how different channels, sources, and media generated micro- and macro-conversions. In the report below, social media generated 3% of all last-click conversions. It also assisted in another 4% of other last-click conversions, so it has value beyond what the last-click data shows.
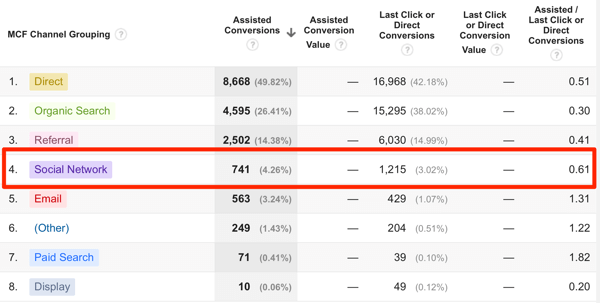
This data is imprecise because it's showing assists; it's not counting touches or examining individual paths. So while you can't say social media was the second click in 10 transactions, for example, you could say social media assisted in 10 transactions.
Though not perfect, attribution is a valuable piece of information that helps you understand revenue sources.
#3: Do the Math
Thanks to tagging, you're tracking micro-conversions and have a clearer picture of attribution. Now it's time to do the math. You need to attach value to those micro-conversions. The fact that an ad or social media post brought you 1,000 visitors who stayed on your site for more than 5 minutes only matters if those visitors are worth more than the average.
You can connect dollars to micro-conversions with a few standard Google Analytics reports; no fancy calculations required. If you sell products online, this formula will calculate average customer worth:
or
MCR * CV = micro-converting visitor value
Here's a breakdown of the variables:
- CR is the average macro-conversion rate.
- MCR is the macro-conversion rate for visitors who first made a particular micro-conversion.
- CV is the average conversion value.
For example, suppose you sell organic guinea pig treats online, and the average customer spends $50 per order (CV). Your site conversion rate (CR) is 5%, and visitors who register for your email newsletter (MCR) convert at 10%.
Here's what the average visitor is worth:
Here's what visitors who sign up for the email newsletter are worth:
The dollar amount isn't as important as the fact that visitors who sign up for your newsletter are worth twice as much to you. In other words, something good happens when people sign up for your email newsletter.
Now you can check to see how many people buy after they receive the newsletter, and how much they buy. It means that any source bringing email signups is worthwhile.
The bottom line is that spending social media dollars on generating email signups could be a great investment for you.
Tip: If you and your client/manager are unconvinced, try a holdout test: Turn off the channel/source. You can do this while minimizing other variables such as sales, special events, and new product launches. Then carefully track what happens.
Conclusion
Analytics isn't about quick fixes and “show me now” reporting; it's about the long-term tracking of trends and performance. Remember that, and you'll inspire everyone around you.
What do you think? Can you use these tips to start tracking ROI more effectively? Do you have some other ideas? Please share your thoughts in the comments below!
Attention Agency Owners, Brand Marketers, and Consultants

Introducing the Marketing Agency Show–our newest podcast designed to explore the struggles of agency marketers.
Join show host and agency owner, Brooke Sellas, as she interviews agency marketers and digs deep into their biggest challenges. Explore topics like navigating rough economic times, leveraging AI, service diversification, client acquisition, and much more.
Just pull up your favorite podcast app, search for Marketing Agency Show and start listening. Or click the button below for more information.
