Want to monitor YouTube ad performance more efficiently? Wondering how to streamline reporting and experiments?
In this article, you’ll learn how to measure YouTube ads with reports, dashboards, and experiments so you can run more successful video campaigns.

Leverage YouTube Ad Analytics
When you want a quick snapshot of your YouTube ad performance, it’s easy to jump between the Campaigns, Ad Groups, and Ads & Assets tabs in your Google Ads account. These tabs are great for spotting major performance issues and making sure each element of your campaign is delivering successfully.

Since these tabs offer both simple line graphs and spreadsheet-style analytics, they can provide a simple overview, as well as more in-depth data. But there’s a lot to explore under the surface.
If you’re relying on Google Ads’ preset columns or if you’re neglecting to use the platform’s segmentation tool or video analytics, you’re missing out on opportunities to gather key campaign insights. Let’s look at how to organize these analytics tabs and how to take a deeper dive into their most useful features.
#1: 7 Essential YouTube Ad Metrics
Google Ads’ preset columns are a good starting point. Yet none of the presets include all of the metrics you need to measure YouTube ads. I recommend creating custom column sets so you can easily review the data you need without worrying about missing a key metric.
To build a custom column set, go to the Campaigns tab, click Columns, and select Modify Columns. Add the metrics below and repeat the process by setting up similar sets at the ad group and ad levels. Then use these column sets to check performance across campaigns, ad groups, ads, and assets.
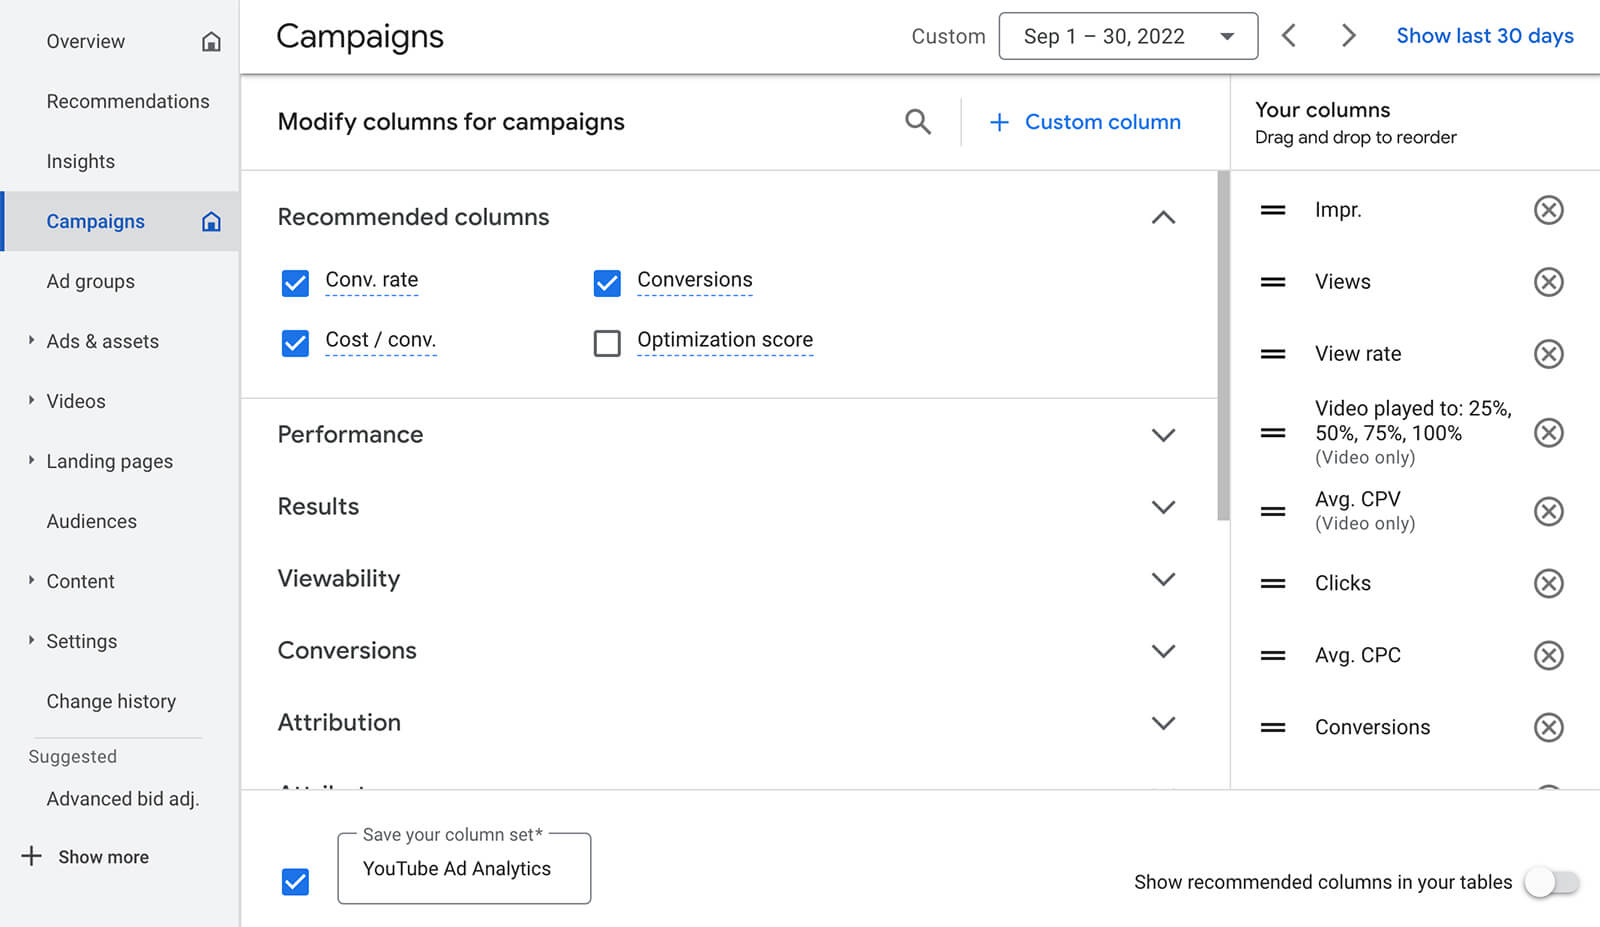
Impressions
Impressions reflects the number of times users see your YouTube video ads—either a thumbnail or an in-stream clip. While impressions almost certainly aren’t the end goal for a typical YouTube campaign, this metric can help you ensure that your campaign is delivering ads efficiently.
Views
Views indicates the number of times users watched your ad rather than simply seeing it, which gives you a slightly better way to gauge viewer interest. But keep in mind that Google Ads counts views a little differently depending on the length of the ad.
If the ad is less than 30 seconds, Google Ads tallies a view every time a user watches the entire ad. The platform doesn’t tally views for bumper ads or video ads less than 10 seconds long at all. So if you want to make sure viewers are seeing and engaging with these types of video ads, use impressions and interaction metrics instead.
View Rate
How frequently is your target audience viewing your ads? Google Ads’ view rate metric can show you how well your video ad is resonating with your audience. For example, a YouTube ad with a low view rate is probably generating a lot of Skip Ad interactions that result in incomplete plays.
Video Played To
Google Ads’ video played to metric reveals whether viewers are watching 25%, 50%, 75%, or 100% of the ad. You can use these percentages to identify points where your audience drops off and brainstorm ways to improve your ads.

If you find that viewers are almost always dropping off when the Skip Ad button appears in-stream, it’s worth reconsidering your ad structure. For example, it may be helpful to test more effective hooks or include more pertinent information in the first 5 seconds of the YouTube ad to ensure your message gets across.
Average CPV
Even if your bid strategy isn’t view-based, it’s useful to keep track of what you’re spending per view. I often find that average CPV (cost per view) is lowest for top-performing ads, making it a good measure of ad quality and a decent indicator of other success metrics.
Get World-Class Marketing Training — All Year Long!
Are you facing doubt, uncertainty, or overwhelm? The Social Media Marketing Society can help.
Each month, you’ll receive training from trusted marketing experts, covering everything from AI to organic social marketing. When you join, you’ll also get immediate access to:
- A library of 100+ marketing trainings
- A community of like-minded marketers
- Monthly online community meetups
- Relevant news and trends updates
Clicks
When you run brand awareness ads and other top-of-funnel campaigns, you might not expect to get a lot of clicks. But when you run product consideration, lead generation, and sales campaigns, clicks can be a good measure of effective targeting and a great indicator of audience interest. Plus clicks can lead to conversions—or your campaign’s end goal.
Conversions
Is your ad campaign driving results on your YouTube channel or website? The Conversions tab is your destination for measuring the leads, adds to cart, purchases, and other conversions that each campaign targets.
While you’re at it, add conversion rate and cost per conversion to the column preset, too. Conversion rate gives you a sense of how frequently your YouTube ads are driving results, while cost per conversion helps ensure you’re spending the right amount for results.
#2: Segment YouTube Advertising Data
Getting an overview of your YouTube campaign performance is a smart first step. With Google Ads’ segmentation tool, you can take a deeper dive into the data and see what’s really happening at each level of the campaign.
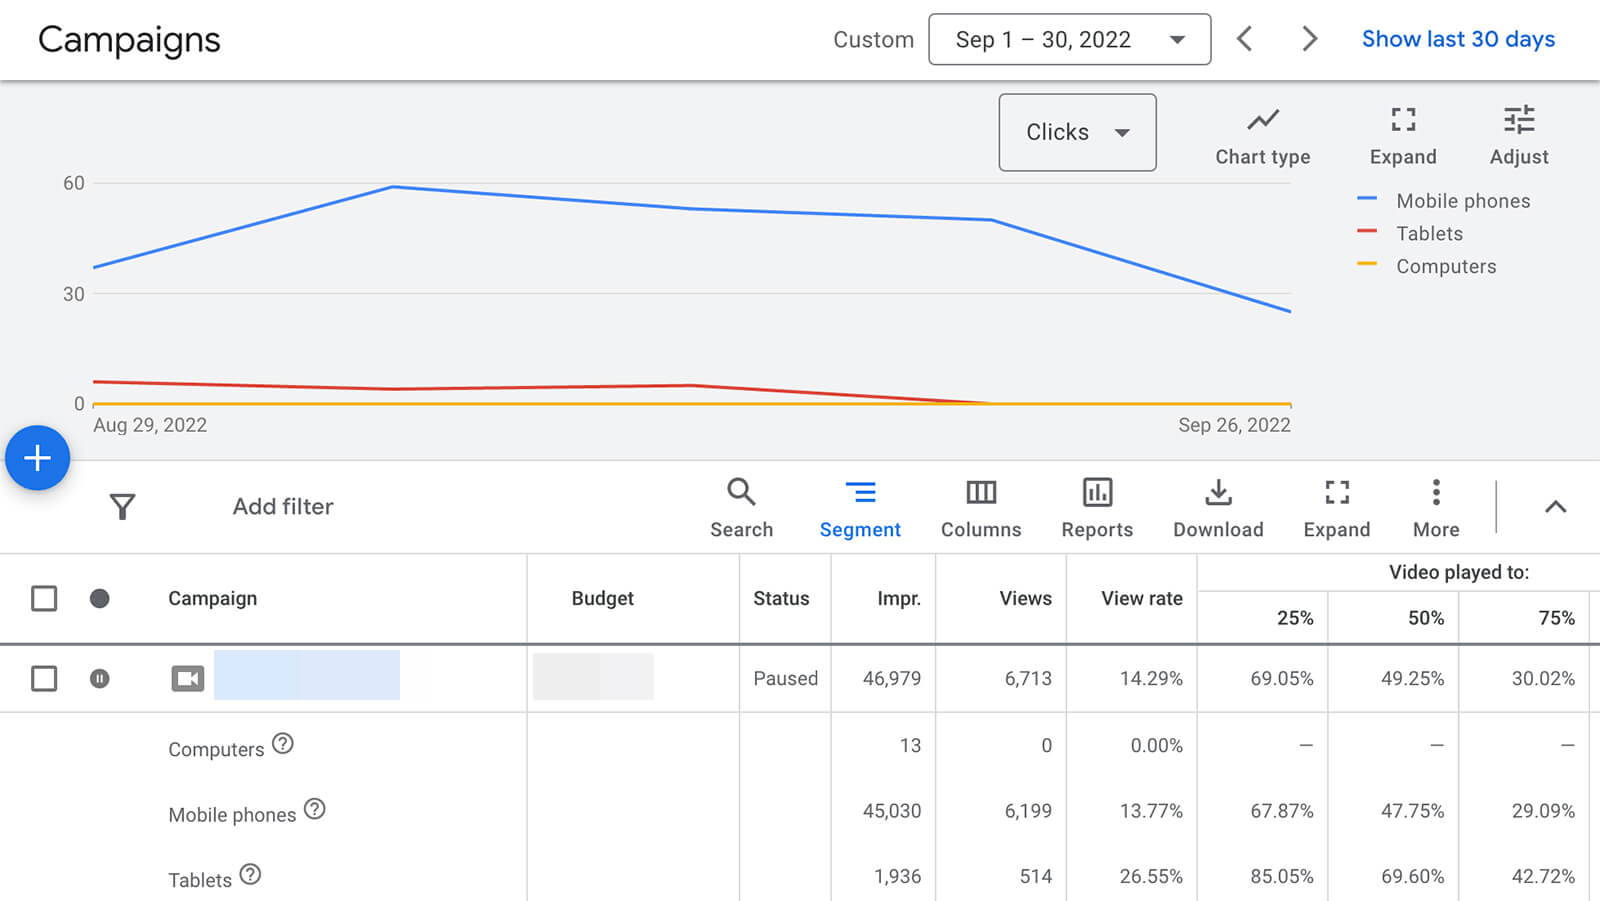
On the Campaigns, Ad Groups, or Ads & Assets tab, choose a column preset for video ads. Then use the segment drop-down to take a closer look at your data. You can analyze campaigns using segments ranging from conversion timing to click type to device type.
For example, the device segment (below) can help you identify which devices to target and which you can consider excluding.
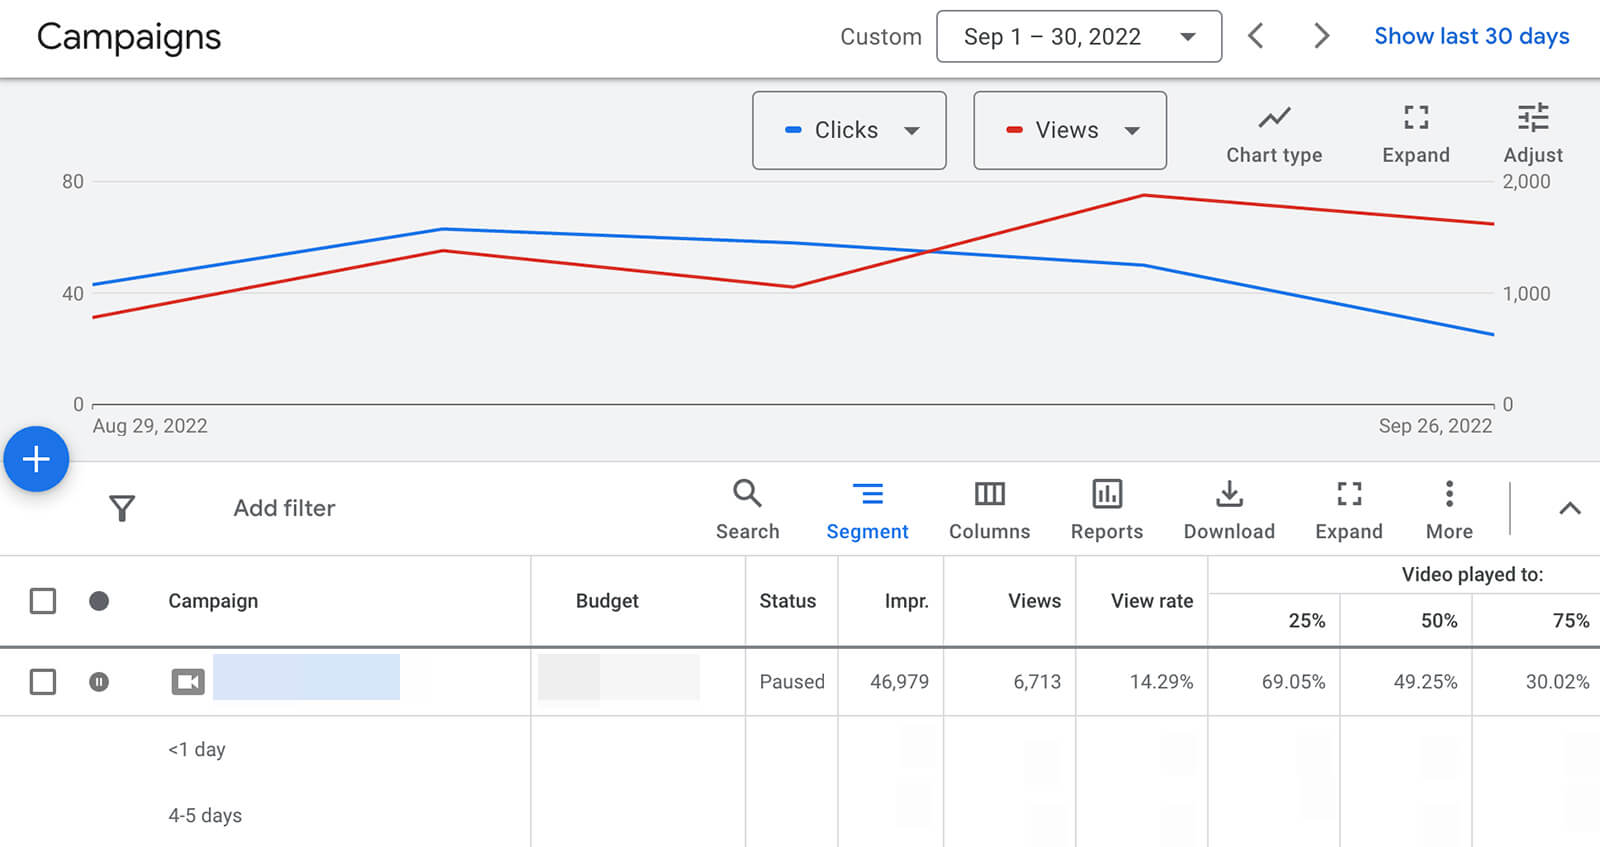
The days to conversion segment (below) can help you find the ideal timing and frequency for your YouTube campaigns. You might consider additional touchpoints to decrease the average days to conversion.
Likewise, the new versus returning users segment is ideal for zeroing in on the right audiences. It can help you determine whether to broaden your targeting and prioritize new users or if you should focus on re-engaging returning users instead.
Review Video Ad Analytics
Using the workflows above, you can measure campaign, ad group, and ad performance on and off of YouTube. Yet it’s just as important to track individual video analytics, no matter how many you’ve included in each ad group.
Metrics like earned subscribers and earned likes let you gauge audience interest and measure on-video engagement. But is your target audience watching your ads longer than necessary, or are they skipping as soon as possible? Which audience segments respond best to your video ads?
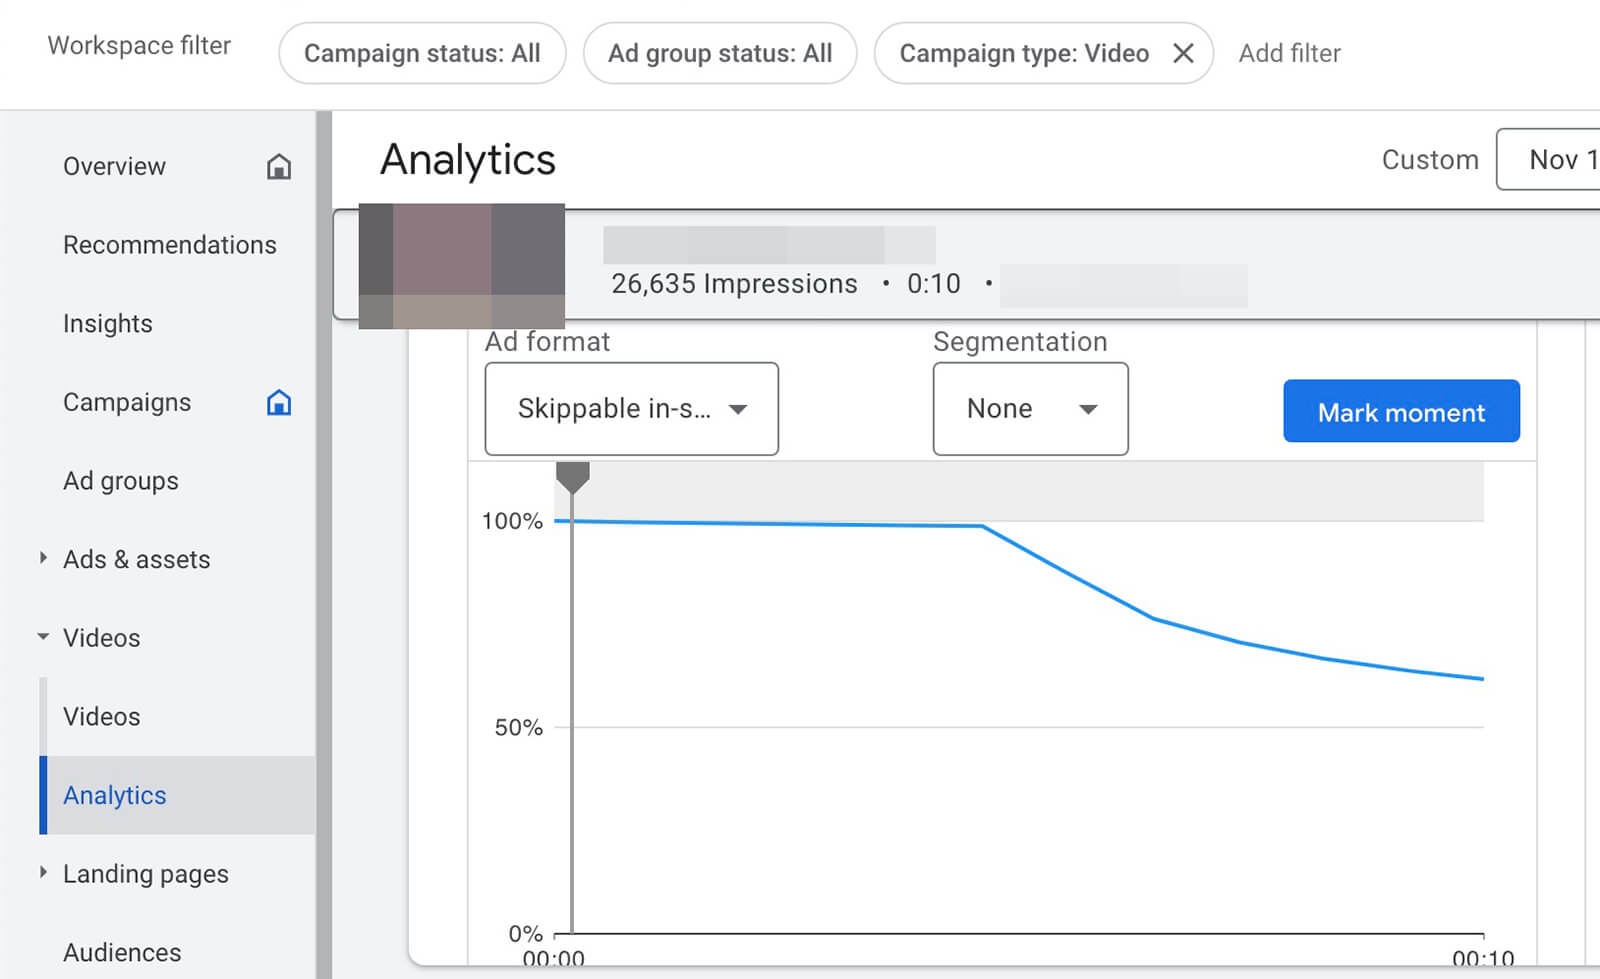
Google Ads’ Video Analytics tab has tons of helpful audience retention data. The graph shows you when your audience tends to click away from your ad, and you can use the ad format drop-down menu to see which format drives the highest retention.
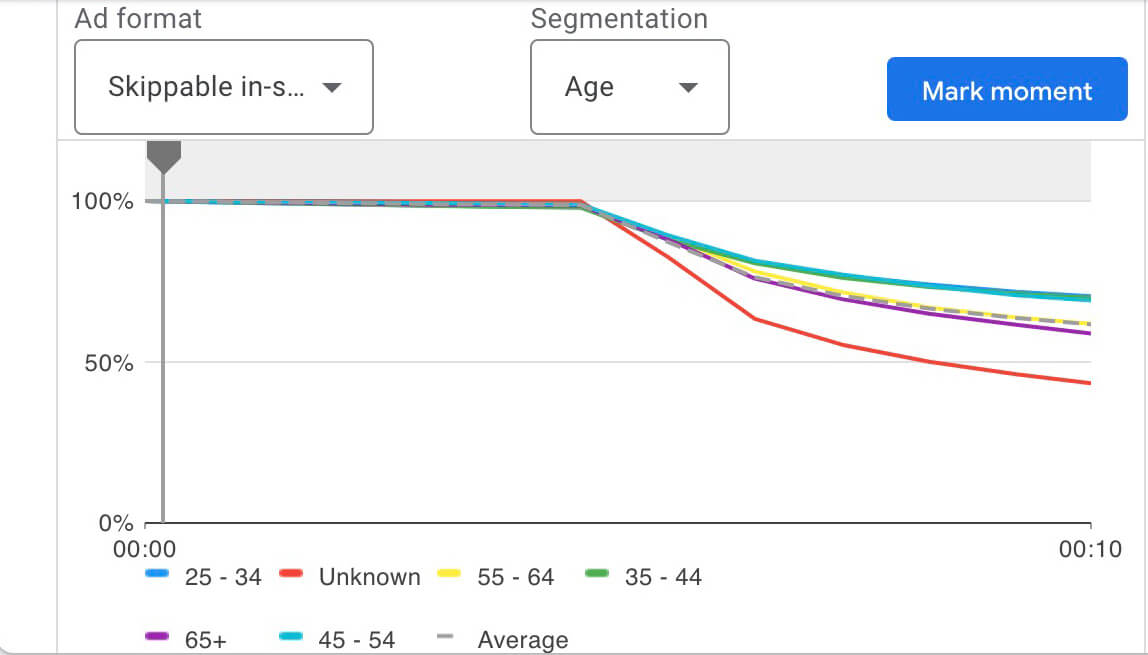
Want to know which demographic segments contribute to the highest retention? Use the segmentation drop-down to view retention analytics by age, gender, device, and other options.

Discover Proven Marketing Strategies and Tips
Want to go even deeper with your marketing? Check out the Social Media Marketing Podcast! Publishing weekly since 2012, the Social Media Marketing Podcast helps you navigate the constantly changing marketing jungle, with expert interviews from marketing pros.
But don’t let the name fool you. This show is about a lot more than just social media marketing. With over 600 episodes and millions of downloads each year, this show has been a trusted source for marketers for well over a decade.
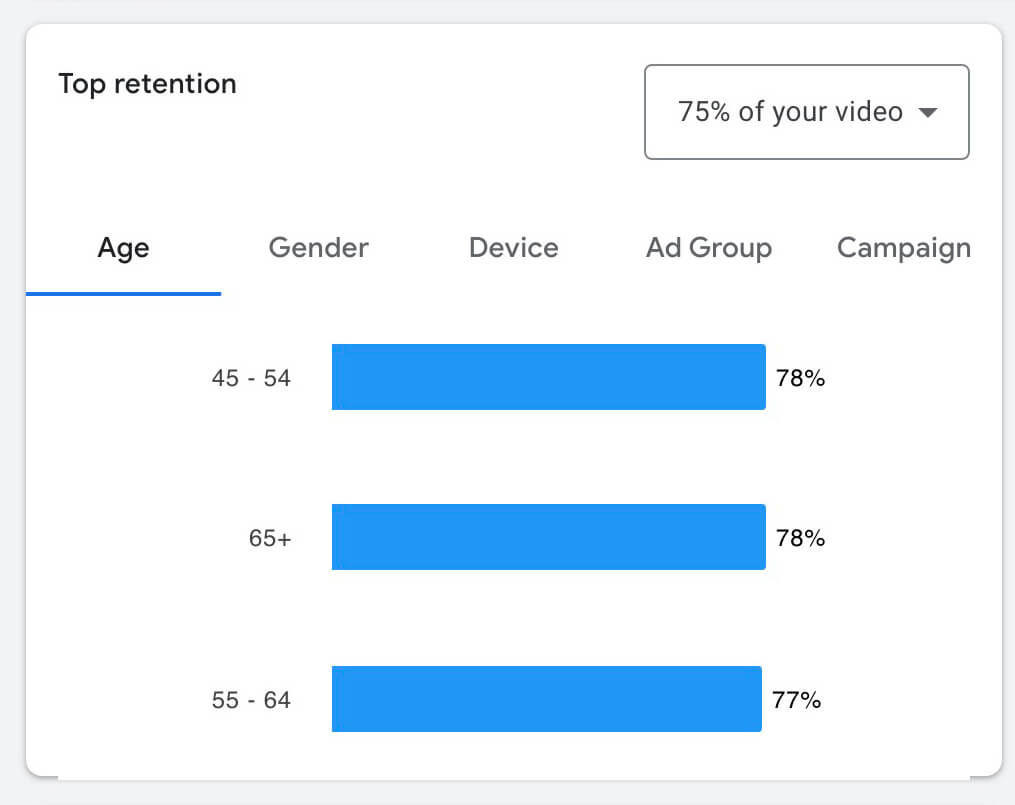
You can also use the top retention panel to see which segments watched 25%, 50%, 75%, or 100% of video ads. Find that your YouTube ads resonate more with certain age groups or device users? Consider using this data to improve targeting or build new audiences.
#3: Share YouTube Ad Reports
Technically, you can download and distribute YouTube ad analytics directly from the Campaigns, Ad Groups, and Ads & Assets tabs. But if you already have these tabs set up to display certain columns, timeframes, and filters, you won’t want to take the time to modify them for reports.
Instead, use Google Ads’ Reports tab to build templates that you can reuse for all of your YouTube ad campaigns. With these templates, it’s easy to create line, bar, or scatter charts that visualize campaign results and help analyze performance.
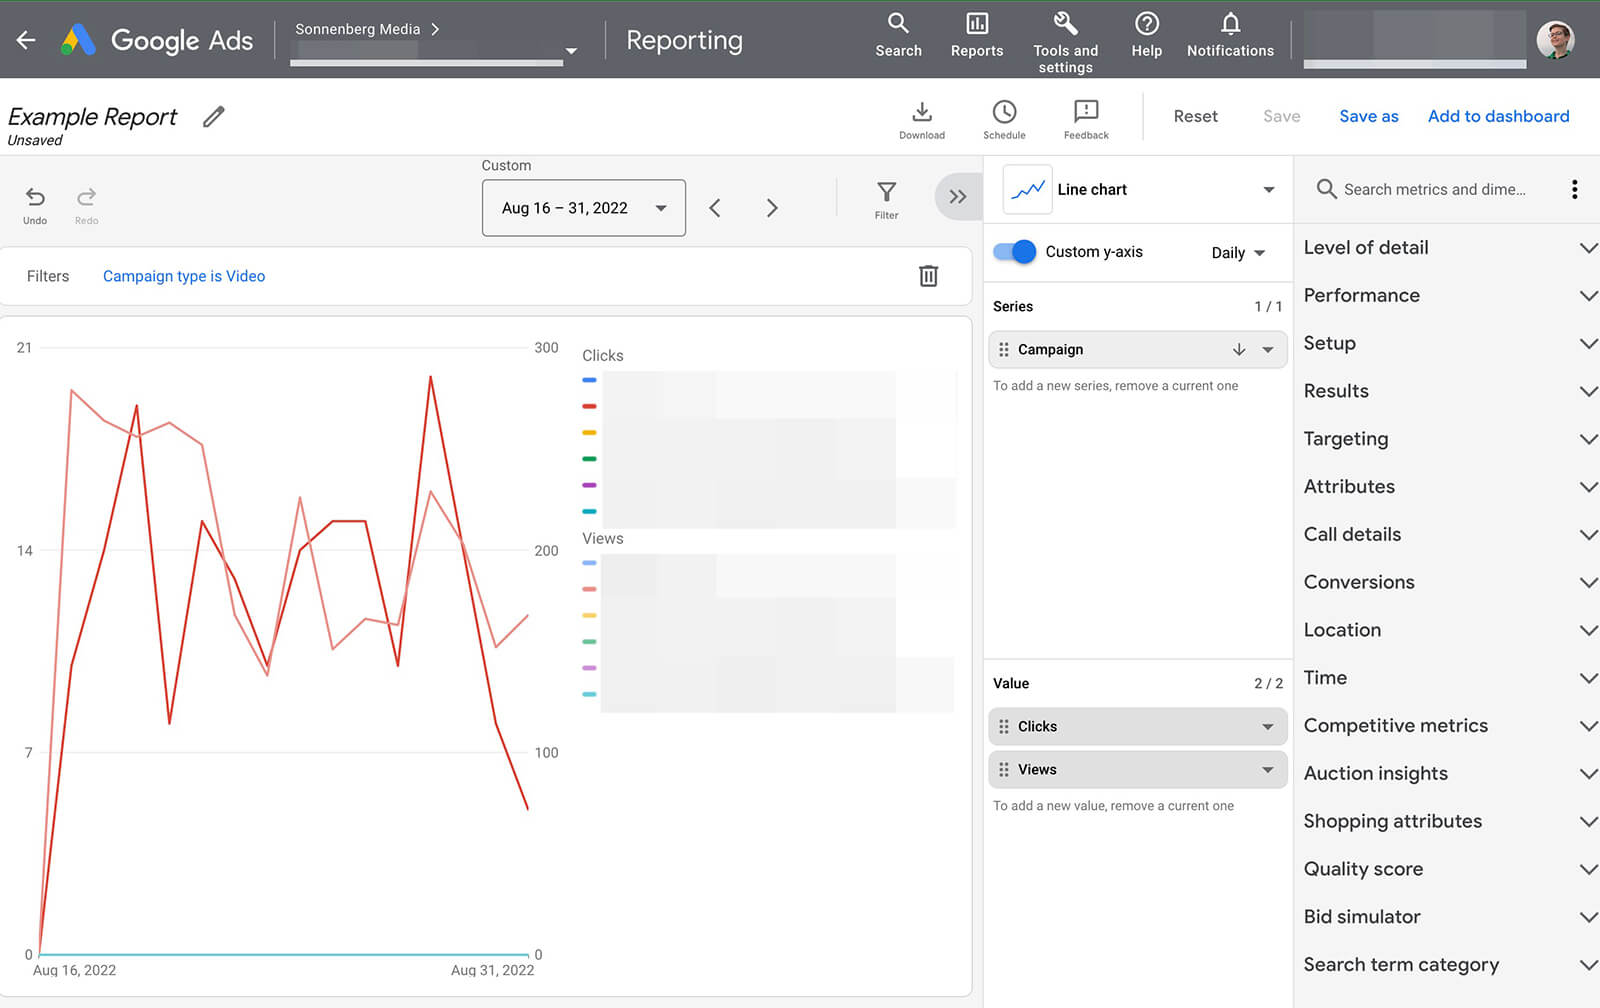
Prefer plugging campaign data into a third-party reporting template? After adding all of the metrics that matter to your team, you can download the data to an Excel spreadsheet or import it into Google Sheets. Just make sure to check the filters to ensure that your report includes video ads or specific campaigns only.
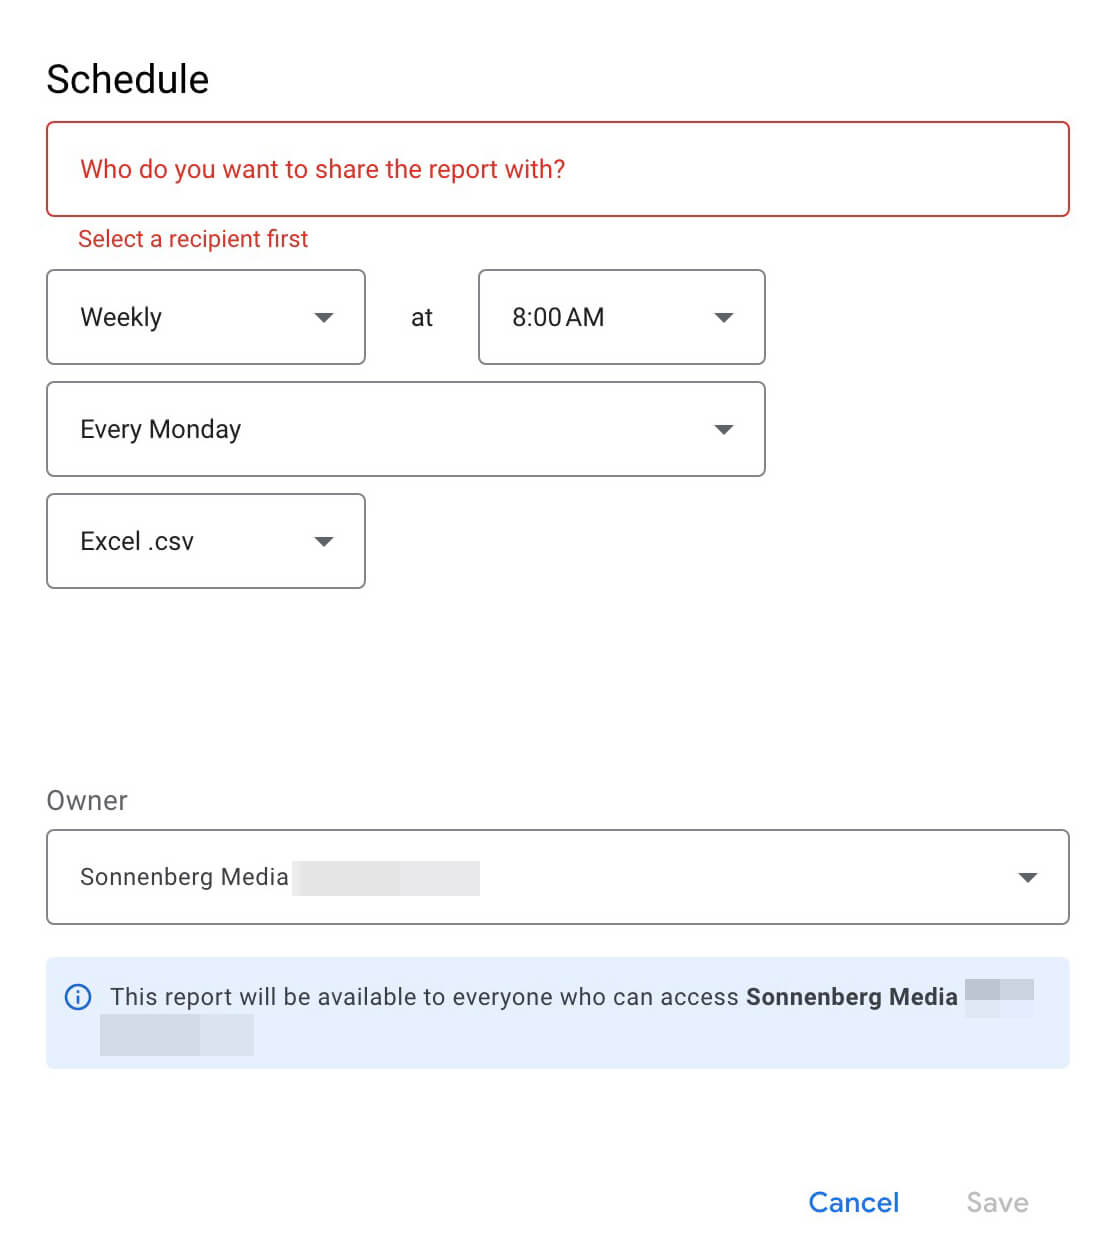
To save time, you can use Google Ads’ scheduling tool to keep team members and stakeholders in the loop. From the Reports tab, you can schedule daily, weekly, or monthly reports to prompt Google Ads to share them with colleagues automatically.
Although reports are ideal for sharing with internal teams and external clients, they can also guide optimizations and inform more frequent performance checks. Below, see how to incorporate reports into your YouTube ad dashboards.
#4: Create YouTube Ad Dashboards
While Google Ads’ Campaign, Ad Group, and Ads and Assets tabs offer primarily spreadsheet-style analytics, they do have simple graphs and charts. If you want more advanced visualizations, you’ll want to use Google Ads’ dashboard tool.
Dashboards let you visualize and monitor the data that matters most to your team. Since Google Ads doesn’t offer preset dashboards, you can customize yours completely, based on your advertising objectives.
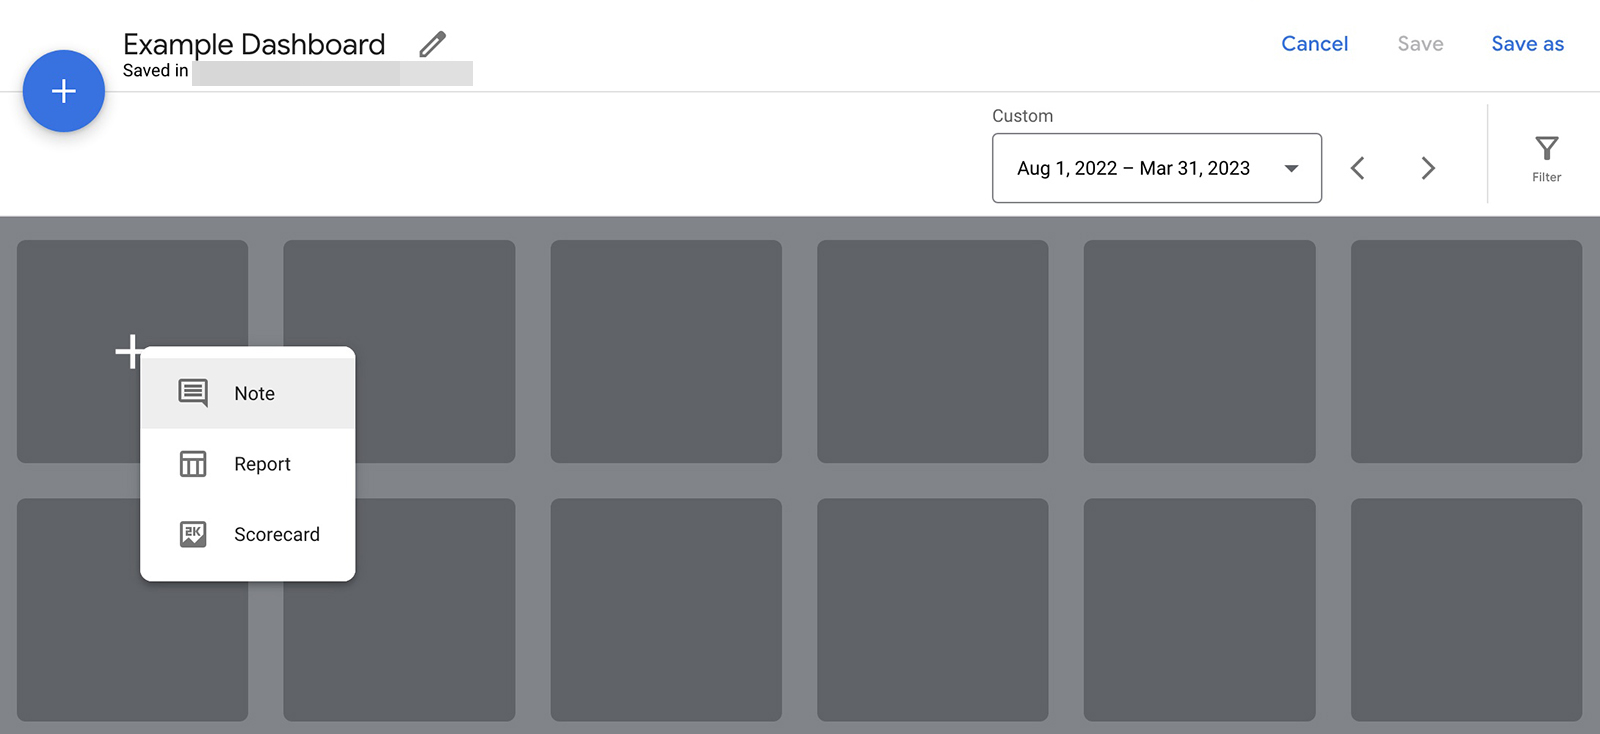
To build from scratch, select Reports in the main menu and click to create a new dashboard. Then click to add a new note, report, or scorecard to the dashboard. If you’ve already set up reports for your YouTube ads, you can easily plug them into a dashboard to make them easier for your team to access and act on. Let’s look at a couple of use cases.
Monitor Views and Engagements
If you’re running brand awareness ads, a dashboard focused on views and engagement can help ensure you’re reaching the right audience. For example, this kind of dashboard might include scorecards showing views and impressions, as well as graphs showing various “video played to” metrics.
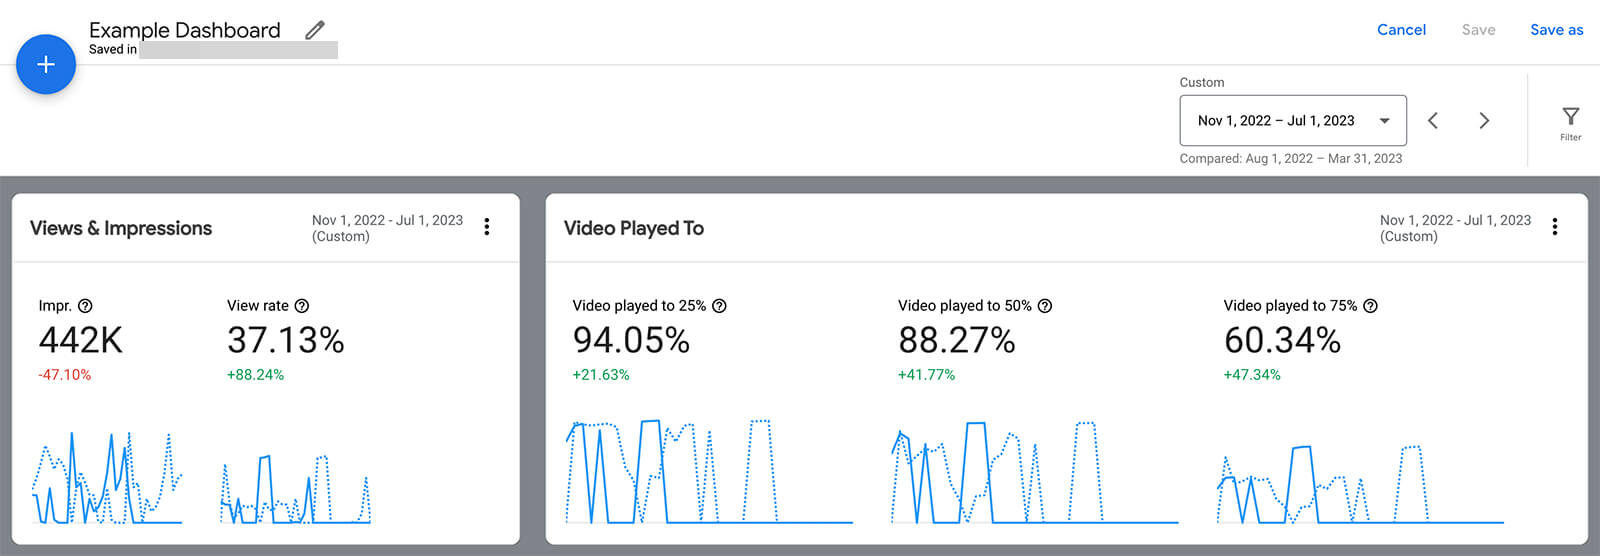
For more detailed insights, consider plugging a brand awareness report into the dashboard. That way, you can use the charts to get a quick overview of performance and scan the report for specifics.
Measure Clicks and Conversions
If you’re running a lead generation or sales campaign, a conversion-focused dashboard can ensure you’re getting the results you want. For example, this kind of dashboard might include scorecards showing clicks, clickthrough rate (CTR), conversions, and conversion rate.
To add more detail to the dashboard, plug in a premade report focused on clicks and conversions. You can also add a custom note explaining the funnel stage or the conversions you’re targeting.
Track Cost Metrics
No matter which stage of the funnel you’re targeting, it’s essential to track cost metrics. With a cost-focused dashboard, you can ensure your team is on the same page about campaign budgets and bid strategies.
For example, you can add scorecards and related reports detailing anything from average cost to average CPV. That way, you can track ad spend over time and spot unusual patterns that may signal performance issues.
#5: Run YouTube Ad Experiments
The more you monitor YouTube campaign analytics, the more ideas you’ll get for improving your ads. With analytics and segmentation at every campaign level, you can get a pretty good idea of what is or isn’t working for a specific campaign. But how do you know which elements to apply to future campaigns?
With Google Ads’ experiments tool, you can test different creatives in your YouTube ads and compare the results against each other. Then you can collect definitive data on the kinds of videos that work best for your business, offer, and audience.
Note that the Google Ads experiments tool draws on your active campaigns. So before you set up an experiment, create at least two campaigns to test. The easiest way to do that is to build one campaign with the budget, audience targeting, and conversion tracking you want to use. Next, copy the campaign to carry over the settings.
You can test up to four campaigns in a YouTube ads experiment. But it’s important to note that this tool compares video creatives only. All other settings should be the same among all the campaigns. By comparing video creatives, you can answer questions like:
- Does your audience respond better to short-form or long-form video ads?
- Do voiceovers or interviews resonate better with your audience?
- Does your audience prefer animated or live-action videos?
- Do Google Ads’ video ad templates drive more conversions?
Once you’ve set up your test YouTube campaigns in Google Ads, go to the Experiments tab in the left-hand menu. Click to start a new test and choose the video experiment option.
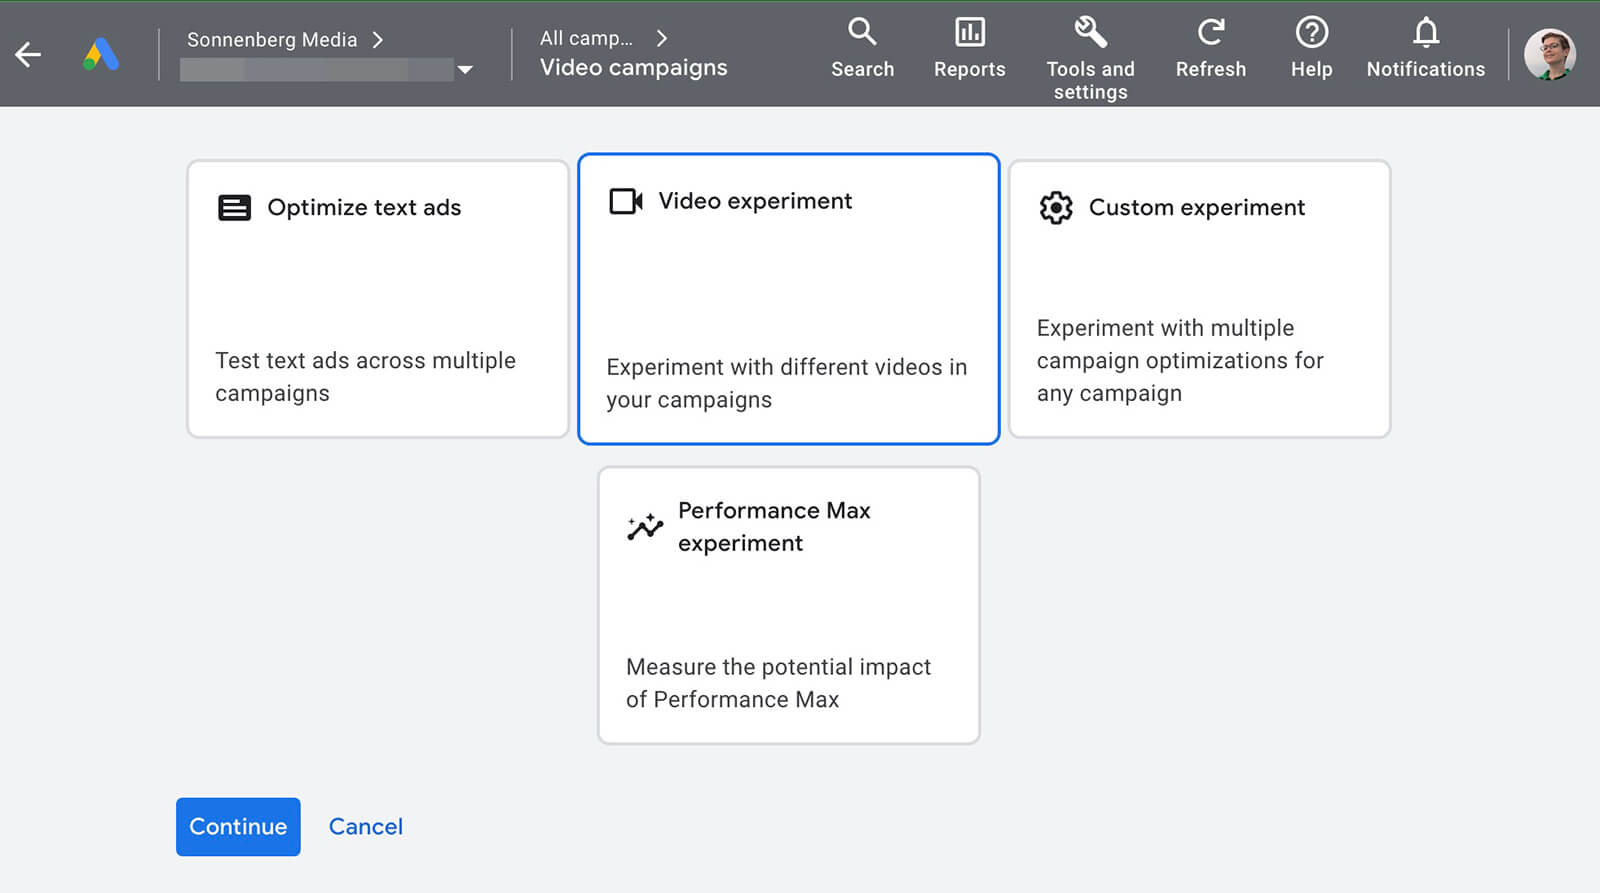
Then select the campaigns you want to test and give each a name.
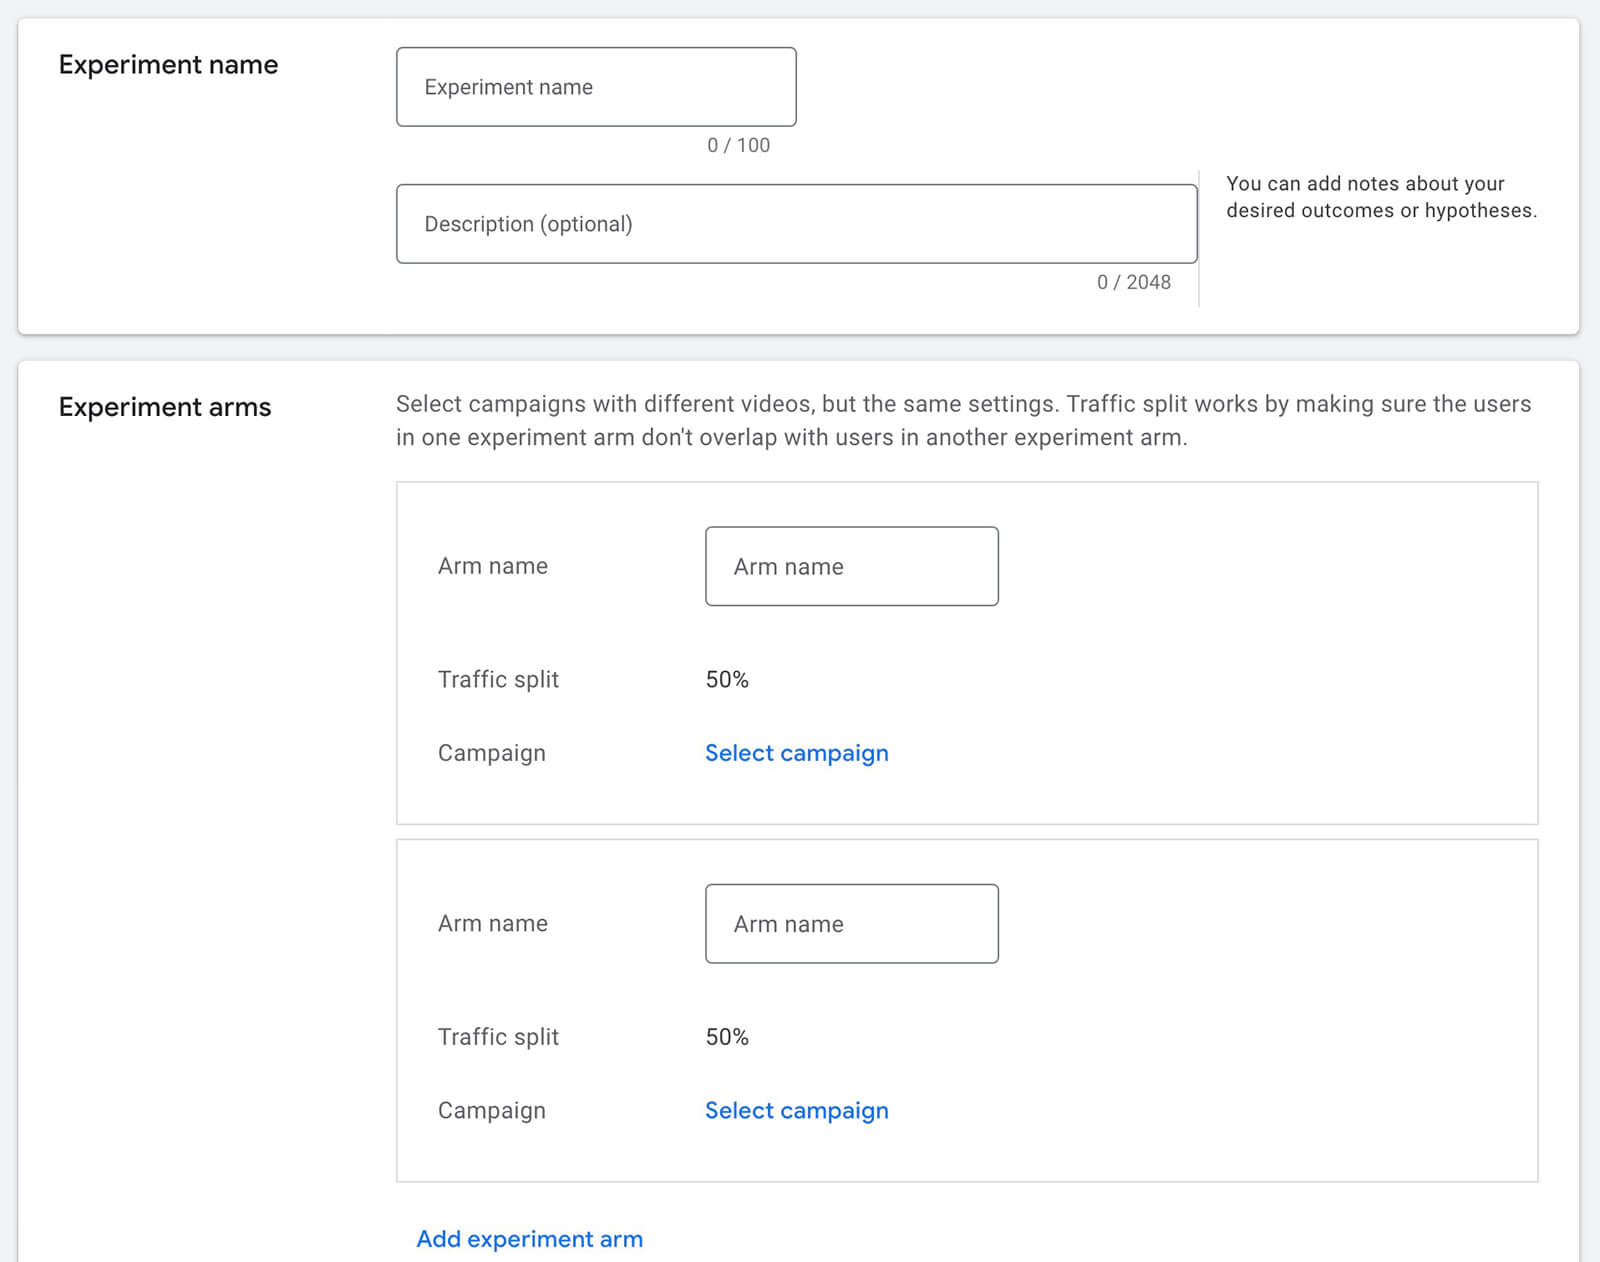
Google Ads automatically divides traffic evenly between all test campaigns and begins the experiment on the earliest start date of all of the campaigns you’ve picked. It also designates a success metric automatically.
If you’re used to running A/B tests in Meta Ads Manager or LinkedIn Campaign Manager, note that Google Ads’ experiments tool works a little differently. Each test campaign has to get at least 100 conversions to deliver statistically significant results. Make sure you can estimate how long that will take so you know how long to run the test.
In addition, you’ll need to end the experiment once you have the data you need to declare a winner. You can use the analytics, reports, and dashboards we covered above to review the results. Then you can keep running the winning campaign and apply what you’ve learned to improve existing campaigns and optimize future campaigns.
Conclusion
Google Ads has a robust suite of tools for measuring and improving YouTube ads. When you know what to track, how to interpret analytics, and how to apply what you’ve learned, you can run more successful and cost-effective YouTube ad campaigns.
Stay Up-to-Date: Get New Marketing Articles Delivered to You!
Don't miss out on upcoming social media marketing insights and strategies! Sign up to receive notifications when we publish new articles on Social Media Examiner. Our expertly crafted content will help you stay ahead of the curve and drive results for your business. Click the link below to sign up now and receive our annual report!
Attention Agency Owners, Brand Marketers, and Consultants

Introducing the Marketing Agency Show–our newest podcast designed to explore the struggles of agency marketers.
Join show host and agency owner, Brooke Sellas, as she interviews agency marketers and digs deep into their biggest challenges. Explore topics like navigating rough economic times, leveraging AI, service diversification, client acquisition, and much more.
Just pull up your favorite podcast app, search for Marketing Agency Show and start listening. Or click the button below for more information.

