 Do you need to learn more about the Audience reports in Google Analytics?
Do you want to know more about your website visitors?
Understanding the demographics, behaviors and interests of your website visitors improves your online marketing.
In this article I’ll share what data is found in the Google Analytics’ Audience section and how it can apply to your online marketing strategy.

Note: One way to get the most out of any Google Analytics data is to set up conversion goals. If you haven’t done this already, set up the easiest goal type by reviewing the first point under the Google Analytics Admin header in this Google Analytics Basics post.
The Audience Reports
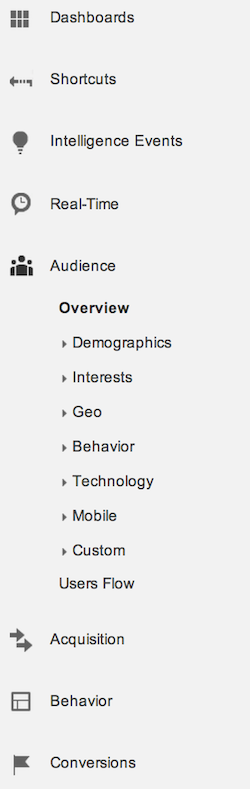
There are nine separate reporting sections under Audience in your website’s Google Analytics profile.
With the exception of Overview and Users Flow, each section includes an easy-to-read sessions graph and table chart showing the acquisition, behavior and conversions data for each group.
Below is a brief description of what data you’ll find in each reporting section, based on the reporting period you define in the date range drop-down menu.
Overview—A top-level view of user metrics
Demographics—The age and gender makeup of your website audience
Interests—User behaviors segmented by affinity and marketing categories
Geo—The languages and locations of your website audience
Behavior—Comparisons of new and returning visitors, how often return visits occur and how long visitors spend on your site
Get World-Class Marketing Training — All Year Long!
Are you facing doubt, uncertainty, or overwhelm? The Social Media Marketing Society can help.
Each month, you’ll receive training from trusted marketing experts, covering everything from AI to organic social marketing. When you join, you’ll also get immediate access to:
- A library of 100+ marketing trainings
- A community of like-minded marketers
- Monthly online community meetups
- Relevant news and trends updates
Technology—The browsers, operating systems and networks of your website visitors
Mobile—A breakdown of devices used to access your website
Custom—Reports you define
Users Flow—A visualization of how users move through your website
Now, let’s dive into the Audience report sections of Google Analytics. You can access it using the menu in the left sidebar of your Google Analytics dashboard.
#1: Overview
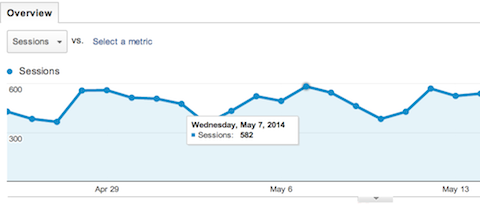
The Audience Overview is generally what you see when you first log into your website’s Google Analytics. At the top of the Overview tab is a graph of the number of sessions performed by website users.
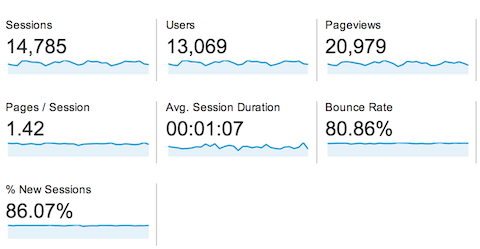
Beneath the graph are top-level session details showing you the number of users who have performed sessions on your website, pageviews, pages per session, average session duration, bounce rate and the percentage of new sessions.
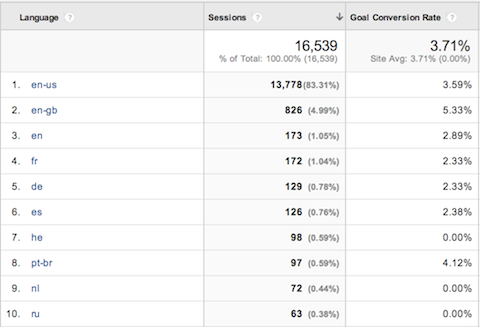
At the bottom of the Audience Overview are quick links to top demographic, system and mobile data, along with a chart showing the number of sessions on your website from visitors speaking a particular language.
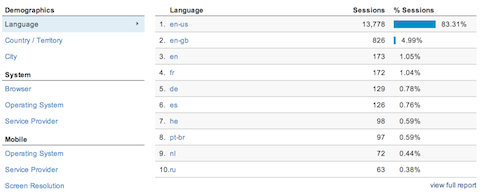
You can click on each of the links to see the first ten rows of data from each of the referenced reports, or you can access the full reports from the corresponding section on left sidebar menu under Audience.
#2: Demographics
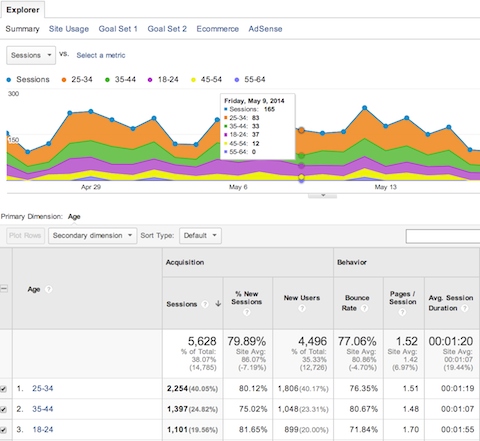
The Demographics Overview breaks down your visitors by age and gender.
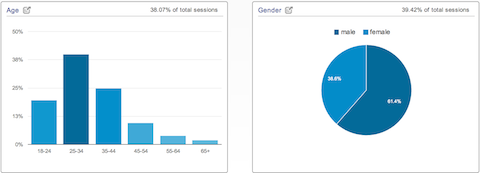
You can access the full Age and Gender category reports by clicking the link in each chart or from the left sidebar menu.
If you’re tracking goals in Google Analytics, look at the data next to your conversion rates in these reports to find out which age groups and gender are mostly likely to convert.
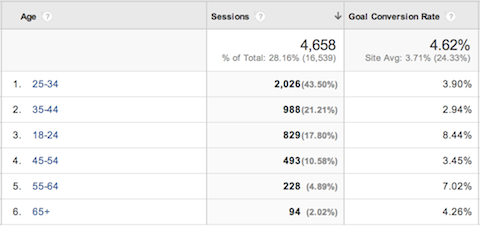
For example, if you’re targeting an audience for social media advertising, especially on networks like Facebook, the table above shows that people in the 18–24 and 55–64 age groups are your highest converting website visitors.
Creating ads that are specific to these age groups will increase the likelihood of making a conversion.
#3: Interests
Curious what your website visitors are interested in? The Interests Overview will show you just that.
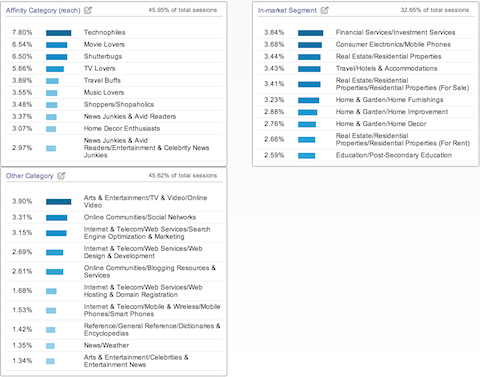
There are three reporting categories under the Interests section.

Discover Proven Marketing Strategies and Tips
Want to go even deeper with your marketing? Check out the Social Media Marketing Podcast! Publishing weekly since 2012, the Social Media Marketing Podcast helps you navigate the constantly changing marketing jungle, with expert interviews from marketing pros.
But don’t let the name fool you. This show is about a lot more than just social media marketing. With over 600 episodes and millions of downloads each year, this show has been a trusted source for marketers for well over a decade.
- Affinity Category—Affinity categories are used to reach potential customers to make them aware of your brand or product. These are users higher in the purchase funnel, near the beginning of the process.
- In-Market Segment—Users in these segments are more likely to be ready to purchase products or services in the specified category. These are users lower in the purchase funnel, near the end of the process.
- Other Category—These are more granular categories than Affinity or In-market, and let you identify users who are not in those other categories.
If you’re an advertiser, the data in these reports can help you effectively target ads based on specific interests, especially if you use goals to know which interest group is mostly likely to convert.
Publishers can use this data to target their content toward the main interests of audiences that already come to their website.
#4: Geo
The Geo section covers the language and location of your website visitors.
While the Language and Location categories both include the standard charts showing the acquisition, behavior and conversions data, the Location portion also has a map that visually displays your visitors’ locations.
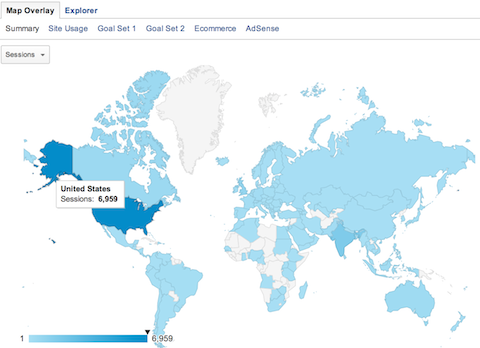
The map is extremely useful for targeting social and search ads—especially if you know the locations and languages of visitors most likely to convert using your Google Analytics goals.
It can also come in handy for local businesses that want to know if their marketing efforts are driving traffic from the right regions, and for publishers who want to create content that is locally focused.
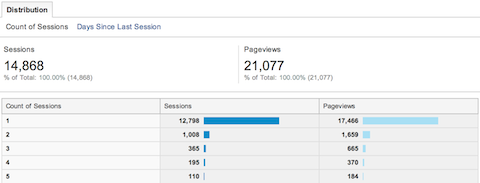
#5: Behavior
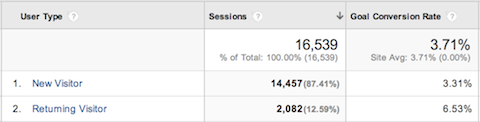
The Behavior section includes detailed category reports New vs. Returning Visitors, Frequency & Recency and Engagement. These reports tell you more about how often a visitor comes to your website, how many days on average it is between sessions for repeat visitors, how long visitors stay on your website and how many pages they visit while they’re there.
By using goals in Google Analytics, you can track the behavioral patterns of visitors who are most likely to convert. For example, you’ll know if you’re most likely to get the most conversions on a visitor’s first visit or returning visits.
If you notice returning visitors are more likely to convert, do everything in your power to get first-time visitors back onto your website by having them subscribe to your blog or email list.
If you notice new visitors are more likely to convert, aim for conversion optimization strategies that grab people on their first visit, such as exit intent pop-ups (like the ones that ask for your email or offer you a discount code as you’re leaving a site).
#6: Technology
If you want to learn more about the browsers, operating systems and Internet service providers your visitors use when visiting your website, look through the Technology reports.
There are two category reports in this section: Browser & OS and Network.
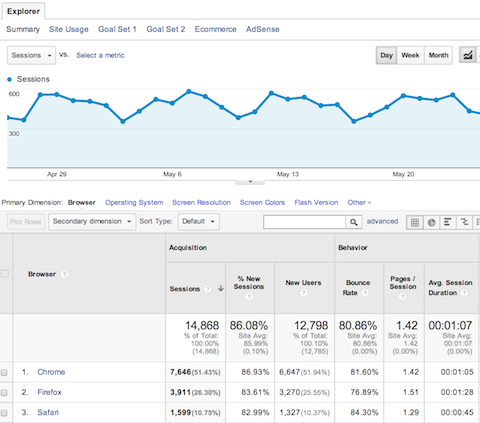
If your business creates online tools or software, you can use this to gauge whether you should be creating Chrome extensions or Mac-based desktop applications. You can also use this to make sure your website is working well in the top three browsers your visitors use.
#7: Mobile
Not sure if you should optimize for mobile? This is the area you need to visit. The Mobile Overview shows you the number of desktop, mobile and tablet users who visit your site.
The Mobile Devices category report shows you exactly what devices those visitors use.
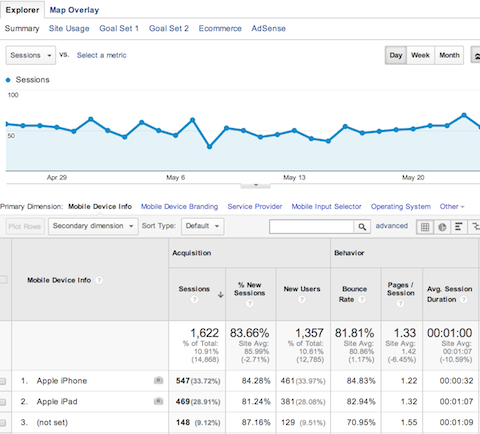
If you’re interested in creating an app for your business, now you’ll know if your visitors are more likely to use it on an Apple, Android or Windows device.
#8: Custom
This custom audience report goes beyond the standard reports. This is a more advanced report.
The other reports here are simple to access. You simply click on the link to get information.
With this custom report you have to define your own variables, metrics and dimensions to create a report. This is too advanced for this article. We'll cover this later when writing about custom reporting options.
#9: Users Flow
If you’re curious about the path your visitors take through your website, you can find it in the Users Flow.
Using the drop-down menu at the top left, you can see the flow of users based on language, location, browser, mobile device and similar dimensions of data.
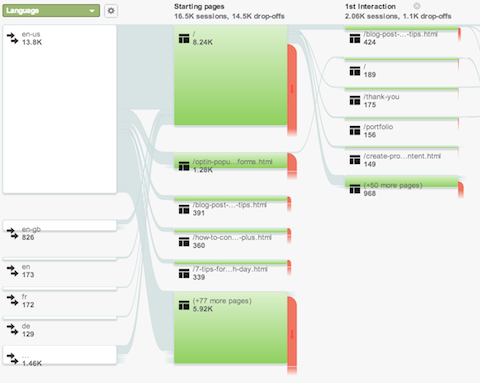
Follow users from the starting page where they enter through as many interactions as they make or pages they view on your site.
It’s an interesting way to see which pages on your website lead visitors to view even more pages.
Wrapping Up
I hope this has given you a good feel for what you can learn from your Audience reports and how you can apply it to other areas of your online marketing. In my next posts, I’ll continue to dive deeper into Google Analytics acquisition, behavior and conversions data to show you how to analyze and use the data to improve your blog or business!
What do you think? Will you take a deeper look into your audience data? How do you think audience data can inform your marketing? Share your comments and questions below!
Attention Agency Owners, Brand Marketers, and Consultants

Introducing the Marketing Agency Show–our newest podcast designed to explore the struggles of agency marketers.
Join show host and agency owner, Brooke Sellas, as she interviews agency marketers and digs deep into their biggest challenges. Explore topics like navigating rough economic times, leveraging AI, service diversification, client acquisition, and much more.
Just pull up your favorite podcast app, search for Marketing Agency Show and start listening. Or click the button below for more information.
