Thinking of doing more with paid advertising on Facebook and Instagram in 2022? Wondering how other marketers are doing things?
In this analysis, you'll discover the current metric and usage benchmarks you need to build a Facebook or Instagram ad strategy that converts in 2022.
Social Ad Spending Is Trending Up
There's been a lot of new money coming into social media ads.
For the first time, social media ad spend is expected to surpass paid search and grow by 25% by the end of 2021 (according to Marketing Charts interpretation of Zenith data).
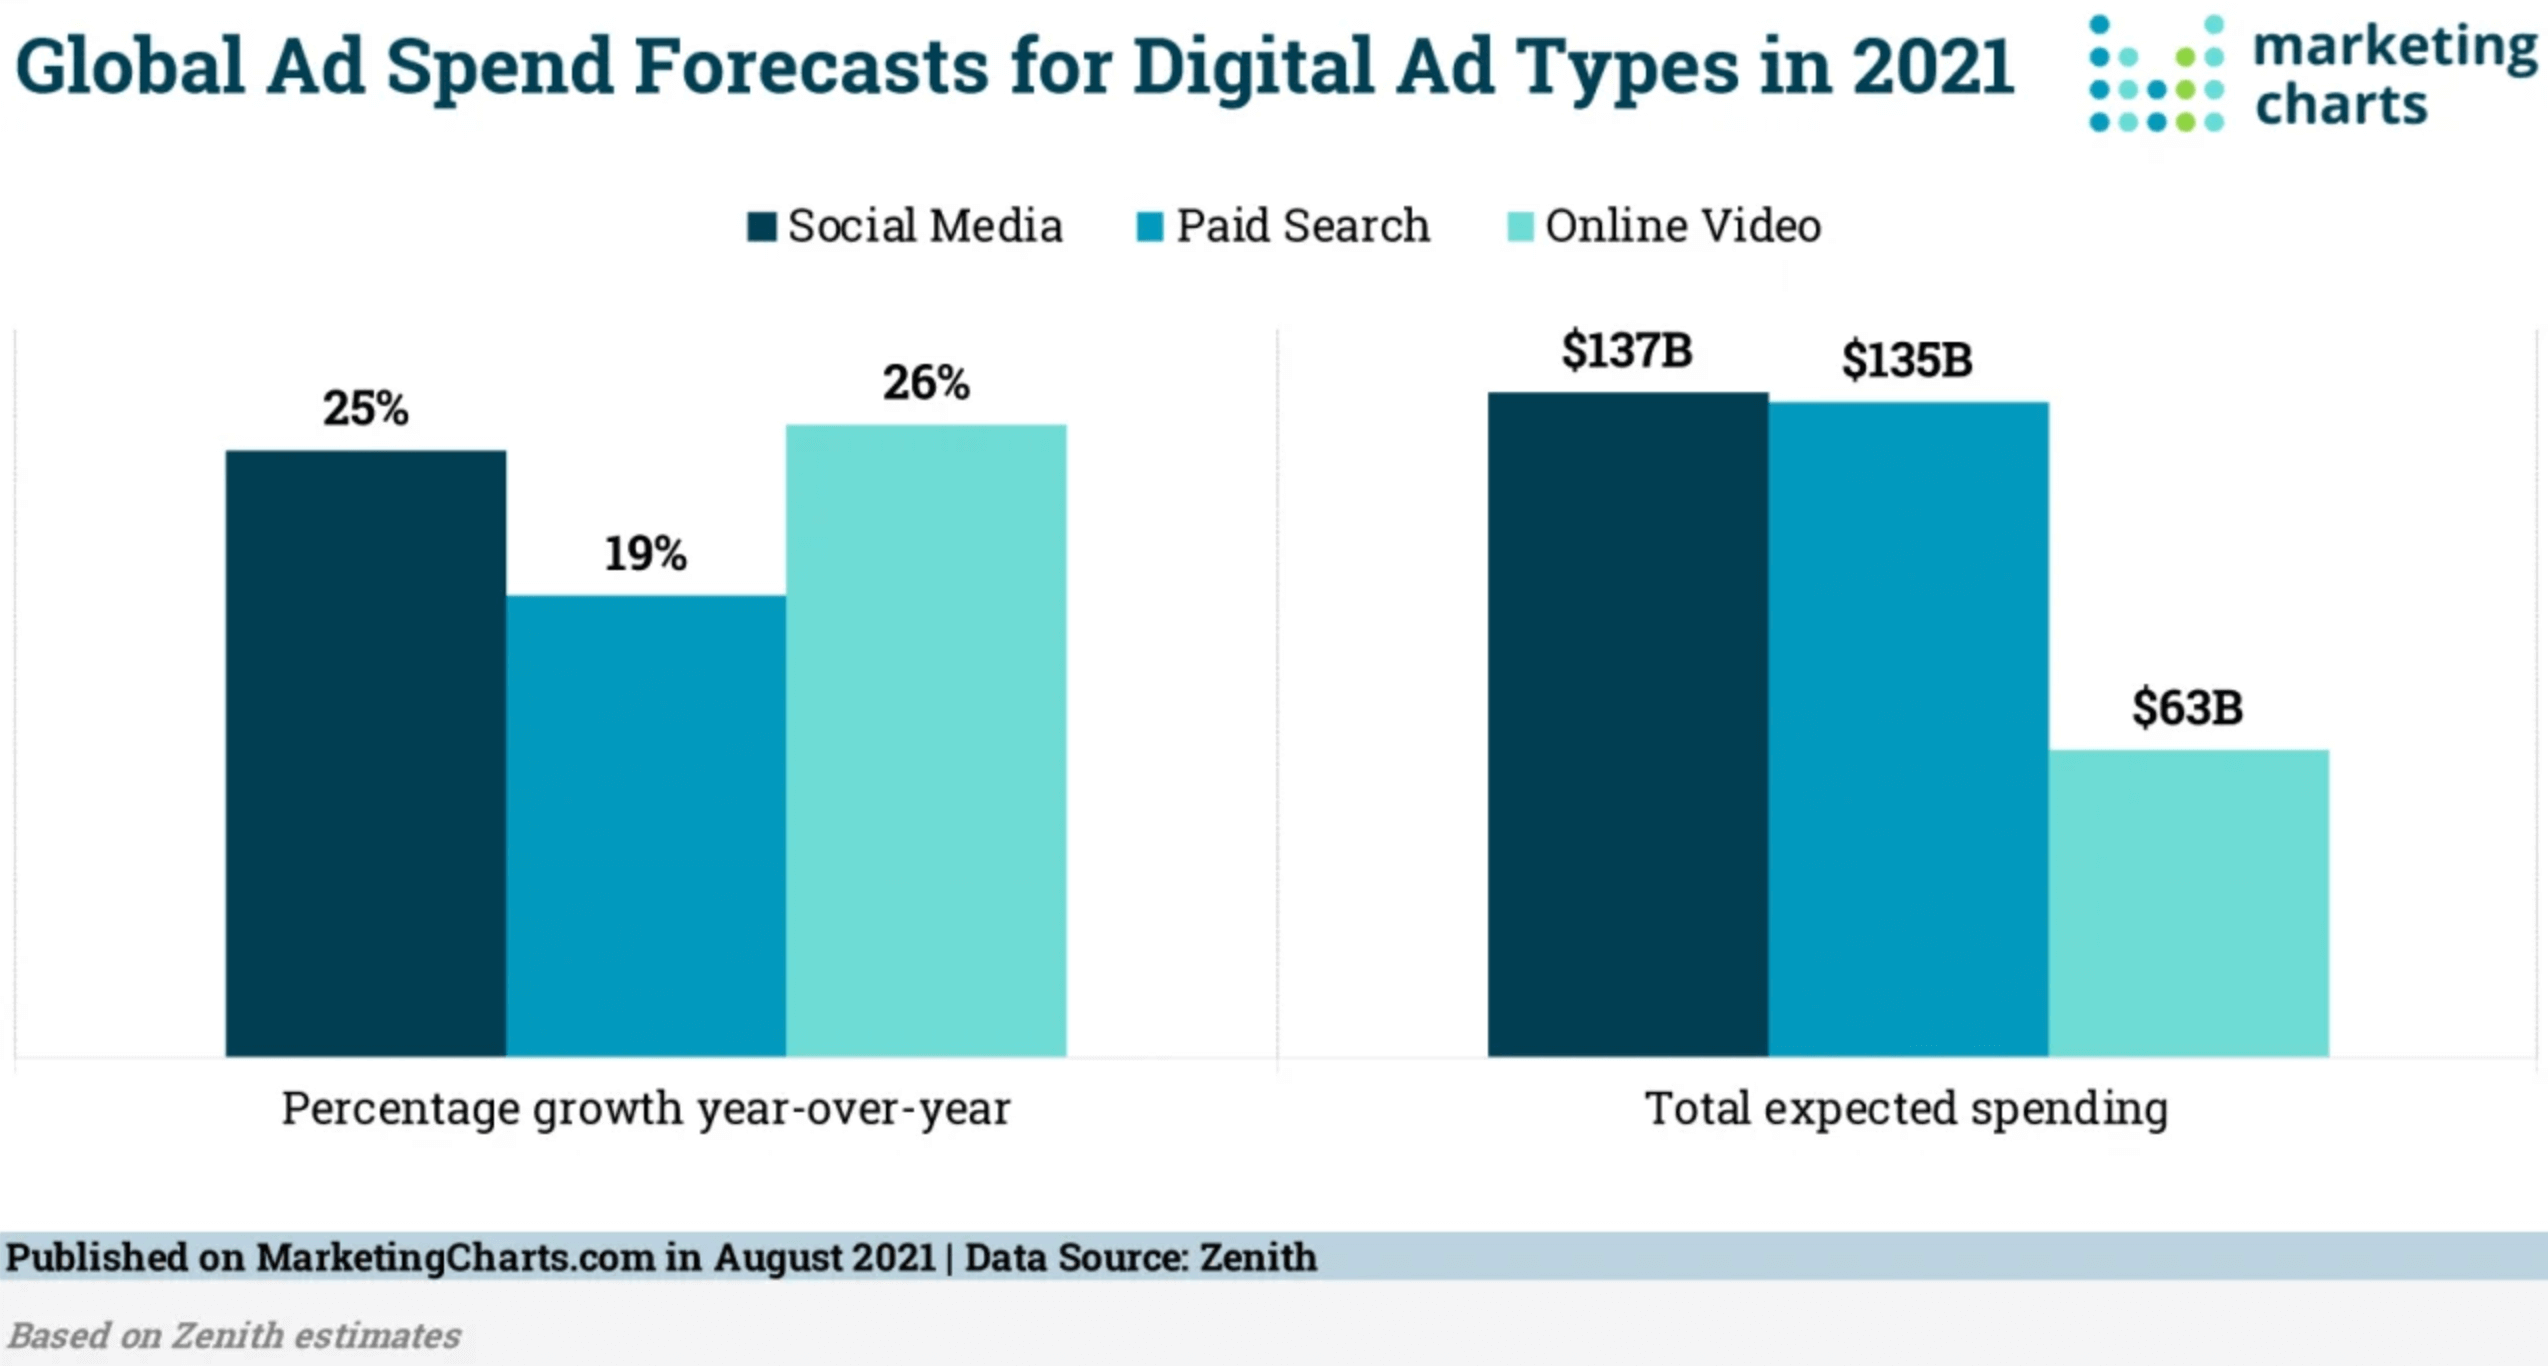
The pandemic has forced many brands to reduce their reliance on physical stores to sell goods. This has led to a huge surge in direct-to-consumer spending from brands.
“Much of this is new money to the ad market, [is] coming from small businesses that have had to pivot rapidly to eCommerce to survive lockdowns, and from budgets that brands would previously have allocated to retailers to secure physical shelf-space,” according to Zenith.
And who dominates social ad spend?
You guessed it—Facebook and its sister platform Instagram!
Facebook and Instagram Ad Benchmarks
The rest of this brief will explore new benchmark data for Facebook and Instagram ads from Emplifi.
How has total spend changed by industry over the last five quarters?
The chart below shows how different industries are spending on Facebook properties. Examine the purple bars below (which appear at the start and end of each cluster) to get a feel for how industry spending has increased over the year.
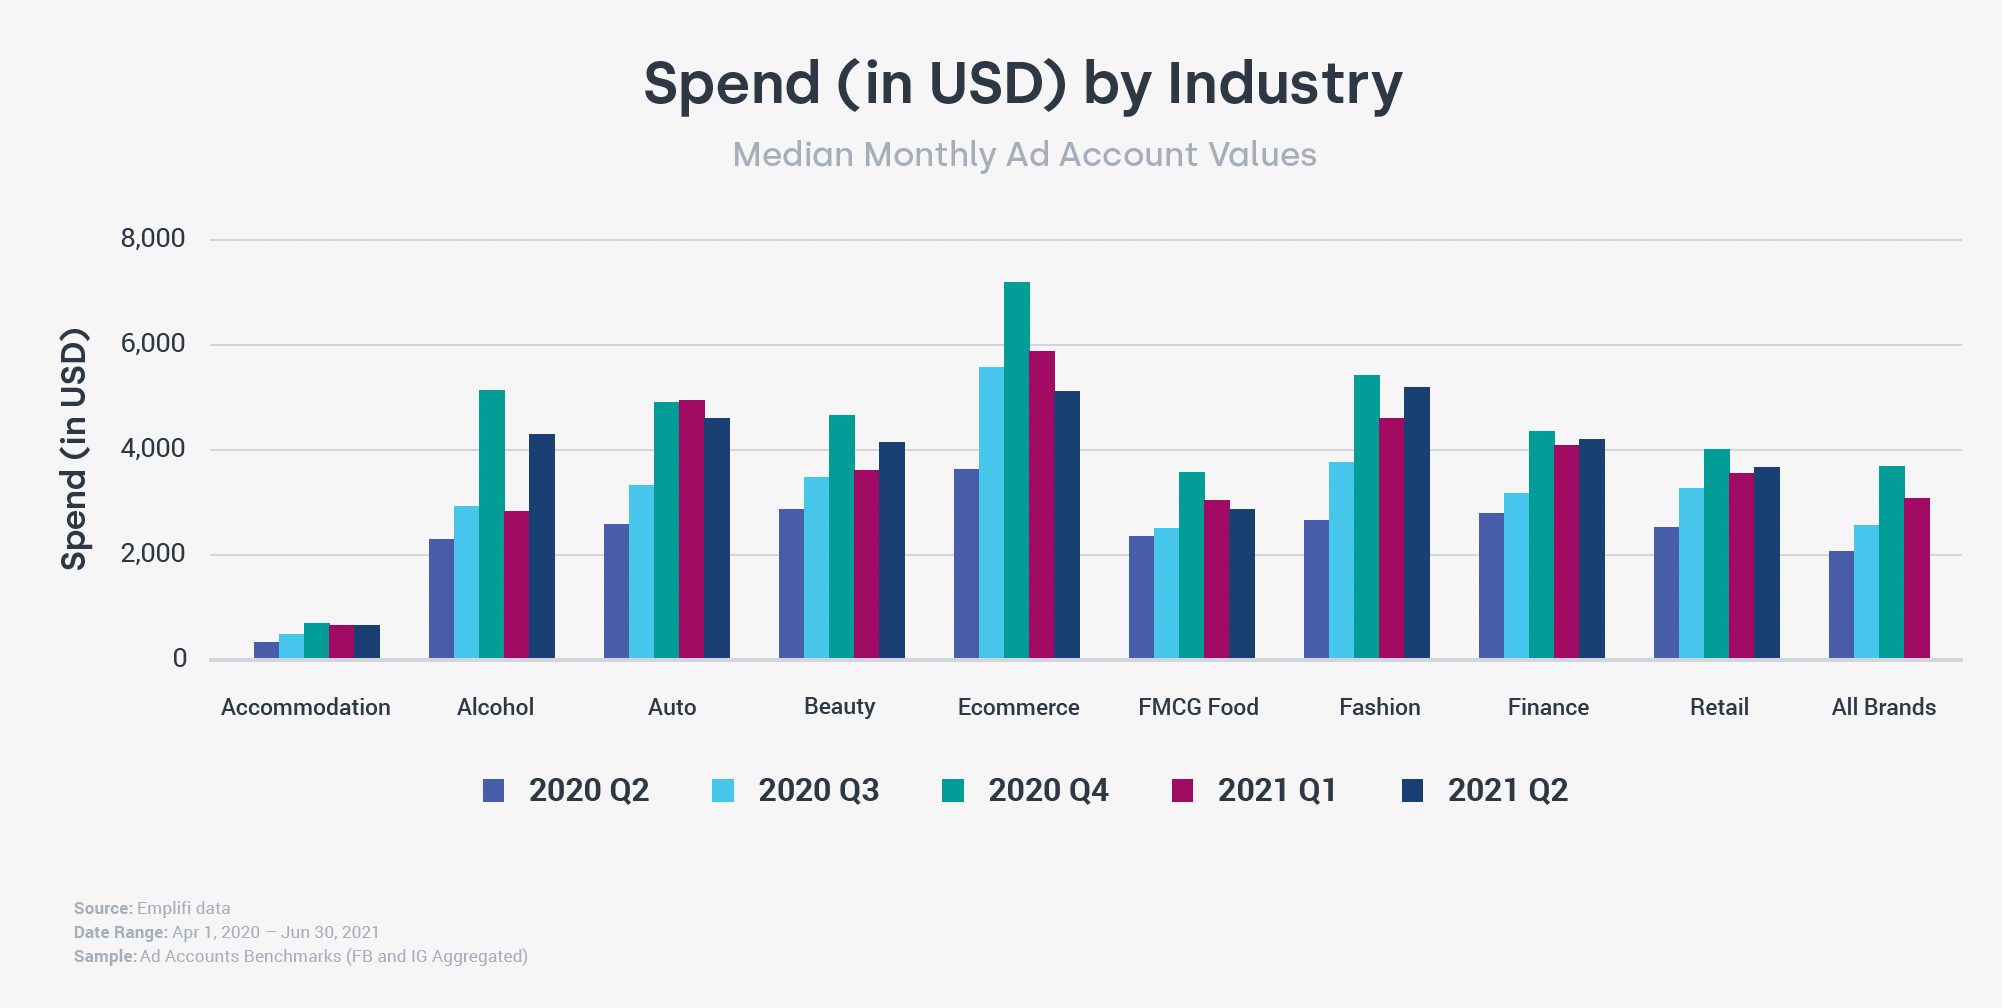
One clear standout is the steep rise and then decline in the eCommerce space. This is likely a seasonal trend that peaked during the holidays of 2020.
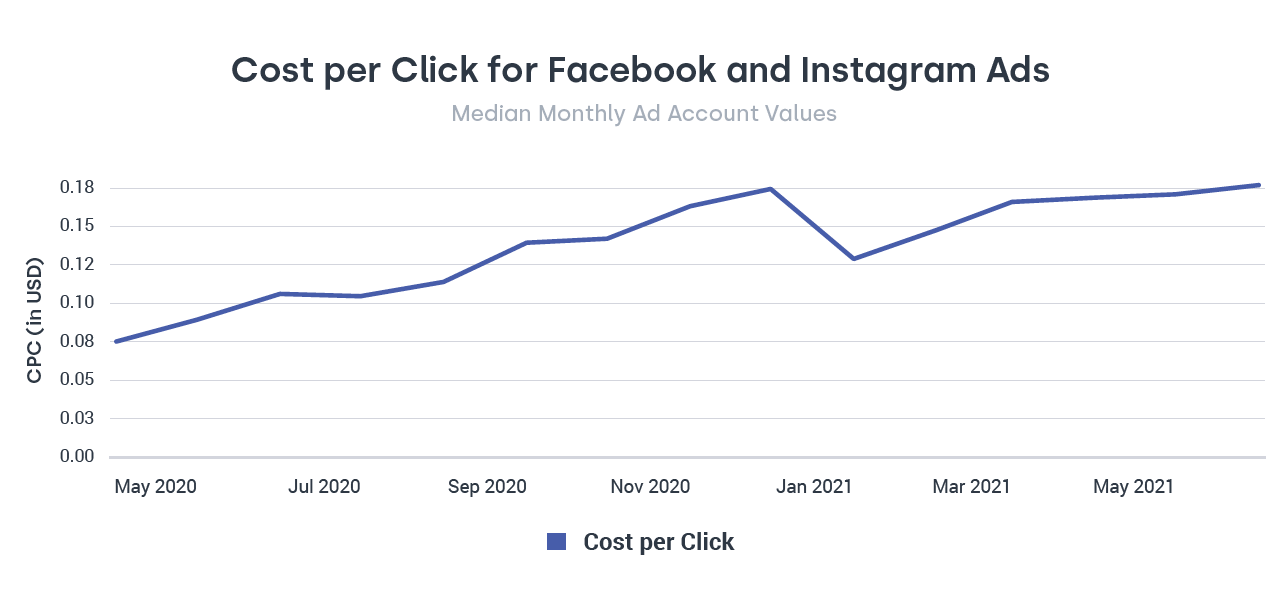
Cost-Per-Click Benchmarks
The chart below might be helpful if you want to understand how your cost-per-click (CPC) data compares to other marketers.
Want to Unlock AI Marketing Breakthroughs?
If you’re like most of us, you are trying to figure out how to use AI in your marketing. Here's the solution: The AI Business Society—from your friends at Social Media Examiner.The AI Business Society is the place to discover how to apply AI in your work. When you join, you'll boost your productivity, unlock your creativity, and make connections with other marketers on a similar journey.
I'M READY TO BECOME AN AI-POWERED MARKETERFirst, locate your region and then compare your spend data to the averages through June 2021.
3 Days of World-Class Training—Zero Travel!

Couldn't make it to Social Media Marketing World and AI Business World this year? Get all of the great content at a fraction of the price with a Virtual ticket.
That’s full access to recordings of every keynote, workshop, and session—the ones people travel thousands of miles to see. Don't wait. Get your Virtual ticket and enjoy actionable content that you can watch anytime, anywhere.
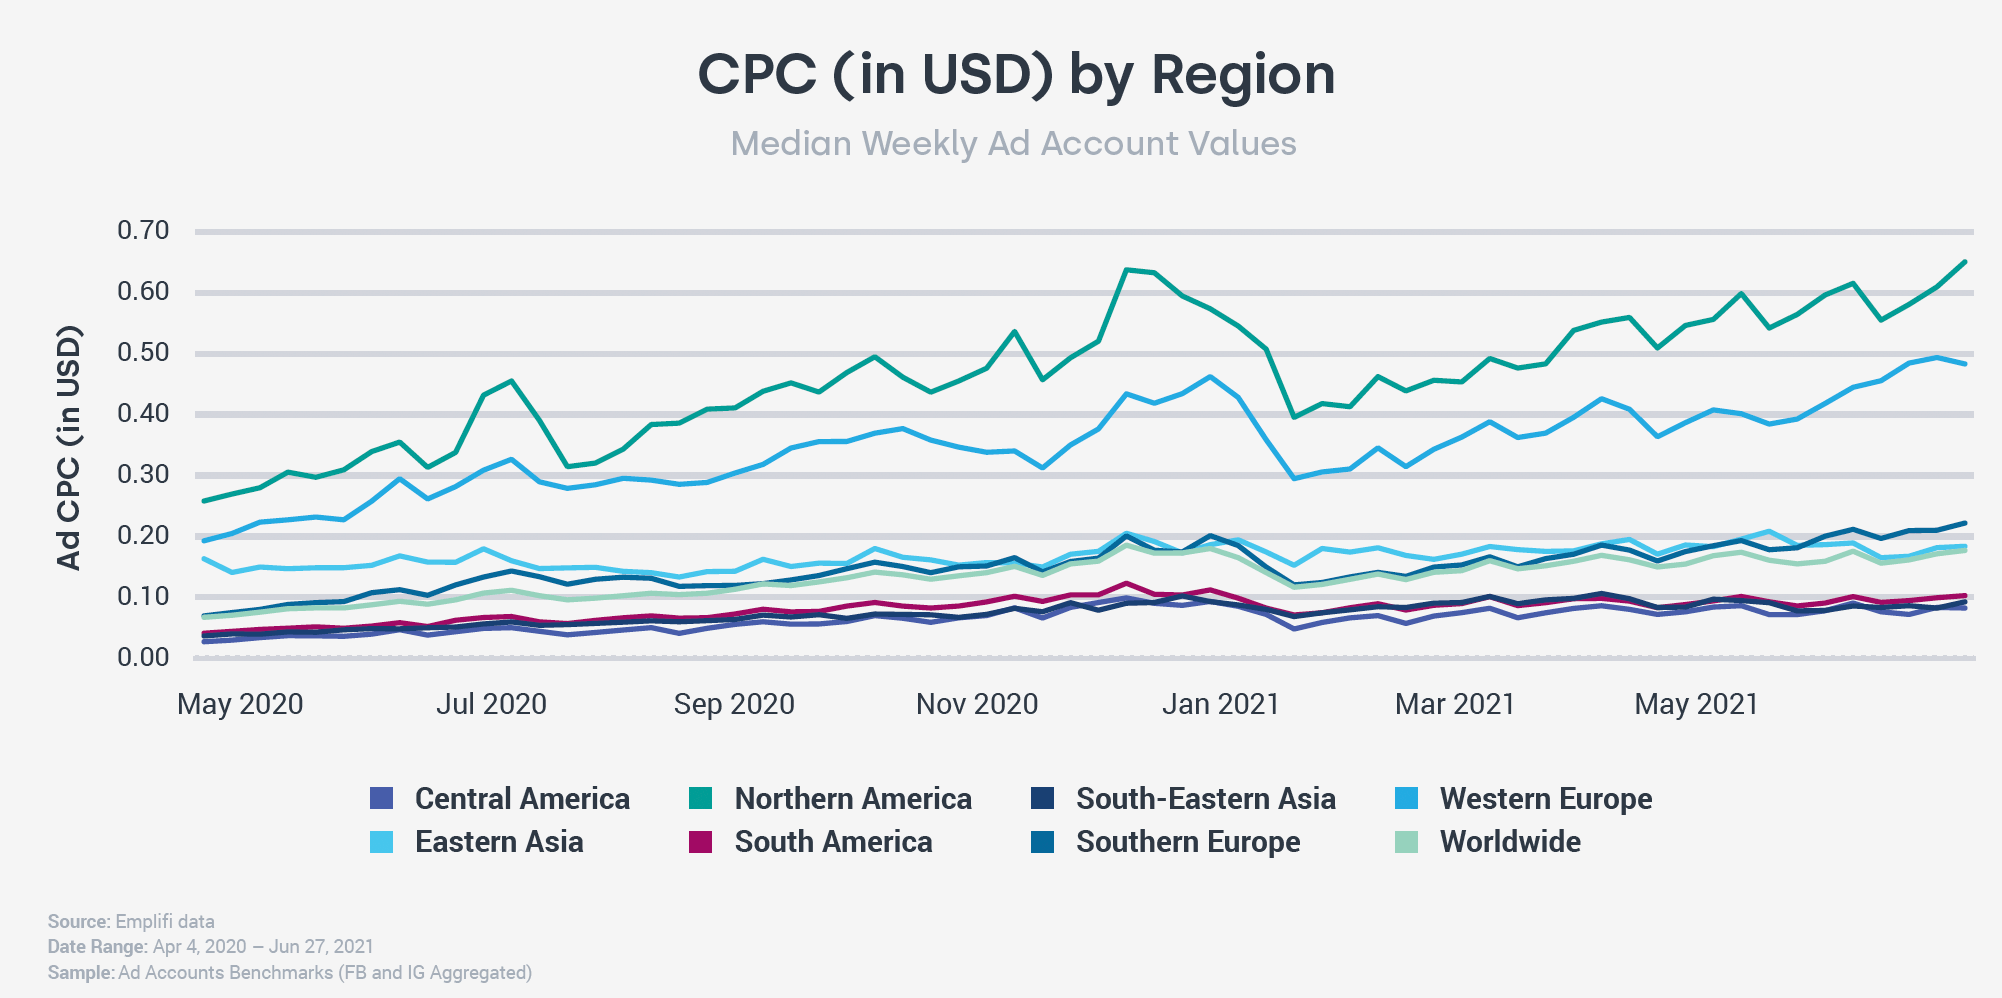
Again, you can see a rather large peak around the 2020 holiday season, reaching $0.60-$0.70 per click in North America. However, note that there was a steady rise in North American CPC to an all-time high in the first 6 months of 2021.
The chart below is an average of the regional chart shown above. It's clear that international advertisers are greatly reducing the average global CPC numbers shown below.
Click-Through Rate Benchmarks
What is the click-through rate (CTR) for your ads?
The chart below shows it should be right around 1%. If you're much higher, congrats! You're beating the average.
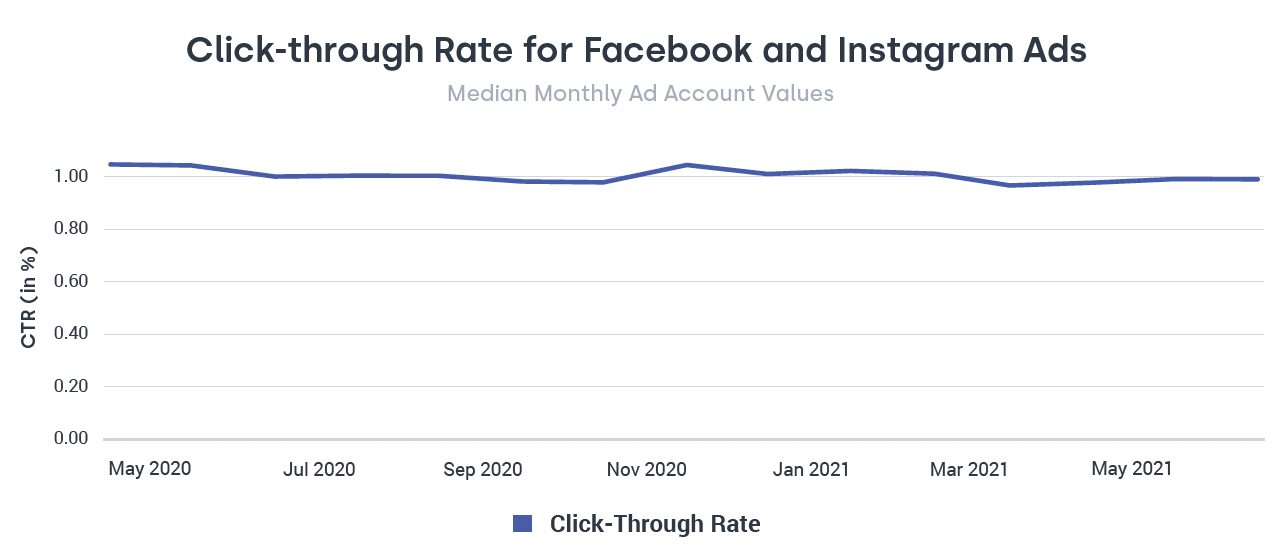
The 2020 average CTR for retail Facebook ads was 1.32% and 0.58% for Instagram, according to data from Sidecar.
This chart shows how placement impacts CTR.
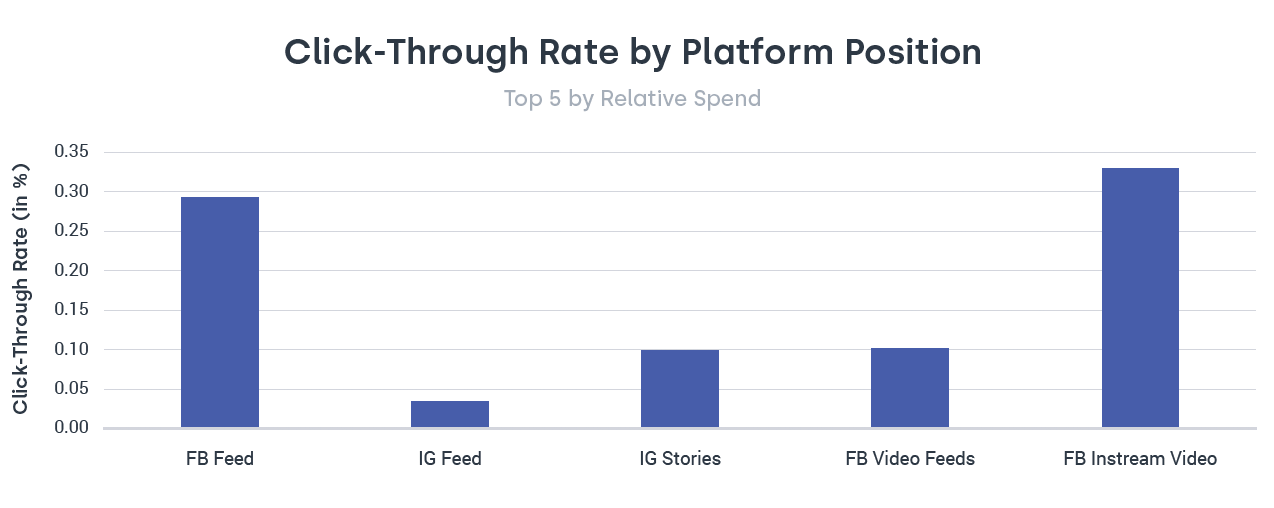
Interestingly, Facebook's in-stream video ads have the highest CTR at 0.33%, followed by Facebook feed ads at 0.29%. Instagram ads radically underperform in their CTR.
Nearly 55% of all ad spend is allocated to the Facebook feed. The chart below provides the full breakdown.
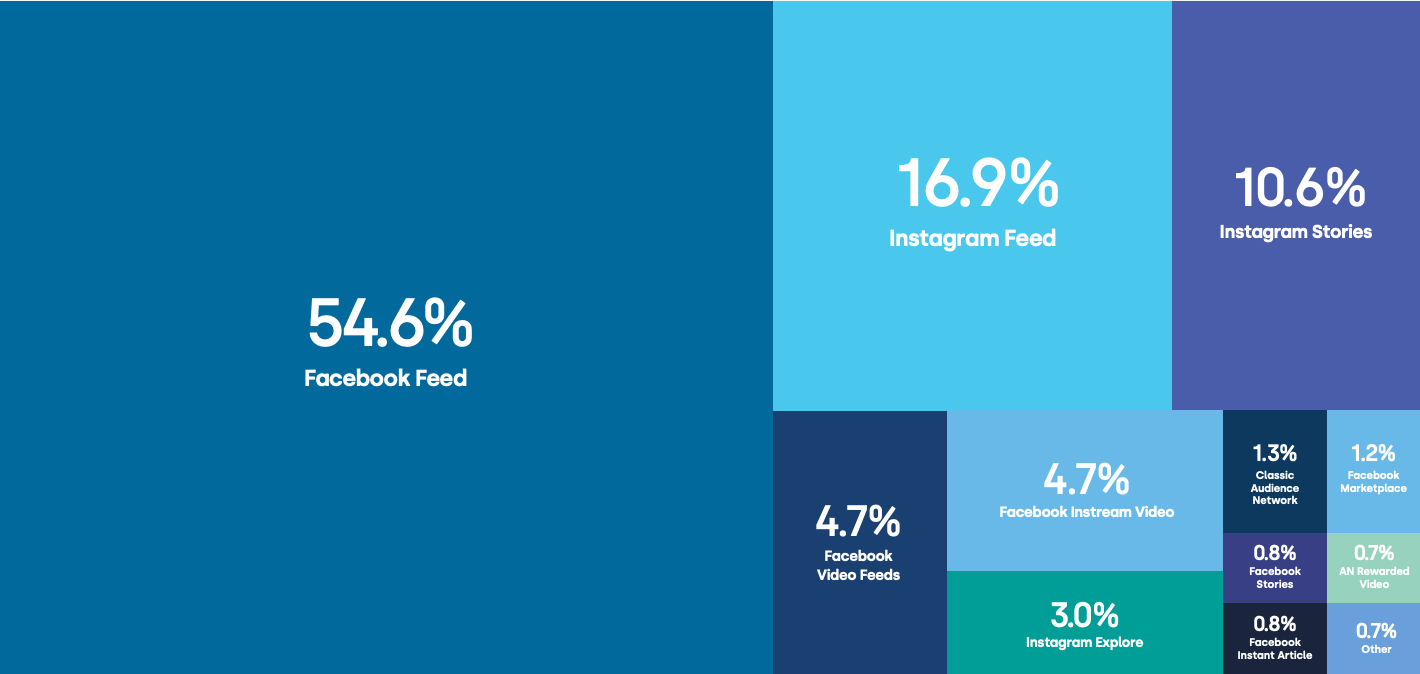
Consider using this data to help you understand your ad performance against the averages and how you're allocating your ad placements.
Get More Advice on Facebook Ads
- Upgrade your Facebook marketing strategy for 2022.
- Create Facebook in-stream ads people will watch.
- Track 10 Facebook ad metrics.
Stay Up-to-Date: Get New Marketing Articles Delivered to You!
Don't miss out on upcoming social media marketing insights and strategies! Sign up to receive notifications when we publish new articles on Social Media Examiner. Our expertly crafted content will help you stay ahead of the curve and drive results for your business. Click the link below to sign up now and receive our annual report!

Curious About How to Use AI?
Our newest show, AI Explored, might be just what you're looking for. It's for marketers, creators, and entrepreneurs who want to understand how to use AI in their business.
It's hosted by Michael Stelzner and explores this exciting new frontier in easy-to-understand terms.
Pull up your favorite podcast app and search for AI Explored. Or click the button below for more information.
