Do you need a better way to report on your Instagram marketing results? Are you looking for ways to measure your Instagram posts and stories?
In this article, you'll learn how to combine data from Instagram Insights and other third-party tools to get a complete picture of your Instagram marketing activities.
#1: Compare Your Instagram Engagement Rate to Your Competitors'
Using Instagram Insights, you can see post engagement broken down by these metrics:
- Likes
- Comments
- Shares
- Saves
Note that you need to have an Instagram business account to access Instagram Insights.
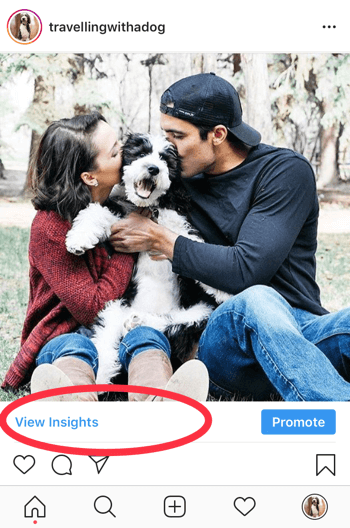
To begin exploring the analytics for a specific post, open the post and tap on View Insights under the post.
For a great piece of content, you'll see a variety of likes, comments, shares, and saves, making it easy to identify which posts resonated best with your audience (and possibly what to create more of in the future).
After analyzing the engagement for an individual post, the next step is to calculate your engagement rate. The total engagement received on a post is expressed as a percentage of your followers. According to a study from Iconosquare, the average engagement rate on Instagram is 4.7%; however, it differs by industry.
Before you start tracking your engagement rate, do some research to find out the average engagement rate of your competitors. Knowing your competitors' engagement rate will help you gauge your engagement to see how you're performing.
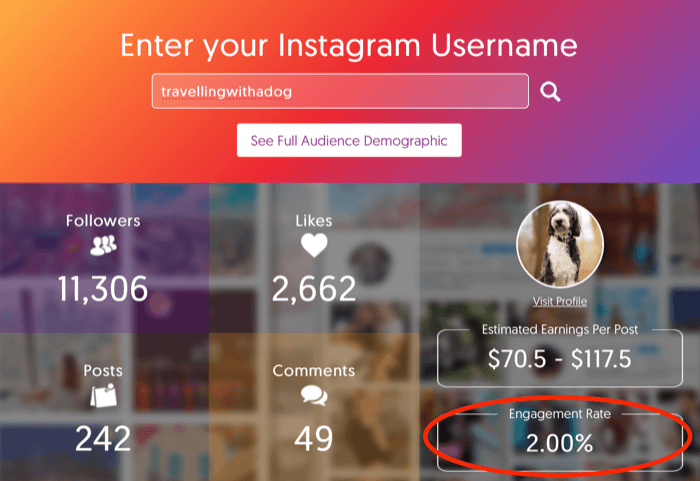
Influencer Marketing Hub has a free Influencer Earnings Calculator that will quickly tell you the engagement rate of an account, based upon the last 12 posts. You can use this calculator to check your account against your competition to see how you compare.
#2: See Which Instagram Hashtags Improve Impressions
Using the right hashtags on Instagram will help you reach a wider audience and put your content in front of the right people. However, knowing which hashtags to use can feel like a bit of a mystery if you aren't tracking performance.
Plus, if you're using the maximum of 30 hashtags per post, you might wonder how you can tell which ones are maximizing your impressions and which aren't working for you.
Instagram Insights is a great place to start measuring your hashtags for your business account. Start by viewing the insights for an individual post. Under the Discovery section, you'll see impressions broken down into several categories, including From Hashtags.
3 Days of World-Class Training—Zero Travel!

Couldn't make it to Social Media Marketing World and AI Business World this year? Get all of the great content at a fraction of the price with a Virtual ticket.
That’s full access to recordings of every keynote, workshop, and session—the ones people travel thousands of miles to see. Don't wait. Get your Virtual ticket and enjoy actionable content that you can watch anytime, anywhere.
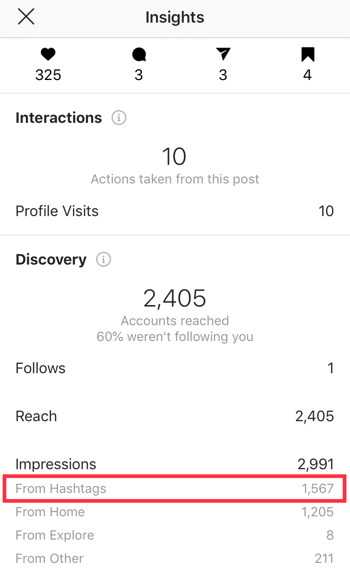
This metric tells you how many impressions your post received from the hashtags you used and can help you understand whether those hashtags are performing well.
Ideally, you want to use a variety of hashtags on each post to test them against one another. Doing so will help you spot patterns within your insights. Specific sets of hashtags may perform better than others, and if that's the case, you'll know what hashtags you should be using more often.
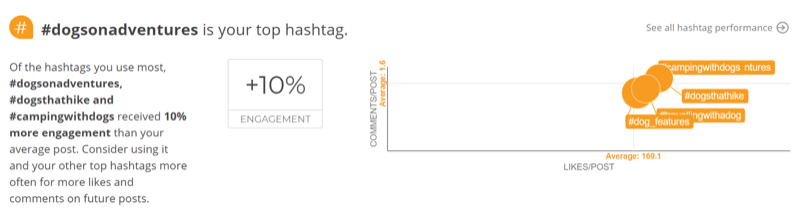
Still, it can be challenging to pinpoint precisely which hashtags are bringing you the most engagement. That's where the free Instagram Checkup Tool by Union Metrics comes in handy.
This tool reveals your top hashtags so you know which ones to use more often to reach your ideal audience. Also, don't limit yourself to using hashtags solely in your posts. You can also use up to 10 hashtags in your Instagram stories.
#3: Discover Which Instagram Posts Perform Well and Drive Traffic
Creating content for social media doesn't need to be exhausting. Tracking your popular content will help you develop future content because you'll know exactly what your audience wants to see.
There are a couple of different ways to reveal your highest-performing content on Instagram.
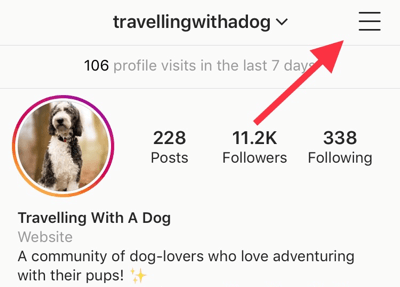
The first way is to use Instagram Insights to filter popular content for your account. To do this, tap on the three lines in the top-right corner of your business profile and then tap Insights.
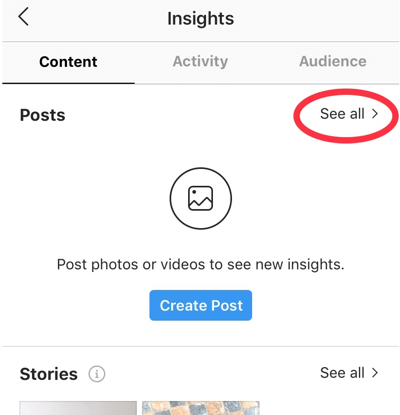
On the Content tab, scroll down to the Posts section and tap See All.
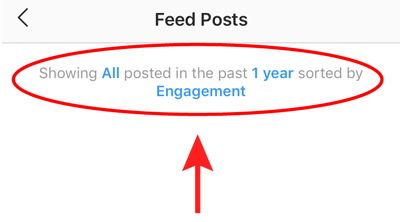
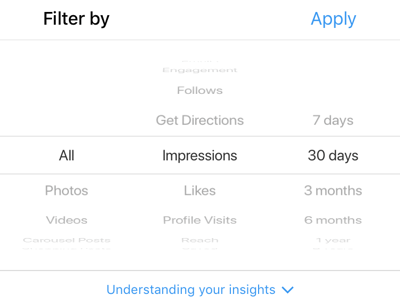
By default, Instagram brings up your posts within the last year, sorted by engagement. You can change the time frame, metrics, and type of media by tapping the top of the screen.
To determine what content was popular with your audience, make a note of these metrics:
- Comments
- Follows
- Engagement
- Likes
- Saved
- Shares
Once you know which posts were popular with your audience, go back to see what made those posts loveable so you can replicate that success for future posts.
Instagram wants to share quality content in the home feed. By analyzing what has performed well in the past, you're providing your business direction to develop content that will have a higher chance of performing well in the future.
Next, if you have a website, make sure you've set up Google Analytics and given it enough time to populate with data. While Google Analytics can't measure analytics within your Instagram account, you're still able to get some incredibly useful data from it.
After you log into your Google Analytics account, you're going to pull up a report that will show you exactly what pages of your website your Instagram followers are clicking to.
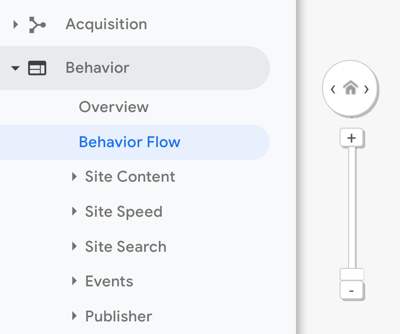
To do this, click on Behavior in the left-hand column and select Behavior Flow.
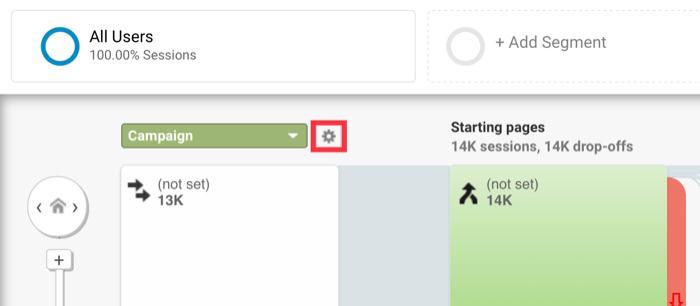
Then click on the gear icon on the right.
Want to Unlock AI Marketing Breakthroughs?
If you’re like most of us, you are trying to figure out how to use AI in your marketing. Here's the solution: The AI Business Society—from your friends at Social Media Examiner.The AI Business Society is the place to discover how to apply AI in your work. When you join, you'll boost your productivity, unlock your creativity, and make connections with other marketers on a similar journey.
I'M READY TO BECOME AN AI-POWERED MARKETERNow you're going to create a custom report that will show you exactly how your traffic from Instagram is behaving on your website.
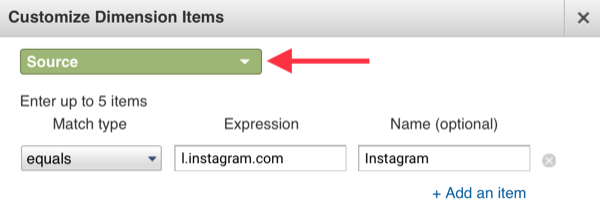
In the box that pops up, change Campaign to Source. Then click +Add an Item.
Make sure Match Type is set to Equals and enter “l.instagram.com” in the Expression field.
Then click Apply to bring up a report that shows the behavior flow of your traffic from Instagram.
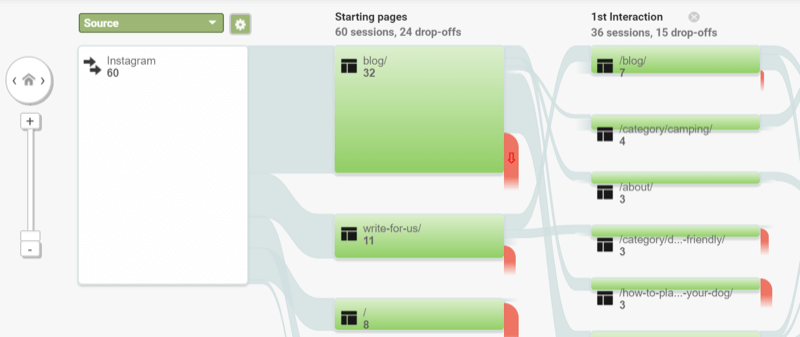
This report will give you valuable insight into what your visitors from Instagram are interested in on your website. When you know what pages they frequently visit on your website, you'll be able to tailor your content creation toward those topics.
For example, if you notice that one particular product gets more traffic from Instagram users, consider showcasing that product in your feed or stories more often.
#4: Assess Instagram Stories Performance
Instagram Stories is used by 500 million people daily. If you haven't started tracking the metrics for your Instagram stories, now's the time to start.
Not only is Instagram Stories a popular place to hang out but the metrics available within Instagram Insights are also incredible for detailing your audience's behavior. This data can help you better understand how your audience interacts with your content.
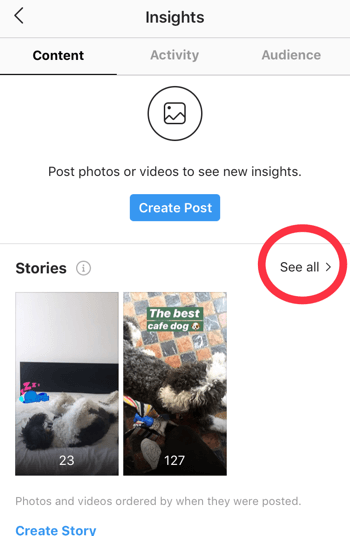
To access your Instagram story metrics, tap on the three lines in the top-right corner of your profile (as you did earlier to access the insights for your posts) and select Insights.
Then scroll down to the Stories section and tap See All.
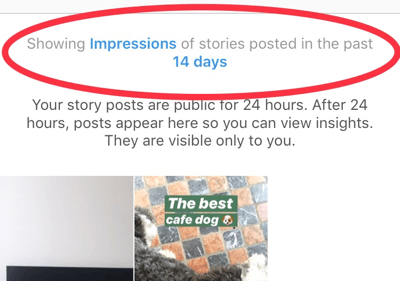
Your stories insights are only available for 14 days so this is a metric you'll want to track regularly. As you were able to view an abundance of information for your posts, you have access to similar data for your stories.
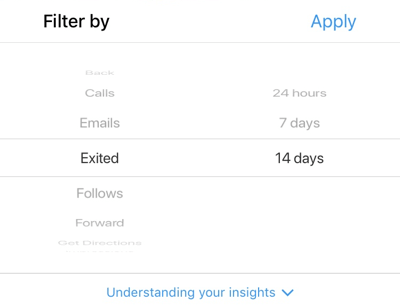
Tapping the top of the screen will bring up a variety of key metrics you can view.
Metrics such as follows, link clicks, replies, shares, and backs can indicate whether your audience enjoyed your content. To grow your account, find out which stories resulted in the most follows and shares.
Instagram also offers insights that can help you improve your stories. These metrics include:
- Exited
- Next story
- Forward
When someone exits your story, it means they're swiping out of it to head back to the Instagram home feed. Alternatively, if someone has gone to the next story, it means they're skipping the rest of your story to view the next account's story. Both of these metrics suggest your audience may have lost interest in what you posted.
The Forward metric means that the person tapped on the screen to view your next story. In this case, they didn't watch your full story but haven't completely left your story sequence.
When looking at these analytics, look for patterns. Are viewers exiting anytime you upload more than five stories segments? Are they going to the next story if you showcase your products too often? Does your audience stay on your story if you feature behind-the-scenes content?
Understanding what causes your followers to remain intrigued or move to something else will help you create more engaging stories.
#5: Track Instagram Follower Growth
It goes without saying that if you're trying to grow your account, you should track follower growth. Once you begin to tailor your content toward the preferences of your audience, you'll want to see if those efforts affect your following.
To calculate your growth, you can manually keep track of your follower count each week or use a tool like Squarelovin to get a quick snapshot of your account's growth.
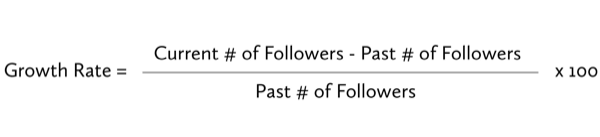
To manually track your growth, take your follower count at the end of the week and subtract the number of followers you had at the start of the week. Then divide this number by your follower count at the start of the week. Finally, multiply that by 100 to get your growth expressed as a percentage.
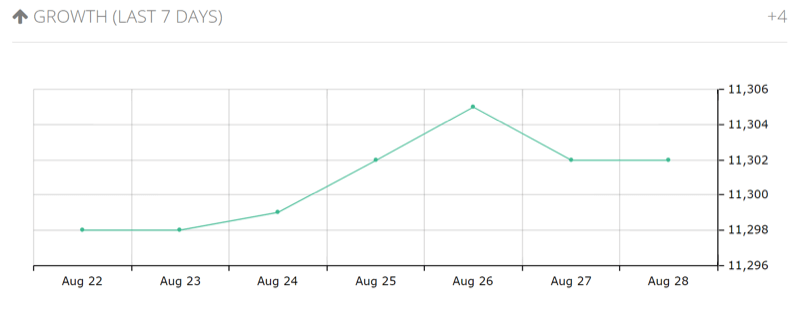
With the free plan, Squarelovin will calculate your follower count each day so you don't need to worry about tracking it manually. Once you sign up with Squarelovin, your account stats will begin to populate on a go-forward basis and you'll be able to see a visual of your account's growth.
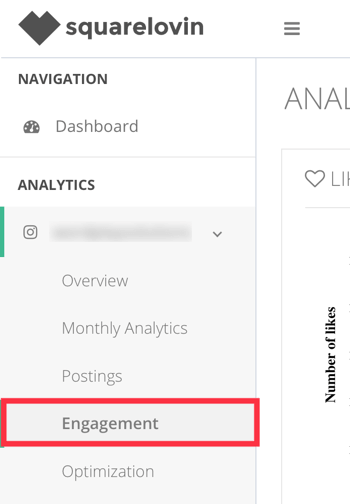
In the left navigation, select your account under Analytics and choose Engagement to see your stats.
Squarelovin will then show your follower growth for the last 7 days.
Conclusion
There are countless tactics for growing your Instagram account. Having a cohesive Instagram feed theme, improving your Instagram photos, and having killer captions are all steps toward a great Instagram marketing plan. However, once you've put these practices into place, how are you supposed to know what's working and what's not?
With an Instagram business account, you get access to great analytics right in the app, and other free tools can help you dig deeper.
Diving into your Instagram analytics will offer your business a view into what your audience likes, doesn't like, and wants to see more of from your account. Once you understand your audience's preferences, you'll be able to create shareworthy content that will appeal to your followers and help grow your account.
What do you think? How do you measure your Instagram marketing results? What tools do you use to track key metrics? Share your thoughts in the comments below.
More articles on Instagram marketing:
- Discover advanced techniques to measure your Instagram Stories ROI.
- Learn how to combine an Instagram growth strategy with an ad sequence that can turn followers into customers.
- Find out how you can generate more organic engagement on Instagram.

Curious About How to Use AI?
Our newest show, AI Explored, might be just what you're looking for. It's for marketers, creators, and entrepreneurs who want to understand how to use AI in their business.
It's hosted by Michael Stelzner and explores this exciting new frontier in easy-to-understand terms.
Pull up your favorite podcast app and search for AI Explored. Or click the button below for more information.
