 Want more engagement on Instagram?
Have you considered posting infographics?
Introducing infographics into your Instagram marketing campaigns will attract more viewers and set you apart from other companies.
In this article you'll find five ways to create infographics for Instagram.
#1: Build a Video Infographic From a Series of Charts
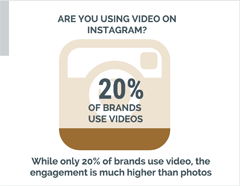
Videos overwhelmingly beat photos on Instagram.
The easiest way to create a video from an existing infographic is to cut up the original infographic into multiple pieces. Then use a video editing tool to convert all of the separate images into a short video.
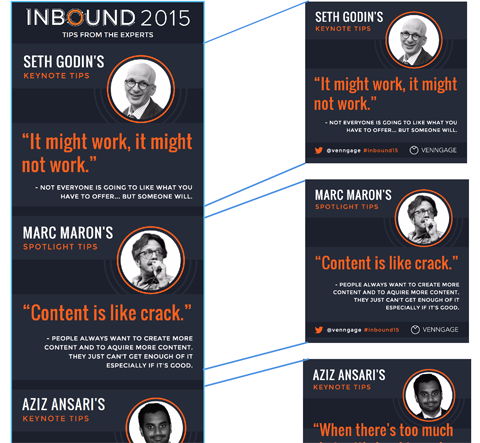
First, use a graphics program to split a long infographic into separate images. You may want to save them with their numerical order in the file names.
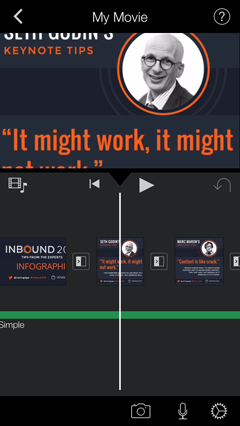
Next, upload the images to your phone. Open up a video editing app such as iMovie for iPhone (or find an Android equivalent).
Create a new project, and then add all of the images by tapping the File icon. Each image will be laid out on the timeline. Rearrange the images if you wish.
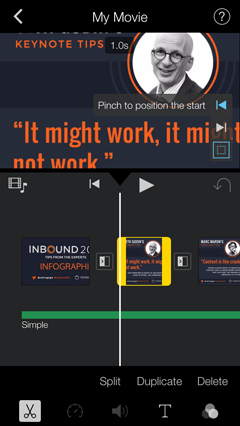
Instagram videos are short, so you need to make sure the entire video is less than 10 seconds long. If you use five or six images, make each image clip about one second long and each transition about half a second long.
Tap on the image to change the clip duration. When selected, it will have a yellow outline. Then pinch the image to change the length of the clip.
Tap on the transition clip to change the duration and style. I usually stick to the simple Slide transition, as it's the least distracting.
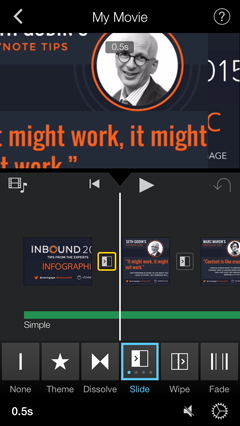
To preview the movie, click on the Play button. Add music and change settings with the Settings button (the gear icon). Once you're satisfied, export the video to your phone by tapping the Share button.
Which AI Moves Actually Matter?
That's what every marketer is wrestling with now. New AI strategies, new tools, new takes every week — but no clarity. Most marketers and business owners are trying to figure out AI alone.The AI Business Society is your trusted guide. Get expert-led training you can put to work immediately. Plus a community of marketers sharing what's actually working.
I'M READY FOR REAL AI RESULTS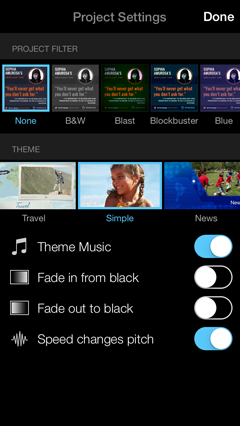
Finally, open up Instagram and create a new video post. If the video doesn't fit the square preview, switch to the full size option by tapping Resize. It's the double bracket icon in the lower-left corner of the Preview screen.
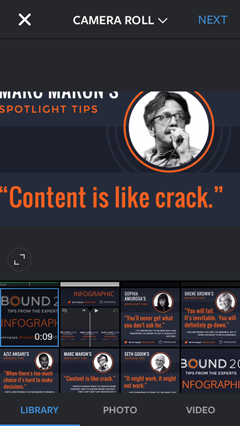
Save your video to the camera roll, and share on other social networks.
#2: Adapt or Create a Simple Chart
One of the challenges of using infographics on Instagram is that most of them are created in portrait (long-form) format. While Instagram now permits landscape and portrait images, the viewing dimension of every post should be optimized for mobile viewing.
Since content needs to be legible on a typical mobile screen, you can't just resize a long-form infographic to fit the Instagram image parameters.
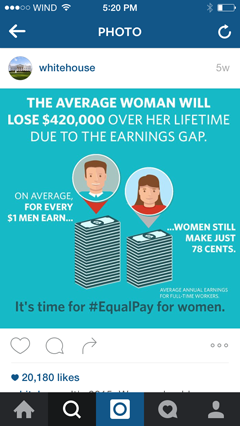
Instead, crop one chart (with a single factoid) from a complete infographic to use exclusively for a post. Otherwise, create a mini-infographic that gets one point across.
For example, the White House created this #EqualPay infographic for their Instagram. The same information was in a variety of other places, including a Twitter video post.
The easiest way to create a mini-chart is to repurpose something that already exists. Buffer took a piece of a long How to Make Sales from Instagram infographic and created the post below.
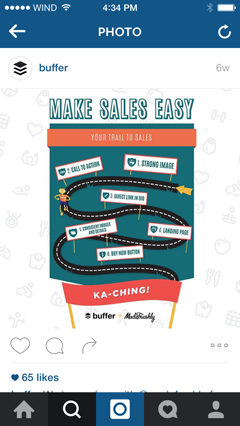
Most successful posts consist of a chart or data point that displays something useful, funny or interesting. Look at your current content or brainstorm ideas to create small charts for your company's Instagram.
3 Days of World-Class Training—Zero Travel!

Couldn't make it to Social Media Marketing World and AI Business World this year? Get all of the great content at a fraction of the price with a Virtual ticket.
That’s full access to recordings of every keynote, workshop, and session—the ones people travel thousands of miles to see. Don't wait. Get your Virtual ticket and enjoy actionable content that you can watch anytime, anywhere.
#3: Convert Data Into a Quote
Sometimes the best way to convey a number in an infographic, especially a very large or important number, is to use plain text. This is one of those exceptions to the “show, don’t tell” rule of data visualization.
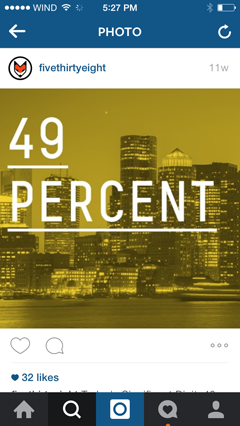
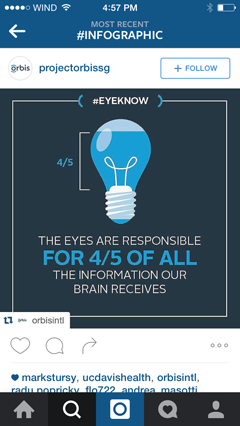
If you want, and if it fits with your brand, add a hint of mystery to really grab your audience's attention. FiveThirtyEight puts a number over an image. Users need to click the post to see what the number represents.
Convert your data into a quotable text snippet by describing it in simple text. Then add it as a text overlay to one of your images. Choose an image that's representative of your brand or the data itself.
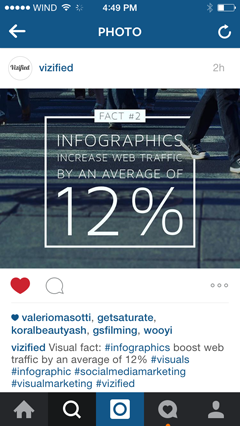
There's a variety of Instagram and image editing apps to use to overlay text on your images. Complement the image with icons and add context in the comment section.
#4: Transform Information Into a Pictogram
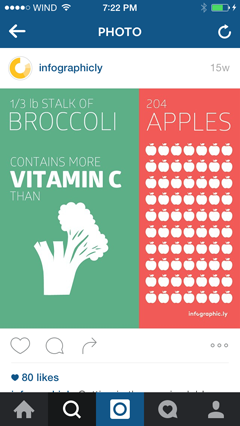
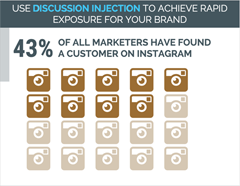
A pictogram lets you represent data using icons. It's one of the most effective visual designs for conveying important percentages or ratios.
Design studio Infographic.ly has some great examples on their Instagram channel, like the one below.
The easiest way to create a pictogram is to use a tool for making infographics. This process takes only a few minutes.
First, choose the icon you want to use (most tools will have a variety of icons to choose from).
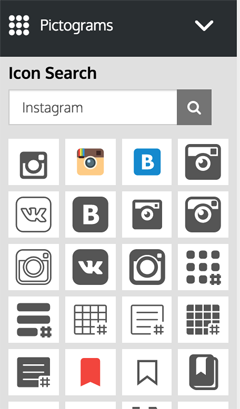
Specify the number of icons you want to depict in rows and columns. Note any icons that need to be highlighted with different colors. Pick a darker color for the number of icons you want to highlight and a lighter one for the others.
Add your title and export the image. Then post it to Instagram.
Pictograms are perfect for Instagram, because they can be optimized for mobile viewing.
#5: Construct Icon Charts
Icon charts are icons filled with two different colors to depict a certain percentage value. Instead of the typical column or bar chart, an icon chart uses an icon to illustrate both the value and the actual information, like Project Orbis Singapore did in this post.
Create an icon chart using an infographic tool, just as you would for a pictogram.
Choose an icon. Then select the percentage of the icon you want as the fill value. For example, to show 20%, set the fill value to 20.
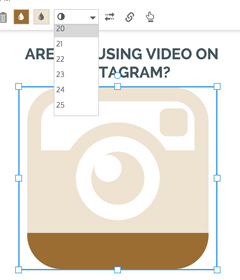
Next, select the two colors you want for the icon. Again, pick a dark color for the percentage you want to show, and a lighter color for the remaining fill.
Then add a title and description.
Another option is to create a similar icon chart using a conventional design tool such as Photoshop or Illustrator. Simply fill the path of your object with two different colors. Remember, you'll have to calculate the percentage and height manually.
Combining iconography with data visualization delivers an engaging impact. See what message your company can covey with this type of infographic.
Final Thoughts
Learning how to create infographics for your Instagram marketing may take some time, but it's definitely worth it.
Many marketers have had plenty of success with infographics on web-based channels, and its use on mobile-based channels has only begun to take off. There's definitely a lot of opportunity to embrace.
What do you think? Do you create infographics for your business? Do you optimize them for Instagram? Please share your thoughts and experience in the comments.

Curious About How to Use AI?
Our newest show, AI Explored, might be just what you're looking for. It's for marketers, creators, and entrepreneurs who want to understand how to use AI in their business.
It's hosted by Michael Stelzner and explores this exciting new frontier in easy-to-understand terms.
Pull up your favorite podcast app and search for AI Explored. Or click the button below for more information.
