 Wondering how to improve the impact of your social media images?
Looking for tools to optimize your visual content?
In this article you'll discover three little-known tools to analyze the effectiveness of your visuals before you use them in your social media marketing.
Listen to this article:
Where to subscribe: Apple Podcasts | Spotify | YouTube Music | YouTube | Amazon Music | RSS
#1: Optimize for Conversion
Bannersnack is an online app that makes it easy to create banner ads. You can adapt its behavior-based analytics feature to optimize the images you use on your social channels.
First, you'll want to create a banner image using the tool's handy online editor. Then grab the embed code and add the image to your blog. After some time has passed, look at the heat map in Bannersnack to see where people clicked when engaging with that image.
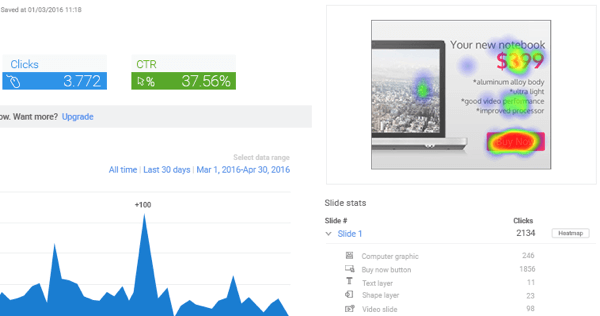
Tweak your image until the heat map registers a high amount of activity. When you're happy with the engagement your image is receiving, download it and use it on all of your social media channels.
#2: Optimize for Visual Impression
VAS (Visual Attention Software) uses its science-based algorithm to simulate which parts of the image will likely draw people's attention during the first 3-5 seconds of viewing. It also will predict the path that viewers' eyes are likely to travel when looking at the image.
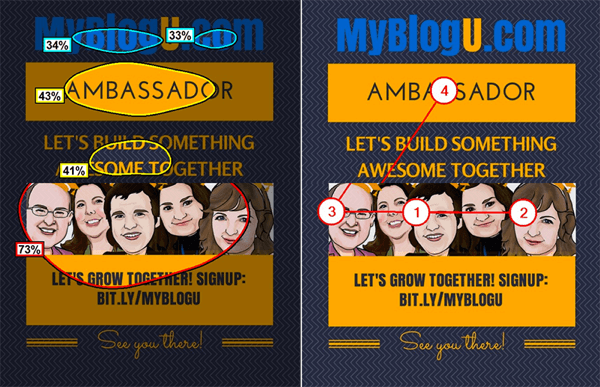
With the insights from VAS, you can enhance visual properties (such as edge and color contrast, brightness contrast, and faces) to draw attention to important areas of your image. Again, when you're happy with the predicted results, you can use your optimized image in your social media marketing.
Tip: It's a good idea to use VAS in tandem with Bannersnack until you identify industry-specific patterns to apply to your own visuals.
#3: Optimize for Accessibility
The Color Contrast Analyzer extension for Google Chrome not only will analyze color contrast on your web pages, but will also assess text within images and report on how well your text overlay can be seen. This is especially important for people with poor eyesight.
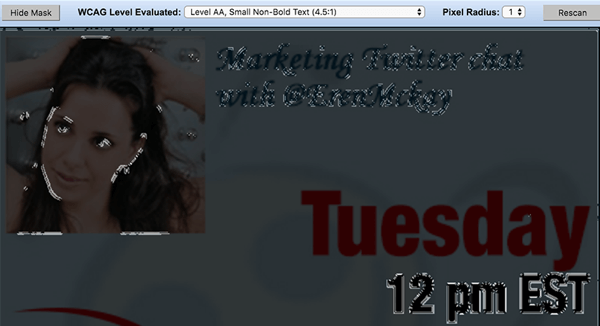
To use this tool to optimize your social media images, load your visuals to your blog so you can view them in a Chrome tab.
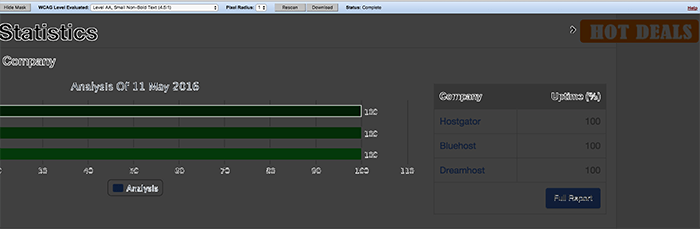
Then use the Color Contrast Analyzer extension to adjust the design until you're happy with the results and add the final versions of the images to your visual marketing library.
Where to Find Engagement Metrics for Visual Content
Now that you have some tools to help you optimize the design of your images, it's time to put them to the test. After you use visuals in your social media marketing, you'll need to measure the results to be sure you're hitting the mark.
Get World-Class Marketing Training — All Year Long!
Are you facing doubt, uncertainty, or overwhelm? The Social Media Marketing Society can help.
Each month, you’ll receive training from trusted marketing experts, covering everything from AI to organic social marketing. When you join, you’ll also get immediate access to:
- A library of 100+ marketing trainings
- A community of like-minded marketers
- Monthly online community meetups
- Relevant news and trends updates
Use the platform-specific metrics below to identify images that trigger engagement.

Discover Proven Marketing Strategies and Tips
Want to go even deeper with your marketing? Check out the Social Media Marketing Podcast! Publishing weekly since 2012, the Social Media Marketing Podcast helps you navigate the constantly changing marketing jungle, with expert interviews from marketing pros.
But don’t let the name fool you. This show is about a lot more than just social media marketing. With over 600 episodes and millions of downloads each year, this show has been a trusted source for marketers for well over a decade.
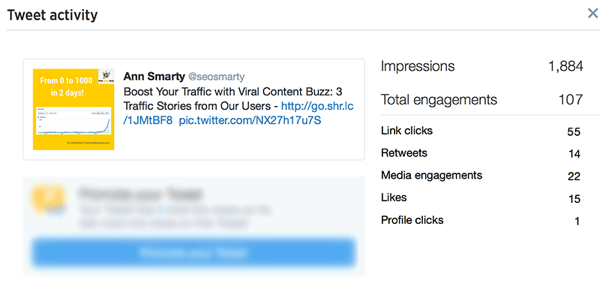
Twitter Media Engagements
On Twitter, media engagement is the metric that shows you the number of clicks to your image. It's hidden behind the Tweet Activity link, so you won't see it on the main Tweets section of your Twitter analytics dashboard.
To access it, open your Twitter Analytics and click on the Tweets tab at the top of the page. Then click on View Tweet Activity under the tweet you want to review. You'll see all of the tweet activity metrics, including media engagements.
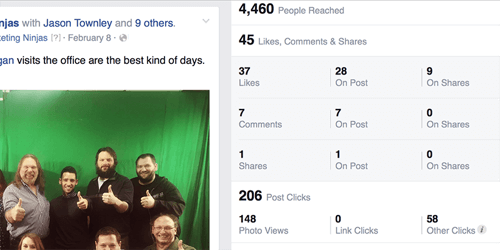
Facebook Photo Views
After you attach a visual to a Facebook post, you can click on that post in Facebook Insights to see the number of views that image attracted.
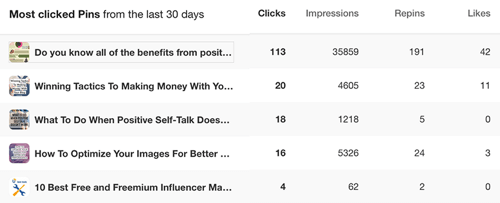
Pinterest Clicks, Impressions, Repins, and Likes
All of the data from Pinterest is image-specific because there's not much there to analyze beyond images. You can see which images have generated the most clicks, impressions, repins, and likes with Pinterest analytics. Use what you learn to identify which types of images work best for you on the platform.
Instagram Likes and Comments
Instagram analytics is on the rise with many tools being launched. However, there's not much to analyze beyond likes and comments. There are no clicks here and I don't think Instagram reports on impressions.
A tool like Iconosquare will help you easily find your most “liked” images on Instagram.
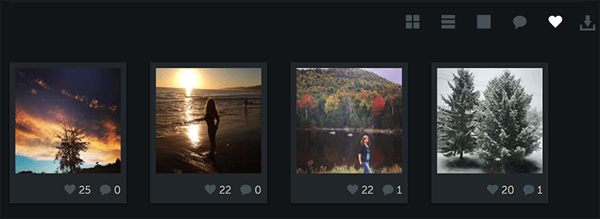
Iconosquare will also report on how much engagement came from non-followers. I find this metric useful because it helps me see how well my images spread beyond my immediate circle of contacts. For now, Iconosquare only shows the average, so no data is available on a per-post basis.
Conclusion
There are many opportunities to build social media engagement with visual content. You can convert customer testimonials into quote images, turn charts and graphics from articles into shareable images, or design a series of mascot images to promote your brand or business. You can use the images that have proven to work well in social media and display ads, on-site (to trigger action) and even offline (when marketing at events).
Whatever path you choose for your visual marketing efforts, design your images to have a uniform look, choose a standard length and language scheme for captions, and develop a format for calls to action. Use the tools and tips above to be sure your social media images are optimized for the best performance possible.
What do you think? What tools do you use to analyze the effectiveness of your social images? Do you have any tips for engaging more of your audience with visuals? Please share your thoughts in the comments below.
Attention Agency Owners, Brand Marketers, and Consultants

Introducing the Marketing Agency Show–our newest podcast designed to explore the struggles of agency marketers.
Join show host and agency owner, Brooke Sellas, as she interviews agency marketers and digs deep into their biggest challenges. Explore topics like navigating rough economic times, leveraging AI, service diversification, client acquisition, and much more.
Just pull up your favorite podcast app, search for Marketing Agency Show and start listening. Or click the button below for more information.
