 Are you curious about which type of social content gets the most shares?
Are social shares part of how you measure social marketing return on investment (ROI)?
Do you wonder which social channels' users share most frequently?
In this article you'll discover the most recent findings about what types of content get shared most, which channels seem to have the most users who share and what posting times result in the most shares.
#1: Mobile Sharing Doubled
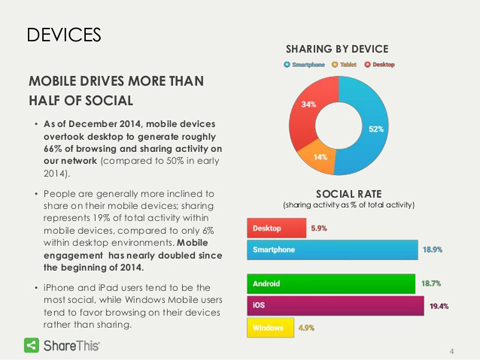
In 2014 consumers doubled their sharing activity on mobile, according to Q4 Social Sharing Report from ShareThis. Mobile device (or smartphone) users now spend 20% of their activity on that device sharing content. When using a desktop computer, they spend just 6% of their time sharing content. In fact, sharing activity on a desktop dropped 30.2% in 2014.

Key Takeaways: First, with mobile becoming the social focal point, ShareThis study authors recommend brands “adopt a mobile-first strategy” if your goal is to reach customers through social media. January 2015 research tells us that 80% of consumers now own a mobile device.
Second, since sharing is a social activity, it makes sense that consumers perform it from the privacy of their mobile devices and tablets, which they use more at their leisure. With desktops and laptops serving as work platforms, consumers would be concerned about employers tracking Internet activity there.
#2: Facebook Dominates All Channels in Sharing Activity
In the same study mentioned above, ShareThis compared the sharing activity for Facebook, Twitter, Pinterest, Tumblr and three more platforms. They found that Facebook outstripped the sharing activity of its next closest competitor, Pinterest, by more than 10 to 1. Eighty-one percent of all shares occurring on the seven channels combined (including email newsletter) originated on Facebook.
In Q4 2014, 81% of all shares came from Facebook. Lagging far behind was Pinterest, which originated 7% of all shares. This study did not measure Instagram.
Despite this statistic, keep in mind that ShareThis did not include Instagram in the study.
Instagram has a much higher rate of engagement than any of the channels in the ShareThis study. Our previous post linked above explores recent research on the engagement rate difference on social media channels. Several studies concluded that Instagram's engagement rate far outstrips Facebook, Twitter and Pinterest. Considering that “engagement” is made up of likes, shares and comments, we can assume that shares make up a reasonable portion of Instagram's engagement rate.
Keep in mind too that researchers find that both sharing and overall engagement rates are declining. TrackMaven's Content Marketing Paradox Report analyzed 2 years’ marketing activity for 8,800 brands, including 13.8 million pieces of content across seven marketing channels.
The chart below compares the rise of social content quantity with the decline of sharing and engagement. As more content floods the Internet, each piece is forced to compete for the limited number of readers available to consume it.
3 Days of World-Class Training—Zero Travel!

Couldn't make it to Social Media Marketing World and AI Business World this year? Get all of the great content at a fraction of the price with a Virtual ticket.
That’s full access to recordings of every keynote, workshop, and session—the ones people travel thousands of miles to see. Don't wait. Get your Virtual ticket and enjoy actionable content that you can watch anytime, anywhere.
The chart below also shows that in January 2013, brands were at an average of 25 posts per channel. That number doubled to 50 posts per channel by September 2014 before falling off a bit. Engagement rate went the opposite direction. Where the interaction rate in January 2013 per post was .35 per 1,000 followers or 3 interactions for 10,000 followers, by September 2014, that number had halved to about .15 per 1,000 followers.
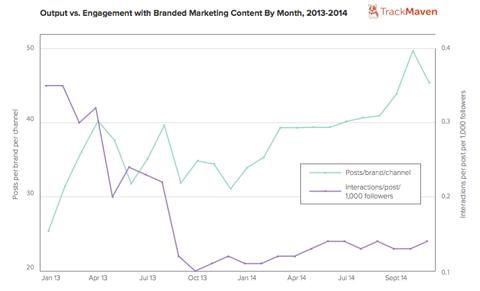
In a bracing statement, the study authors explain:
On social networks, brand-generated content is seeing the lowest engagement rates now than anytime in 2013 and 2014; 43% of professionally marketed blog posts receive fewer than 10 interactions. On Twitter, Pinterest, Google+, and LinkedIn, more than half of all posts receive fewer than 10 interactions (73%, 60%, 65%, and 68%, respectively).
Again, the TrackMaven study shares overall engagement, which includes likes and comments as well as shares. We can extrapolate that the number of shares trajectory is going the same direction.
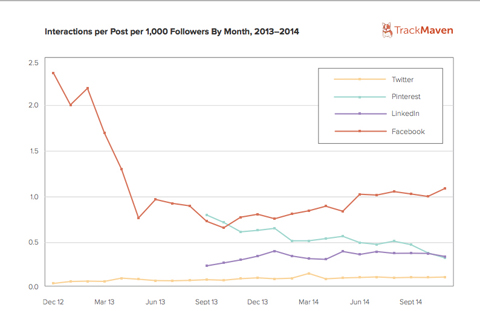
As the chart above demonstrates, Twitter gets the least sharing activity and Facebook the most. Don't forget that for now, Instagram has a far higher engagement/sharing rate than any of those platforms studied by TrackMaven.
Want to Unlock AI Marketing Breakthroughs?
If you’re like most of us, you are trying to figure out how to use AI in your marketing. Here's the solution: The AI Business Society—from your friends at Social Media Examiner.The AI Business Society is the place to discover how to apply AI in your work. When you join, you'll boost your productivity, unlock your creativity, and make connections with other marketers on a similar journey.
I'M READY TO BECOME AN AI-POWERED MARKETER#3: Consumers Share “List” and “Why?” Posts the Most
Have you heard of the “Listicle”? It's an article in list form, and it's one of the most shared types of content on Facebook and other channels. (Due to its popularity, “listicle” even made it into the Oxford English Dictionary in 2014.) From June to November 2014, web-based marketing tool company BuzzStream and agency Fractl tracked 220,000 pieces of content from 10 high-engagement and 10 low-engagement businesses. They found the most shared content took the form of “listicles” and “why content.”
So common they barely need explanation, “list” posts or “listicles” appear as the typical “5 Reasons to Create Personas for Your Business” or “The Top 7 Pinterest Marketing Strategies.” The number of “list” post shares measured in the study varied from 21,000 to 24,500 each month.
“Why content,” on the other hand, explains a concept or clarifies a topic. Also considered were “how-to” or “explainer” posts, which provide useful information. The “why” posts from the 220,000 pieces of content BuzzStream reviewed from September through November 2014 earned an average of 24,500 shares each month.
“What” posts often take the form of questions. Posts like, “What Is Your Spirit Animal?” or “What Character from Literature Would You Be?” charged across social media sites in 2014. While “what” posts did earn 29,000 shares in October, their share numbers tended to fall more in the 18,000 to 20,000 range, prompting study authors to deem them less reliable than “list” and “why” posts. In other words, those “What color is your aura?” posts may have been a short-lived fad.
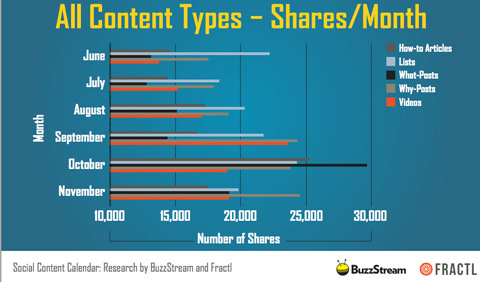
How-to articles and videos received the fewest shares overall.
Keep in mind that with lots of data from the biggest channels now available, researchers have figured out just which subjects are most popular on which platforms.
Social analytics and tools company ShareThis found that Facebook serves as the Internet water cooler and social salon where friendships dominate. Therefore, users discuss all kinds of topics. Conversely, other platforms provide a meeting ground for people who focus on certain categories. Beauty and Fitness, Food and Drink and Shopping dominated the conversations on Pinterest. And 2014 saw a surge in sports chatter, news and finance to some extent on Twitter.

Key Takeaways: “List” and “why” posts get the most shares, possibly because these formats fit the digital reader's habits. Both are scannable and concise. The “list” post promises to keep the reader's eye moving to the section that most interests him or her. The “why” post promises a short explanation of a topic the reader likely searched for. As for topics by channel, watching which industry gets discussed most on which channel could pay off.
#4: Post on Facebook During Early Afternoon
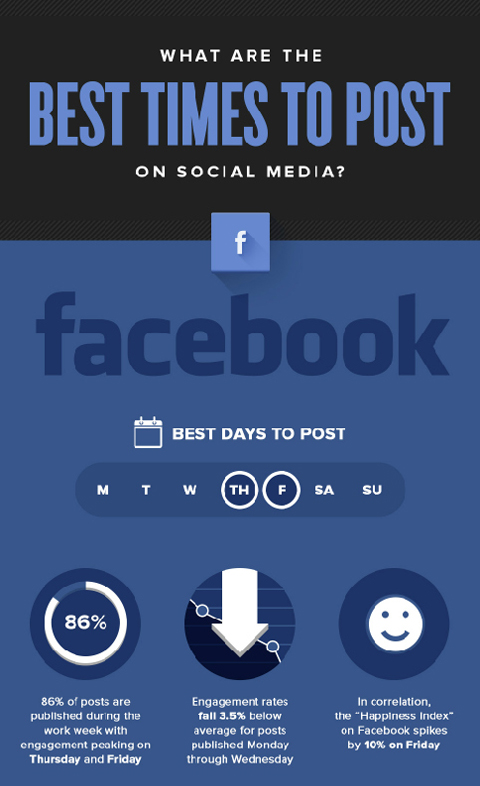
On his QuickSprout blog, Internet marketing entrepreneur Neil Patel compiled into an infographic the findings from 11 robust studies on the best times to post on social media. We've included just the Facebook findings below for the sake of space, but if you click the link above, the infographic covers Twitter, LinkedIn, Instagram, Pinterest and Google+ as well.
Consider these best times to post by channel:
- Twitter: 5:00 p.m. for highest retweets
- Facebook: 1:00 p.m. weekday afternoons to get the most shares
- LinkedIn: Most shares occur on Tuesdays from 10:00–11:00 a.m.
- Pinterest: 9:00 p.m. on Friday or Saturday nights has most traffic
- Google+: Best engagement is 9:00 a.m. on Wednesdays
- Instagram: For brands, evening hours
See the post linked above to get more specific findings.
Key Takeaways: While these times may feel random, Neil Patel claims that he raised his social media traffic (coming from his channels to his site) by 39% when he followed the guidelines. Always good to test!
Conclusion
Tailoring your social media strategy using these findings could help you get more shares and spread brand reach.
While nearly all companies stand to benefit from a presence on Facebook, social channels with smaller audiences still offer opportunities.
Businesses with younger audiences have opportunities on Instagram, where a 2015 Pew study found that 53% of all Internet users ages 18 to 29 are active. Half in that age group use Instagram daily.
Marketers in the athletic industry may get more share action on Twitter, which seems to be a gathering place for sports fans.
On Pinterest, retailers have a chance to provide the deals and new products users want to share with their friends. Sharing excellent content raises Pinterest users' profiles and gives them a way to connect with friends, building their relationships.
Finally, experimenting with posting times could prove a low-cost way to get more shares.
What do you think? How do you get the most shares of your content? Have you noticed times that work better than others? Leave your comments and questions below.

Curious About How to Use AI?
Our newest show, AI Explored, might be just what you're looking for. It's for marketers, creators, and entrepreneurs who want to understand how to use AI in their business.
It's hosted by Michael Stelzner and explores this exciting new frontier in easy-to-understand terms.
Pull up your favorite podcast app and search for AI Explored. Or click the button below for more information.
