 Are you responsible for reporting on social media ROI?
Do you need advice on what to share?
ROI reports justify the resources allocated to social media campaigns.
In this article I'll explore four important parts of a social media ROI report that decision makers want to see.
A Bird's-Eye View of ROI Reports
Social media ROI reports are based on prescribed objectives, the progress of the social campaign tasked with meeting those objectives, the analysis of key performance indicators (KPIs) and whether the original objectives are met.
While traditional media (e.g., TV, radio ads and billboards) may have immediate results your clients and management can see, social media results usually take more time and are less apparent, making it difficult to convey the positive return on social investments.
The key to presenting a strong case for the ROI of social media campaigns is to track, analyze and present data that justifies the brand's online investment.
In this article I'll be discussing some of the key sections and data to include in your ROI report to do just that.
#1: Reiterate Objectives and Metrics
Before you started your social campaign, you and your client or management likely worked together to create a hierarchy of objectives, decided which social platforms to use to meet those objectives and established which metrics to use to track progress and success.
Some important metrics to look at and compare among platforms are reach and engagement. For example, note the number of Facebook fans exposed to the client or to other brands and sponsors. This allows you to convey the brand's real reach and user reactions, and measure sentiment and virality.
In my ROI reports, I include primary metrics related to the client's website, Facebook, Twitter and YouTube. You can include more platforms as you experiment and gather data and results from other platforms.

As a side note, I want to introduce you to some tools that may make your job easier.
Start with an Excel spreadsheet. You're going to track a lot of data to compare and filter and compare again. Having a central place for that data makes analysis much easier.
Get World-Class Marketing Training — All Year Long!
Are you facing doubt, uncertainty, or overwhelm? The Social Media Marketing Society can help.
Each month, you’ll receive training from trusted marketing experts, covering everything from AI to organic social marketing. When you join, you’ll also get immediate access to:
- A library of 100+ marketing trainings
- A community of like-minded marketers
- Monthly online community meetups
- Relevant news and trends updates
Next, review the options below to find useful analytics for each platform.
Facebook Insights is available via a link on your page's dashboard (and the data are invaluable when putting together your report).
To find Instagram numbers, check out Iconosquare, formerly Statigram, Curalate (which also tracks Pinterest) or Nitrogram.
Pinterest offers its own analytics or you can use a third-party tool like Tailwind.
To track Twitter interactions like retweets, mentions and hashtags, take at look at Talkwalker, Tweet Binder or Twitonomy.
Of course, your best bet for tracking your Google+ success is Google Analytics (which is also ideal for websites and blogs).
If YouTube is part of your campaign, it offers its own Insights you can include in reports on brand appearances in videos (including logos and mentions) and the number of views each video has.
#2: Share Data Analysis
When possible, download the data from relevant platforms to a CSV file and open it in Excel so you can categorize and compare it easily based on your KPIs.
While the majority of your report focuses on social media marketing, include a list of traditional media coverage over the same time period as well.
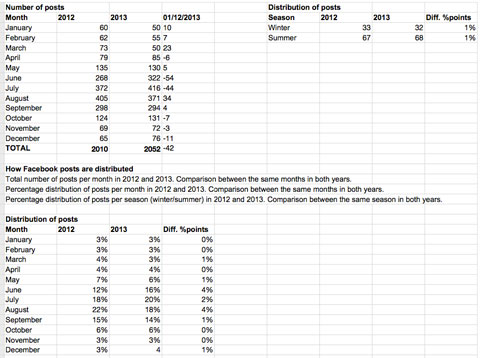
In sheet 1 of your spreadsheet, track how social media posts and traditional media were distributed over a specific time period and compare that time period for the same time last year. Include the percentage distribution of posts per season (e.g., winter/summer).
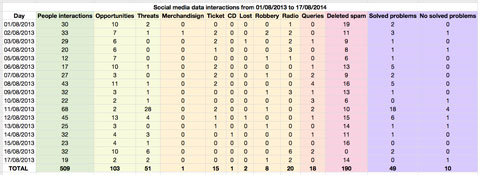
As you can imagine, it's particularly important to pay attention to all audience interaction with your social updates.
Note every comment and all feedback on brand-related posts, whether negative, positive or neutral (color-coding these categories can help you keep track).
This record serves to identify sales opportunities, successes (and failures) in the purchase process and client feedback.

Discover Proven Marketing Strategies and Tips
Want to go even deeper with your marketing? Check out the Social Media Marketing Podcast! Publishing weekly since 2012, the Social Media Marketing Podcast helps you navigate the constantly changing marketing jungle, with expert interviews from marketing pros.
But don’t let the name fool you. This show is about a lot more than just social media marketing. With over 600 episodes and millions of downloads each year, this show has been a trusted source for marketers for well over a decade.
Because Facebook generally has a large influence on the success of a social campaign, it's a good idea to report on your Facebook reach (the number of fans exposed to your updates).
Tell your client or management how Facebook posts (both organic and paid) impacted the overall reach to the primary and secondary target audiences and include the number of comments and shares. All of them together help measure sentiment and virality.
Another important way of showing success is to share the total number of fans and followers the brand gained as a result of the actions visitors carried out because of calls to action in your updates.
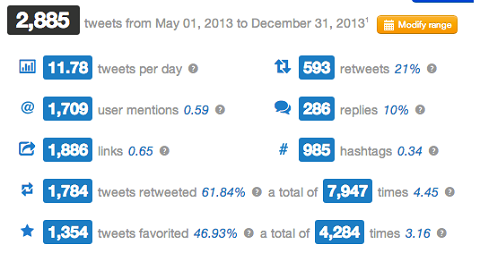
You should also keep a close eye on Twitter. Track hashtags to determine the reach and impact of tweets and retweets.
My company partnered with Fundesem Business School to host an event called #InternetCambiaTodo (Internet Changes Everything) and used a specific hashtag to assess the number of tweets that referred back to the brand.
We used Twitonomy to gather all sorts of key insights including the number of retweets with a brand mention, unique users, impressions, influential tweets, participation, common keywords and user location.
When you analyze data from the client's website, you may need to look at various sources to discover where your traffic is originating. Keep track of general impressions and clicks on ads and banners you've placed for the brand, as well as how that incoming traffic completed or fell off the purchase path.
A boost in the number of people visiting the website increases the number of conversions and the chances that more people purchase your product or service. (And those numbers are directly related to the growth of social media fans and followers.)
Finally, tell your client which actions visitors completed once they entered the brand's website and make recommendations on how to add more indirect value to the process.
Don't worry if you don't have much of the information mentioned here, you can substitute other relevant data that provides similar value.
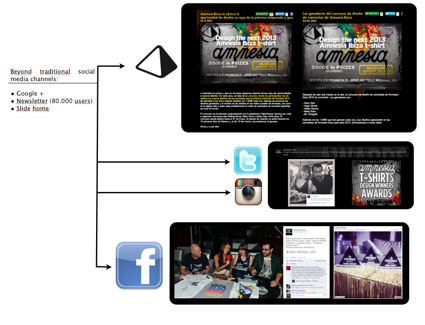
#3: Report Co-Branding Results
What works for our company is creativity and co-branding. We implemented a contest for Mixcloud – Pioneer – Amnesia where the winner got to play one of the most important gigs on the planet.
Offering such a great prize guaranteed further reach and increased engagement on our posts, which we measured directly from each platform's insights or analytics tools.
We were able to report that the contest resulted in 200,000 visits to the client's website, exposure to our partner (Pioneer) among its potential target audience (the community of DJs, producers and electronic music aficionados), more than 25,000 new followers for the client's Mixcloud account and 10,000 new followers for the sponsor.
Here is an example of how we presented our results for another co-branding campaign we did using the Talenthouse crowdfunding platform:
If you run online giveaways or contests in your campaign, report how many contests you host and the results of each. Be sure to show especially the growth in total number of new likes and comments, retweets, etc.
#4: Emphasize Return Actions
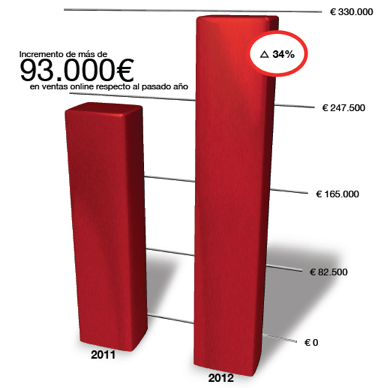
Your client and management really want to know whether the social media campaigns led to qualified leads and sales. Give them data on total sales, traffic and purchase intentions per week.
Include the type of audience that not only responded to the social updates, but also clicked through to the sales funnel as well.
Finally, calculate how may people purchased peripheral products including merchandise, images, DVDs, music, etc.
Conclusion
As you prepare a social media ROI report, your aim is to motivate the client or management to continue making a commitment to social media efforts.
Your client and management want to hear positive results of course, but don't be afraid to present any negative mentions as well—just be sure to provide a solution for each negative instance.
Throughout your report, account for and promote any elements that support the investment (both time and money) made by your company, clients or sponsors (or to attract the latter to your brand).
Such elements aren't purely social or digital, but rather anything that adds value to the organization (e.g., increased fans; more website traffic; or more leads, conversions and sales) and meets your overall objectives.
For maximum impact, use visual components in your report to convey important results, and share information in short, scannable paragraphs as often as possible.
When you're ready to present your ROI results, PDF and PowerPoint are effective visual options to reinforce your findings.
What do you think? What other measurements would you include in your social media ROI report? How do you report on online investment results? Share your thoughts in the comments.
Images from iStockPhoto.
Attention Agency Owners, Brand Marketers, and Consultants

Introducing the Marketing Agency Show–our newest podcast designed to explore the struggles of agency marketers.
Join show host and agency owner, Brooke Sellas, as she interviews agency marketers and digs deep into their biggest challenges. Explore topics like navigating rough economic times, leveraging AI, service diversification, client acquisition, and much more.
Just pull up your favorite podcast app, search for Marketing Agency Show and start listening. Or click the button below for more information.
