 Do you use Google Analytics to help you make marketing decisions?
Are you familiar with the latest changes in Google Analytics?
Google recently made the switch to secure search, which has resulted in a larger return of “not provided” keyword data in Analytics reports.
For marketers who used the information to guide their marketing and content, the loss of keyword data has been quite a blow.
Fortunately, Google also updated Analytics with more than 14 new features that are incredibly useful to business owners who make decisions based on how their audience interacts with their website and social profiles.
In this article, I'll share what's new in Google Analytics and how you can make the most of these changes to benefit your business.
#1: New Google Analytics Reports
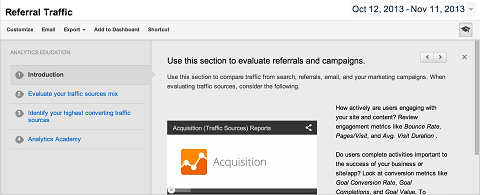
When you log into your updated Google Analytics account, you'll notice that Traffic Sources and Content have been replaced by Acquisition and Behavior.
The new Acquisition section offers you two new views: Overview and Channels.
The Overview report displays Analytics ABC data for your top channels (e.g., Social, Organic, Direct), sources (e.g., Facebook, Twitter, LinkedIn) or media (e.g., Organic, Referral, Email).
Essentially, the Overview report helps you see which channels bring in the most visitors, which channels bring in engaged visitors and which channels bring in visitors who convert into email subscribers or customers.
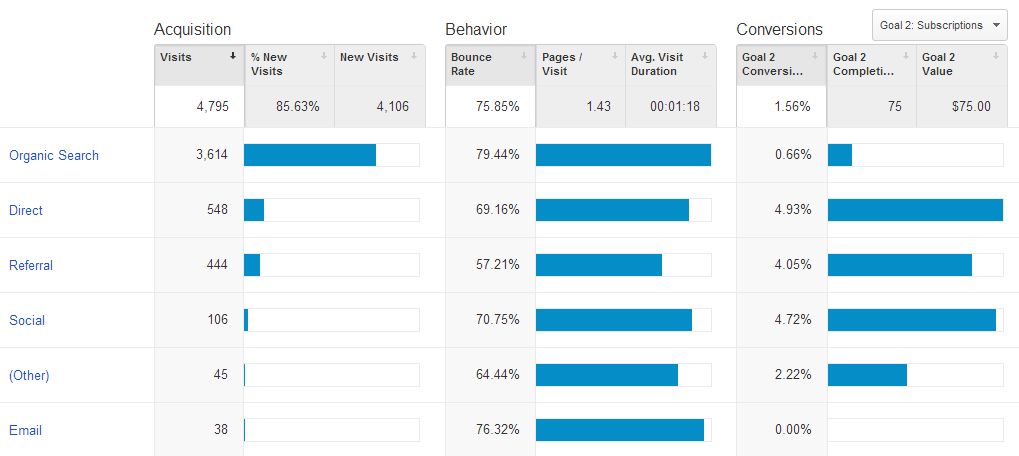
While the Overview report displays a summary of data, the Channels report displays a more detailed view of your visitor acquisition on a per-channel basis.
The most interesting part of this new Acquisition report is that you can define the channel groupings, which allows you to track different sources or media in a customized, consolidated group.
If you're not happy with the default channel groupings, you can change them and add your main media or sources of traffic in different groups.
Get World-Class Marketing Training — All Year Long!
Are you facing doubt, uncertainty, or overwhelm? The Social Media Marketing Society can help.
Each month, you’ll receive training from trusted marketing experts, covering everything from AI to organic social marketing. When you join, you’ll also get immediate access to:
- A library of 100+ marketing trainings
- A community of like-minded marketers
- Monthly online community meetups
- Relevant news and trends updates
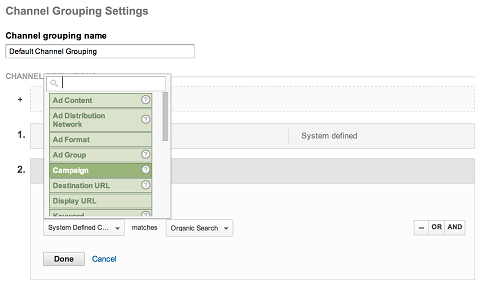
For example, you can group different traffic sources such as Facebook, Twitter and Google+ under the same group and call it “Social.”
Additionally, the Social section has a new Trackbacks report that displays all the back links with the landing pages they link to on your website.
#2: New Analytics ABC Reporting
A significant change in Google Analytics is the introduction of Analytics ABC, which is a new format for some of the Google Analytics reports that group data based on acquisition, user behavior and conversions.
This new report helps you see information about the acquisition of new visitors, how they behave on your website and how they convert into loyal readers, engaged visitors, email subscribers or customers.
You'll be able to see Analytics ABC in action primarily in the Overview report under Acquisition (more on this new section below), but also in other reports such as Location, Demographics, New vs. Returning and Landing Pages.
The biggest outcome of this change is that now you see a variety of conversion data in the summary view of the report.
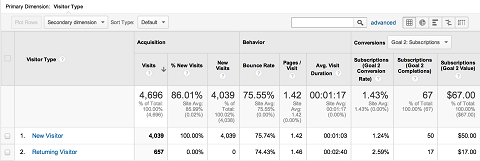
And if you track conversions for multiple goals, you can change the conversion goal in the Conversion group. Now you can see the same report conversion data for different goals without a lot of effort. How cool is that?
#3: Better, Faster and Smarter Segmentation
The segments in Google Analytics are now easier for new users to navigate, and at the same time are more powerful for advanced marketers and analysis experts.
Along with a new user interface, you can segment your visitors, do cohort analysis and create segment templates.
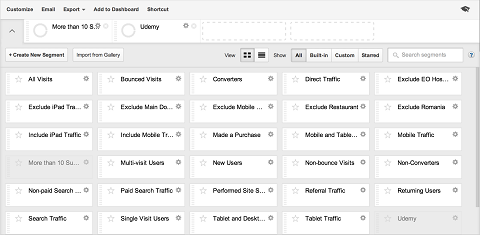
You can create your own new segment or import a predefined segment from the Google Analytics Gallery, where you can find popular segments created by the Google Analytics team.
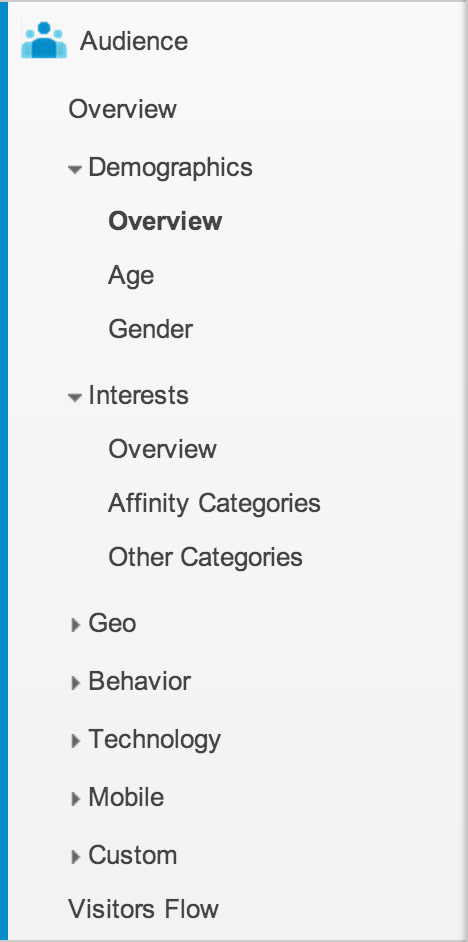
#4: New Demographic Data
Until recently, a demographic dataset was missing from Google Analytics.

Discover Proven Marketing Strategies and Tips
Want to go even deeper with your marketing? Check out the Social Media Marketing Podcast! Publishing weekly since 2012, the Social Media Marketing Podcast helps you navigate the constantly changing marketing jungle, with expert interviews from marketing pros.
But don’t let the name fool you. This show is about a lot more than just social media marketing. With over 600 episodes and millions of downloads each year, this show has been a trusted source for marketers for well over a decade.
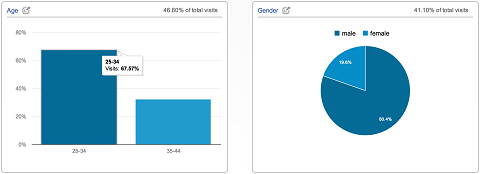
Now, data collected from DoubleClick third-party cookies is available in the new Demographic report. You'll see valuable information about your audience's gender, age and interests with just a couple of clicks.
No more guessing about who your ideal customer is. You can do things like:
- Figure out the demographics of your top 15% customers.
- Improve your remarketing campaigns in Google AdWords by targeting specific segments of your audience with different ads.
- Use Demographics and Interests to analyze A/B tests.
- Use Content Experiments from within Google Analytics to conduct A/B tests and then use Age segments to interpret the results and see which version of your test works for different segments.
To start seeing these reports, you'll need to activate Demographics data by following these steps:
- Change your tracking code to support display advertising.
- Update your privacy policy to meet the policy requirements for display advertising.
- Enable demographic data in the Audience reports.
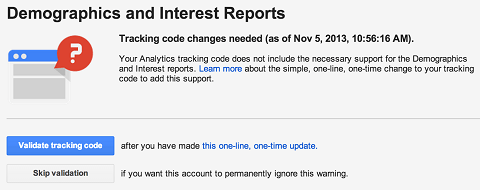
And don't make this mistake when you change the Google Analytics tracking code.
Once you've finished the setup, you should see demographics data in your account in about 24-48 hours.
#5: New Tag Manager Auto-Event Tracking
The Google Tag Manager update makes measuring things like calls to action or clicks on ads with event tracking easier by introducing Auto-Event Tracking. Now there's no HTML or JavaScript code to worry about during your setup.
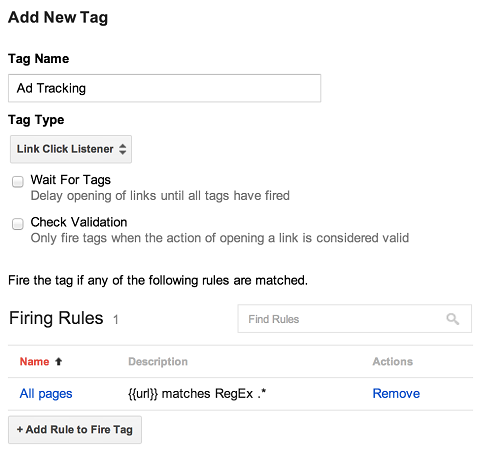
Google Tag Manager is essentially a free tool that allows you to easily manage the tracking codes you install on your websites, such as the Google Analytics tracking code, remarketing tracking pixels, AdWords Conversion Tracking or even Facebook Conversion Tracking.
You can manage all of the tracking codes from one place and edit them without having to manually edit the HTML of your site every time you do it.
To learn more about Auto-Event Tracking in the Google Tag Manager and how to integrate it, watch this video created by Justin Cutroni.
Learn more about how you can set up Auto-Event Tracking in Google Tag Manager.
#6: Improved User Education
Along with the interface changes, Google Analytics has introduced new and improved educational resources.
They've added walkthrough videos within the tools and introduced the Analytics Academy and the Digital Analytics Fundamentals course, which provides a foundation for marketers and business owners who want to better understand the principles of analytics and improve their business outcomes.
Conclusion
Now that you've read about the latest Google Analytics changes, log in! Use this article to explore and help you learn more about your online audience, easily track conversion data and make better marketing decisions for your business.
What do you think? Are you excited about the changes in Google Analytics? Which new feature or enhancement will have the biggest impact on your business? Share your thoughts in the comments section below.
Attention Agency Owners, Brand Marketers, and Consultants

Introducing the Marketing Agency Show–our newest podcast designed to explore the struggles of agency marketers.
Join show host and agency owner, Brooke Sellas, as she interviews agency marketers and digs deep into their biggest challenges. Explore topics like navigating rough economic times, leveraging AI, service diversification, client acquisition, and much more.
Just pull up your favorite podcast app, search for Marketing Agency Show and start listening. Or click the button below for more information.
